
Asia Pacific Physical AI Market (2026-2031)

The Asia Pacific Physical AI Market was valued at $693.3 Million in 2026 and projected to reach to $7831.9 Million by 2031, representing a compound annual growth rate of 49.8%. Asia Pacific is positioned as the fastest-growing Physical AI market globally, driven by rapid industrialization, substantial investments in autonomous systems, and the region's dominance in semiconductor manufacturing.


| Market Size in | USD 26.32 MN |
| Market Forecast in | |
| CAGR | |
| Forecast Period | |
| Units Considered | Value (USD MN) |
Asia Pacific Physical AI Market Trends and Insights
- Valued at $693.3 million in 2026, the Asia Pacific Physical AI Market is expected to expand dramatically to $7,831.9 million by 2031, driven by rapid industrialization, advanced manufacturing capabilities, and substantial investments in robotics and autonomous systems across the region.
- Asia Pacific's dominance in semiconductor production and electronics manufacturing positions it as a natural epicenter for Physical AI deployment. The region's growth trajectory reflects accelerating demand for intelligent robotics, autonomous vehicles, and edge computing solutions that integrate physical systems with artificial intelligence.
- Asia Pacific's competitive manufacturing ecosystem, coupled with government initiatives supporting Industry 4.0 and smart factory development, fuels this expansion.
- Key markets within Asia Pacific—including China, Japan, South Korea, and Southeast Asia—are rapidly scaling Physical AI applications across automotive, electronics assembly, logistics, and consumer goods sectors. By 2031, Asia Pacific is projected to command a substantial share of global Physical AI investment, with the 49.8% CAGR underscoring the region's strategic importance in the semiconductor and electronics value chain.
- This growth reflects both technological advancement and the region's pivotal role in reshaping global manufacturing through intelligent automation..
Key Market Statistics
- CAGR (2026-2031) 49.8% CAGR
- Market Size, 2026 ~USD 693.3 Million
- Forecast, 2031 ~USD 7831.9 Million
- Geography Asia Pacific
Asia Pacific Physical AI Market Overview
Explosive Growth Trajectory :
Asia Pacific Physical AI market is projected to grow from $693.3 million in 2026 to $7,831.9 million by 2031, representing a robust 49.8% CAGR, outpacing the global average of 47.2%.
China's Market Dominance :
China leads the Asia Pacific region with a market size of $3,759.3 million, driven by aggressive automation initiatives, semiconductor manufacturing expansion, and government support for AI-integrated robotics.
Diversified Regional Powerhouses :
Japan ($1,253.1M), India ($1,018.1M), and South Korea ($861.5M) represent significant growth engines, each contributing unique strengths in advanced manufacturing, software development, and semiconductor innovation.
Manufacturing & Robotics Hub :
Asia Pacific's advanced manufacturing ecosystem, coupled with rising labor costs and Industry 4.0 adoption, is accelerating Physical AI deployment across electronics, automotive, and precision engineering sectors.
Asia Pacific Physical AI Market Dynamics
- Countries like China, Japan, and South Korea are spearheading innovation in robotics and AI-integrated production systems, while India emerges as a significant growth market with expanding manufacturing capabilities. The region's competitive advantage stems from established electronics supply chains, skilled workforce availability, and government initiatives promoting Industry 4.0 adoption.
- By 2031, Asia Pacific is expected to capture a substantial share of global Physical AI spending, with applications spanning semiconductor fabrication, consumer electronics assembly, automotive manufacturing, and logistics automation..
Market Ecosystem
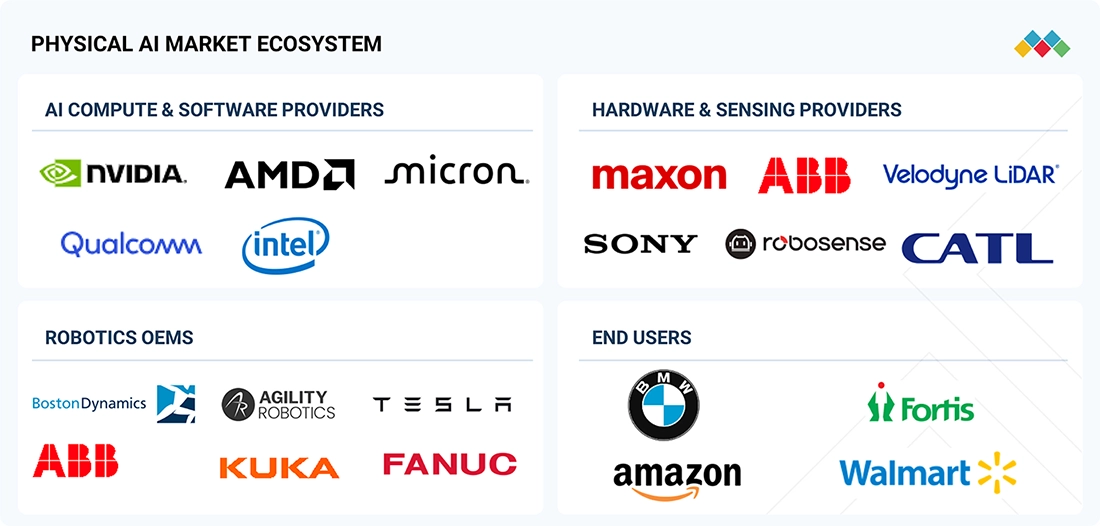
PHYSICAL AI MARKET SIZE, SHARE, GROWTH, REPORT 2025 TO 2032: COMMERCIAL USE CASES ACROSS INDUSTRIES
| COMPANY | USE CASE DESCRIPTION | BENEFITS |
|---|---|---|
 |
Deployment of Figure 02 humanoid robots for sheet-metal handling in BMW’s Spartanburg plant, performing precision pick-and-place tasks within automotive assembly lines; the robots operated in real production environments, integrating with existing workflows and industrial systems while meeting strict cycle time and accuracy requirements. | Validated humanoid deployment in high-volume manufacturing, contributing to production of 30,000+ vehicles | Achieved high precision within tight tolerances and sustained daily operations with minimal intervention | Demonstrated scalability and reliability of humanoid automation in complex industrial settings |
 |
Deployment of Digit humanoid robots in logistics facilities for autonomous tote handling, including picking, transferring, and stacking across workflows; the robots operate in human-centric environments and integrate with existing warehouse infrastructure without requiring major modifications | Handled over 100,000 totes, demonstrating high-throughput and operational reliability | Enabled workforce optimization by shifting human labor to higher-value tasks | Established clear ROI potential through scalable, multi-task automation in dynamic logistics environments |
 |
Deployment of Moxi humanoid robots in hospitals to autonomously transport medical supplies, lab samples, and medications across departments; the robots integrate into existing hospital workflows and utilize AI-driven navigation, task management, and real-time coordination | Completed over 1 million deliveries, significantly improving operational efficiency | Reduced workload on clinical staff, saving over 575,000 hours and enabling greater focus on patient care | Enhanced hospital productivity and streamlined internal logistics |
 |
Deployment of Spot quadruped robots for autonomous inspection, monitoring, and safety operations across industrial sites, energy facilities, and defense applications; the robots use AI-enabled sensing and mobility to operate in hazardous and complex environments | Improved safety by reducing human exposure to dangerous conditions | Enabled predictive maintenance and minimized downtime through continuous monitoring | Delivered operational efficiency and ROI across multiple industries and global deployments |
Logos and trademarks shown above are the property of their respective owners. Their use here is for informational and illustrative purposes only.
Related Ecosystem
Drones And Robotics
- Sensors
- Articulated Robots
- Cartesian Robots
- Scara Robots
- Actuators
- ABB India Limited
- KUKA AG
- MOMENTIVE PERFORMANCE MATERIALS INC.
- STAUBLI INTERNATIONAL AG
- Fanuc Corporation
Electronics System And Components
- Sensors
- Temperature Sensors
- Pressure Sensors
- Actuators
- Image Sensors
- Lenovo
- Samsung
- Texas Instruments Incorporated
- HONEYWELL INTERNATIONAL INC.
- Teledyne Technologies Incorporated
Industrial Automation
- Sensors
- Image Sensors
- Manufacturing Execution System (MES)
- Actuators
- Flow Sensors
- Siemens ag
- ABB India Limited
- Emerson Electric Co.
- HONEYWELL INTERNATIONAL INC.
- SCHNEIDER ELECTRIC SE
Key Takeaways
- Asia Pacific Physical AI Market will grow from $693.3M (2026) to $7,831.9M (2031) at a 49.8% CAGR, significantly outpacing global growth.
- Asia Pacific's semiconductor and electronics manufacturing dominance makes it the primary driver of Physical AI adoption globally.
- Government-backed Industry 4.0 initiatives and smart factory investments across China, Japan, and South Korea accelerate Physical AI deployment.
- Intelligent robotics, autonomous systems, and edge computing solutions are reshaping Asia Pacific's manufacturing and logistics sectors through 2031.
Physical AI Market Report Scope
| Report Metric | Details |
|---|---|
| Base Year | 2026 |
| Fastest Growing Segment | LEVEL 3: ADVANCED (Level Of Autonomy) |
| Forecast Period | 2026–2031 |
| Growth Rate | CAGR of 47.2% from 2026 to 2031 |
| Largest Segment | HARDWARE (Offering) |
| Market Size Base Year (Billions) | ~USD 1.5 (2026) |
| Revenue Forecast (Billions) | ~USD 10.35 (2031) |
| Segments Covered | Offering, Type, Robot Type, Vertical, Level Of Autonomy |
Asia Pacific Physical AI Market Report Segmentation
5 segment dimensions are covered across the global market.
By Offering
- Hardware
- Services
- Software
By Type
- Actuators
- Asics
- Dsps
- Encoders
- Force & Torque Sensors
- Fpgas
- Gpus
- Image Sensors
- Imus
- Lidar
- Memory
- Processing & Compute Hardware
- Radar Sensors
- Sensors
- Socs
- Tactile & Pressure Sensors
- Ultrasonic Sensors
By Robot Type
- Industrial Robots
- Personal & Household Robots
- Professional Service Robots
By Vertical
- Automotive
- Defense & Security
- Education
- Healthcare
- Industrial Automation
- Logistics & Supply Chain
- Other Verticals
- Retail
By Level Of Autonomy
- Level 1: Basic
- Level 2: Intermediate
- Level 3: Advanced
Target Audience
- Semiconductor & Electronics Manufacturers : Require detailed market intelligence on Physical AI adoption in manufacturing to optimize production automation, improve yield rates, and maintain competitive advantage in Asia Pacific's high-volume production environment.
- Robotics & Automation Solution Providers : Need regional market data to identify growth opportunities, assess demand for Physical AI-enabled robots, and develop localized solutions for Asia Pacific's diverse industrial sectors and customer requirements.
- Investment & Private Equity Firms : Seek comprehensive market analysis to evaluate investment opportunities in Physical AI startups, automation companies, and semiconductor firms across Asia Pacific's high-growth markets.
- Technology & Strategy Consultants : Require detailed regional insights to advise clients on market entry strategies, competitive positioning, and technology adoption roadmaps specific to Asia Pacific's Physical AI landscape.
- Government & Policy Organizations : Need market intelligence to inform industrial policy, R&D funding decisions, and regulatory frameworks supporting Physical AI adoption and manufacturing competitiveness across Asia Pacific nations.
Key Companies in the Asia Pacific Physical AI Market
| Company | HQ | Ownership | Strongest segments |
|---|---|---|---|
| NVIDIA CORPORATION | United States | ||
| ABB | India | Public Company | Industrial Robots,Professional Service Robots,Personal & Household Service Robots, |
| MOOG INC. | United States | Public Company | Actuators and Motion-Control Hardware,Sensors and Feedback Components,Control Software and Embedded Electronics, |
| TEXAS INSTRUMENTS INCORPORATED | United States | Public Company | SoC & Embedded Processing for Physical AI,Analog Signal Chain & Sensors,Power Management & Actuation Support, |
| STMICROELECTRONICS | Switzerland | ||
| SK HYNIX INC. | South Korea | Public Company | DRAM for AI servers and accelerators,Graphics and mobile DRAM for edge AI and robots,NAND flash and SSDs for AI storage, |
| INFINEON TECHNOLOGIES AG | Germany | Public Company | Sensors (3D ToF, radar, MEMS, environmental),Power Semiconductors (IGBT, SiC, GaN, MOSFETs, drivers),Microcontrollers & SoCs, |
| BOSCH SENSORTEC GMBH | India | Subsidiary | Sensors,SoC / Smart Sensor Hubs,Software, |
| ADVANCED MICRO DEVICES, INC. | United States | Public Company | GPU (Radeon, Instinct, Radeon Pro),SoC & CPU (Ryzen, EPYC, Ryzen AI, Embedded),FPGA & Adaptive SoC (Versal, Zynq, Virtex, Kintex, Artix, Spartan), |
| NXP SEMICONDUCTORS | Netherlands | Public Company | SoC & Microcontrollers for Edge AI,Sensors (Environmental, Inertial, Magnetic, Gyroscopic),Connectivity SoCs (UWB, NFC, BLE, Wi-Fi, Zigbee, Thread), |
| SAMSUNG | Korea, South | Public Company | Memory,SoC,GPU, |
| MICRON TECHNOLOGY, INC. | United States | Public Company | Memory (DRAM, LPDDR, graphics, HBM, data center memory),Storage (data center SSD, client and industrial SSD, managed NAND),Software, tools, and firmware, |
| HORIZON ROBOTICS | China | Public Company | SoC (Journey and related automotive-grade compute),Software (Mono, SuperDrive, perception and driving stacks),Services (integration, customization, and support), |
NVIDIA CORPORATION
NVIDIA Corporation is a United States-based technology company.
ABB
ABB is a public company founded in 1883 and operates in India with 111,900 employees.
MOOG INC.
Moog Inc. is a public company founded in 1951 in the United States and employs 13,500 people.
TEXAS INSTRUMENTS INCORPORATED
Texas Instruments Incorporated is a public company founded in 1930 in the United States with 33,000 employees.
STMICROELECTRONICS
STMicroelectronics is a technology company based in Switzerland.
SK HYNIX INC.
SK Hynix Inc. is a public company founded in 1949 in South Korea with 47,639 employees.
INFINEON TECHNOLOGIES AG
Infineon Technologies AG is a public company founded in 1952 in Germany with 56,500 employees.
BOSCH SENSORTEC GMBH
Bosch Sensortec GmbH is a subsidiary company founded in 2005 and operates in India.
ADVANCED MICRO DEVICES, INC.
Advanced Micro Devices, Inc. is a public company founded in 1969 in the United States with 31,000 employees.
NXP SEMICONDUCTORS
NXP Semiconductors is a public company founded in 2006 in the Netherlands with 32,169 employees.
SAMSUNG
Samsung is a public company founded in 1969 in South Korea with 128,735 employees.
MICRON TECHNOLOGY, INC.
Micron Technology, Inc. is a public company founded in 1978 in the United States with 53,000 employees.
HORIZON ROBOTICS
Horizon Robotics is a public company founded in 2015 in China with 2,303 employees.
Countries within Asia Pacific - compare and drill down
| Country | 2025 size (native) |
|---|---|
| China | USD 3759.3 Million |
| Japan | USD 1253.1 Million |
| South Korea | USD 861.5 Million |
| India | USD 1018.1 Million |
| Rest Of Asia Pacific | USD 939.8 Million |
Country market size visualization
Reasons to Buy this Report
- Regional Market Segmentation : Gain detailed insights into country-specific Physical AI adoption patterns across China, Japan, India, South Korea, and emerging markets within Asia Pacific to identify high-potential investment opportunities.
- Competitive Landscape Analysis : Understand regional competitive dynamics, key players, and market consolidation trends specific to Asia Pacific's Physical AI ecosystem to inform strategic positioning and partnership decisions.
- Growth Driver Identification : Access comprehensive analysis of region-specific growth catalysts including manufacturing expansion, government policies, semiconductor demand, and automation investments driving the 49.8% CAGR.
- Localized Demand Forecasts : Leverage country-level market projections through 2031 to optimize resource allocation, supply chain planning, and go-to-market strategies tailored to Asia Pacific's diverse economic landscapes.
- Technology Adoption Trends : Identify sector-specific Physical AI applications and adoption rates across electronics, automotive, and industrial manufacturing in Asia Pacific to guide product development and market entry strategies.
Frequently asked questions
What is the projected size of the Asia Pacific Physical AI Market by 2031?
The Asia Pacific Physical AI Market is projected to reach $7,831.9 million by 2031, growing from $693.3 million in 2026 at a 49.8% CAGR.
Which countries in Asia Pacific are leading Physical AI adoption?
China, Japan, South Korea, and Southeast Asian nations are leading Physical AI adoption in Asia Pacific, driven by advanced manufacturing ecosystems and government Industry 4.0 initiatives.
What are the primary applications of Physical AI in Asia Pacific?
Key applications include intelligent robotics, autonomous vehicles, smart factory automation, logistics optimization, and edge computing solutions across automotive, electronics, and consumer goods sectors.
How does Asia Pacific's Physical AI growth compare to global trends?
Asia Pacific's 49.8% CAGR exceeds the global 47.2% CAGR, reflecting the region's strategic importance in semiconductor manufacturing and accelerated adoption of intelligent automation.
What factors are driving Physical AI market expansion in Asia Pacific?
Key drivers include rapid industrialization, advanced manufacturing capabilities, government-backed smart factory initiatives, semiconductor production dominance, and rising demand for autonomous systems and robotics.
RESEARCH METHODOLOGY
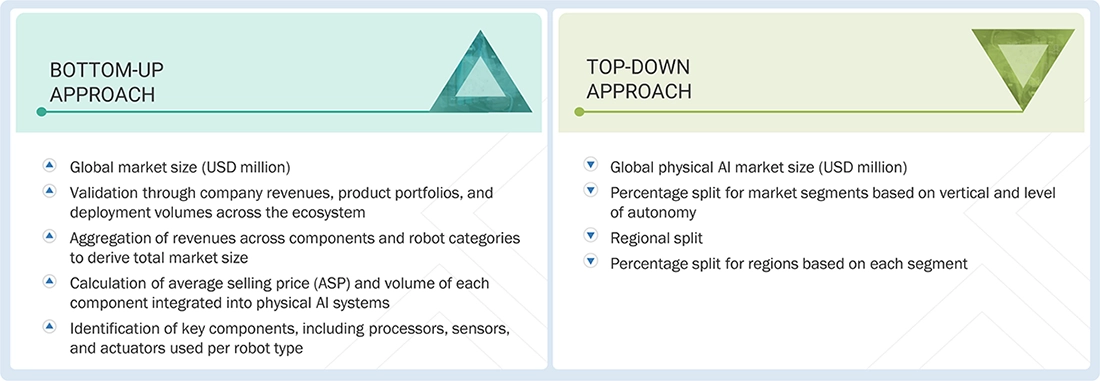
The study involved four major activities in estimating the current size of the physical AI market. Exhaustive secondary research collected information on the market, peer, and parent markets. The next step was to validate these findings, assumptions, and sizing with industry experts across the value chain through primary research. Both top-down and bottom-up approaches were employed to estimate the complete market size. After that, market breakdown and data triangulation techniques were used to estimate the market size of segments and subsegments.
Secondary Research
The secondary research process has referred to various secondary sources to identify and collect necessary information for this study. The secondary sources include annual reports, press releases, and investor presentations of companies; white papers; journals and certified publications; and articles from recognized authors, websites, directories, and databases. Secondary research was mainly used to obtain key information about the supply chain of the industry, the total pool of market players, classification of the market according to industry trends to the bottom-most level, regional markets, and key developments from the market and technology-oriented perspectives. Secondary data was collected and analyzed to determine the overall market size, which was further validated through primary research.
Primary Research
Extensive primary research has been conducted after obtaining information about the current scenario of the small satellite market through secondary research. Several primary interviews have been conducted with market experts from the demand and supply sides across North America, Europe, Asia Pacific, the Middle East, and the Rest of the World. This primary data has been collected through questionnaires, emails, and telephonic interviews.
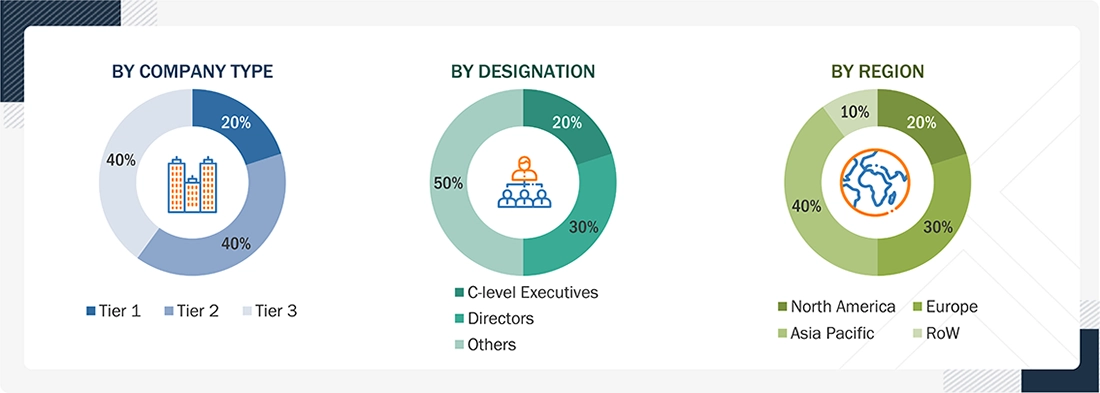
Notes: Other designations include technology heads, media analysts, sales managers, marketing managers, and product managers.
The three tiers of the companies are based on their total revenues as of 2024; Tier 1: >USD 1 billion, Tier 2: USD 500 million–1 billion, and Tier 3: <USD 500 million.
To know about the assumptions considered for the study, download the pdf brochure
Market Size Estimation
In the complete market engineering process, top-down and bottom-up approaches and several data triangulation methods were used to estimate and forecast the overall market segments and subsegments listed in this report. Key players in the market were identified through secondary research, and their market shares in the respective regions were determined through primary and secondary research. This entire procedure includes the study of annual and financial reports of the top market players and extensive interviews for key insights (quantitative and qualitative) with industry experts (CEOs, VPs, directors, and marketing executives).
All percentage shares, splits, and breakdowns were determined using secondary sources and verified through primary sources. All the parameters affecting the markets covered in this research study were accounted for, viewed in detail, verified through primary research, and analyzed to obtain the final quantitative and qualitative data. This data was consolidated and supplemented with detailed inputs and analysis from MarketsandMarkets and presented in this report.
Physical AI Market : Top-Down and Bottom-Up Approach
Data Triangulation
After arriving at the overall market size, the market was split into several segments and subsegments using the market size estimation processes explained above. Data triangulation and market breakdown procedures were employed to complete the entire market engineering process and determine the exact statistics of each market segment and subsegment. The data was triangulated by studying various factors and trends from the demand and supply sides in the physical AI market.
Market Definition
Physical AI refers to artificial intelligence embedded within robots and autonomous machines that enables them to perceive, interpret, and interact with the physical world through real-time on-device processing. These systems integrate hardware components, such as edge AI processors, sensors, and actuation systems, with intelligent software platforms that enable perception, navigation, manipulation, and decision making. Physical AI systems operate across different levels of autonomy, ranging from reactive automation to advanced reasoning capabilities. They are implemented in robotic platforms, including industrial robots, professional service robots, and personal and household robots, supporting applications across sectors such as healthcare, industrial automation, automotive, logistics and supply chain, defense and security, retail, and education.
Key Stakeholders
- Government bodies and policymakers
- Robotics and AI industry associations
- Robotics manufacturers
- Semiconductor and AI chip companies
- Sensor technology providers
- Actuator and motor manufacturers
- Robotics software platform providers
- Edge computing providers
- Original equipment manufacturers (OEMs)
- System integrators
- Technology and solution providers
- Simulation and digital twin providers
- Research institutes and universities
- Defense and security organizations
- Enterprise end users
- Venture capital and technology investors
- Intellectual property providers
- Market research and consulting firms
- Industry analysts and strategists
- Forums, alliances, and associations
Report Objectives
- To define, describe, and forecast the size of the physical AI market, by offering, robot type, level of autonomy, and vertical, in terms of value
- To forecast the size of market segments with respect to four regions, namely North America, Europe, Asia Pacific, and RoW, in terms of value
- To identify and analyze key drivers, restraints, opportunities, and challenges influencing the growth of the market
- To offer an ecosystem analysis, value chain analysis, case study analysis, patent analysis, technology analysis, pricing analysis, Porter’s five forces analysis, and regulations pertaining to the market
- To strategically analyze micromarkets with respect to individual growth trends, prospects, and contributions to the total market
- To strategically profile key players and comprehensively analyze their market shares and core competencies
- To analyze the opportunities in the market for stakeholders and describe the competitive landscape of the market
- To study competitive developments, such as collaborations, partnerships, product launches/developments, and acquisitions, in the market
Available customizations:
With the given market data, MarketsandMarkets offers customizations according to the specific requirements of companies. The following customization options are available for the report:
Regional Analysis
- Additional country-wise breakdown for North America, Europe, the Asia Pacific, and the Rest of the World
Company Information
- Detailed analysis and profiling of additional market players (up to five)
Get the Full Physical AI Market Report
Full forecast, segment splits, and company analysis for all Physical AI Market.
- US Physical AI Market
- Canada Physical AI Market
- Mexico Physical AI Market
- Germany Physical AI Market
- UK Physical AI Market
- France Physical AI Market
- Italy Physical AI Market
- Rest Of Europe Physical AI Market
- China Physical AI Market
- Japan Physical AI Market
- South Korea Physical AI Market
- India Physical AI Market
- Rest Of Asia Pacific Physical AI Market
- GCC Countries Physical AI Market
Need a Tailored Report?
Customize this report to your needs
Get 10% FREE Customization
Customize This Report
