
Asia Pacific Plastic Compounds Market (2024-2029)

The Asia Pacific Plastic Compounds Market was valued at $28477.2 Million in 2024 and projected to reach to $39297.8 Million by 2029, representing a compound annual growth rate of 6.7%. Asia Pacific's plastic compounds market is positioned for sustained growth through 2029, driven by accelerating industrialization across emerging economies and rising demand from automotive, packaging, and consumer goods sectors.


| Market Size in | USD 26.32 MN |
| Market Forecast in | |
| CAGR | |
| Forecast Period | |
| Units Considered | Value (USD MN) |
Asia Pacific Plastic Compounds Market Trends and Insights
- In 2024, Asia Pacific's plastic compounds market was valued at USD 28,477.2 million, driven by rapid industrialization, expanding automotive and packaging sectors, and growing consumer goods manufacturing across the region.
- Asia Pacific is expected to maintain robust growth momentum through 2029, with the market forecast to reach USD 39,297.8 million, reflecting a compound annual growth rate (CAGR) of 6.7%. The growth trajectory in Asia Pacific is underpinned by increasing investments in infrastructure, rising disposable incomes, and heightened demand for lightweight, durable materials in transportation and electronics.
- Asia Pacific's manufacturing capabilities and cost competitiveness position the region as a critical hub for plastic compound production and consumption.
- Between 2024 and 2029, Asia Pacific is anticipated to capture substantial market share gains, supported by technological advancements and regulatory shifts toward sustainable polymer solutions. Asia Pacific's strategic importance in the global supply chain, combined with emerging market opportunities in India, Vietnam, and Southeast Asia, reinforces the region's pivotal role in shaping industry trends and driving innovation in plastic compound formulations..
Key Market Statistics
- CAGR (2024-2029) 6.7% CAGR
- Market Size, 2024 ~USD 28477.2 Million
- Forecast, 2029 ~USD 39297.8 Million
- Geography Asia Pacific
Asia Pacific Plastic Compounds Market Overview
Market Dominance :
Asia Pacific commands the largest share of the global plastic compounds market, valued at USD 28,477.2 million in 2024, reflecting the region's critical role in worldwide plastic compound consumption and production.
Robust Growth Trajectory :
The region is projected to grow at a CAGR of 6.7% from 2024 to 2029, reaching USD 39,297.8 million, outpacing the global CAGR of 6.6% and demonstrating sustained market expansion.
Industrial Drivers :
Rapid industrialization, expanding automotive manufacturing, and booming packaging sectors across Asia Pacific are primary catalysts fueling demand for advanced plastic compounds in the region.
China's Market Leadership :
China leads Asia Pacific with a market size of USD 17,055.2 million, supported by massive manufacturing capacity, consumer goods production, and infrastructure development initiatives.
Asia Pacific Plastic Compounds Market Dynamics
- China, India, and Japan remain key growth engines, with increasing investments in manufacturing infrastructure and technological advancement.
- The region's competitive advantage in production costs and expanding middle-class consumer base continue to attract global manufacturers and investment. Looking ahead, Asia Pacific will benefit from growing adoption of high-performance plastic compounds in electric vehicles, sustainable packaging solutions, and advanced industrial applications.
- Government initiatives promoting manufacturing and infrastructure development, coupled with rising environmental awareness driving demand for specialty compounds, will sustain market momentum.
- The region's dominance is expected to strengthen further as companies relocate production facilities and expand operations to capitalize on regional growth opportunities..
Market Ecosystem
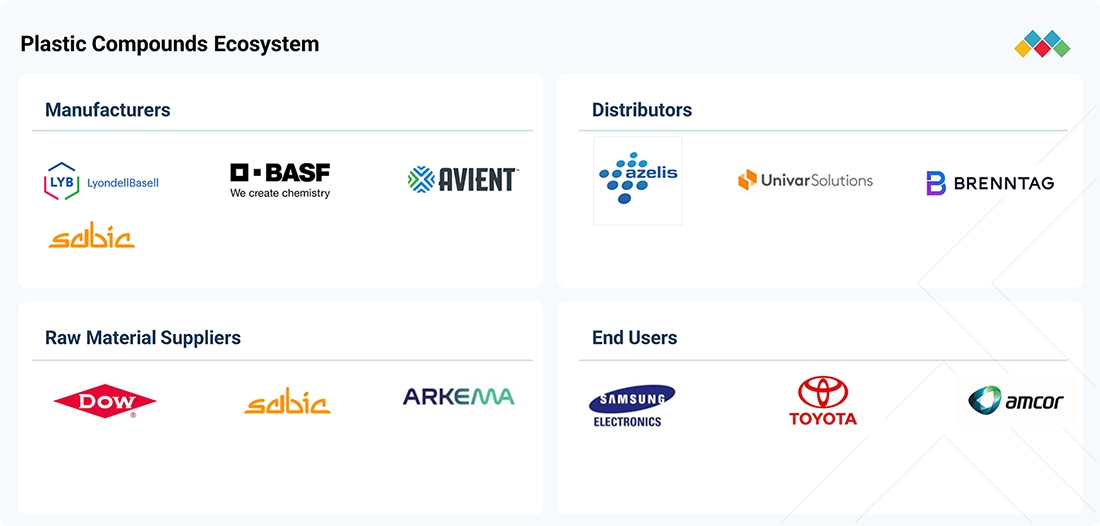
PLASTIC COMPOUNDS MARKET: COMMERCIAL USE CASES ACROSS INDUSTRIES
| COMPANY | USE CASE DESCRIPTION | BENEFITS |
|---|---|---|
 |
Provides engineering plastic compounds through portfolios such as Ultramid polyamide and Ultradur polybutylene terephthalate (PBT), used across automotive, electrical & electronics, consumer goods, construction, and industrial applications | High mechanical strength | Thermal stability | Dimensional stability | Electrical performance | Lightweighting |
 |
Provides polymer modification and compounding solutions, including specialty polymers, impact modifiers, and materials for polypropylene compounds, with applications across automotive, packaging, construction, electronics, and consumer products | Improved impact strength | Enhanced durability | Better processing | Lightweighting | Improved compatibility |
 |
Provides polyolefin resins and compounds based on polypropylene and polyethylene for injection molding, extrusion, films, packaging, automotive, electrical & electronics, consumer products, and building & construction applications | Improved stiffness | Impact resistance | Adhesion | Processability | Application-specific performance |
 |
Provides engineered thermoplastic compounds through its LNP portfolio, along with polypropylene compounds, PC/ABS, PBT, and other specialty materials for automotive, electrical & electronics, EV, and industrial applications | High thermal performance | Mechanical strength | Electrical performance | Lightweighting | Recycled and bio-based content options |
 |
Provides engineering plastics and polypropylene compounds, including LEONA polyamide, TENAC POM, XYRON modified PPE, and Thermylene polypropylene compounds for automotive, electrical & electronics, appliances, and industrial applications | Heat resistance | Strength and rigidity | Dimensional stability | Chemical resistance | Improved component durability |
Logos and trademarks shown above are the property of their respective owners. Their use here is for informational and illustrative purposes only.
Related Ecosystem
Resins And Polymers
- Polycarbonate
- Acrylonitrile Butadiene Styrene (ABS)
- Epoxy Resin
- Light Commercial Vehicles (LCVs)
- Polypropylene (PP)
- Basf se
- DOW CHEMICAL COMPANY
- Solvay sa
- Saudi arabia basic industries corporation (sabic)
- DuPont de Nemours, Inc.
Fibers And Composites
- Polyetheretherketone (PEEK)
- Polyphenylene Sulfide (PPS)
- Epoxy Resin
- Polycarbonate
- Polyester Resin
- Toray Industries, Inc.
- Teijin Limited
- Sgl carbon se
- Hexcel Corporation
- Solvay sa
Automotive Electronics And Electrical Equipment
- Battery Electric Vehicle (BEV)
- Light Commercial Vehicles (LCVs)
- Fuel Cell Electric Vehicle (FCEV)
- Sensors
- Hybrid Electric Vehicle (HEV)
- BOSCH LIMITED
- DENSO Corporation
- Continental ag
- Panasonic Holdings Corporation
- Texas Instruments Incorporated
Key Takeaways
- Asia Pacific's plastic compounds market is valued at USD 28,477.2 million in 2024 and is projected to grow to USD 39,297.8 million by 2029 at a 6.7% CAGR.
- Asia Pacific's growth is driven by rapid industrialization, expanding automotive and packaging sectors, and increasing demand for lightweight materials in transportation and electronics.
- Asia Pacific's manufacturing capabilities and cost competitiveness establish the region as a critical global hub for plastic compound production and consumption.
- Emerging markets in India, Vietnam, and Southeast Asia present significant growth opportunities for Asia Pacific's plastic compounds market through 2029.
Plastic Compounds Market Report Scope
| Report Metric | Details |
|---|---|
| Base Year | 2024 |
| Fastest Growing Segment | BIO-BASED (Source) |
| Forecast Period | 2024-2029 |
| Growth Rate | CAGR of 6.6% from 2024 to 2029 |
| Largest Segment | FOSSIL-BASED (Source) |
| Market Size Base Year (Billions) | ~USD 70.68 (2024) |
| Revenue Forecast (Billions) | ~USD 97.3 (2029) |
| Segments Covered | Product, Source, End-Use Industry |
Asia Pacific Plastic Compounds Market Report Segmentation
3 segment dimensions are covered across the global market.
By Product
- Acrylonitrile Butadiene Styrene
- Other Products
- Polyamide
- Polycarbonate
- Polyethylene
- Polyethylene Terephthalate
- Polypropylene
- Polystyrene
- Polyurethane
- Polyvinyl Chloride
By Source
- Bio-Based
- Fossil-Based
- Recycled
By End-Use Industry
- Automotive
- Building & Construction
- Consumer Goods
- Electrical & Electronics
- Medical
- Other Industries
- Packaging
- -Commercial
- -Commercial Vehicles
- -Industrial
- -Passenger Cars
- -Residential
Target Audience
- Plastic Compound Manufacturers : Manufacturers need Asia Pacific market data to identify expansion opportunities, assess competitive dynamics, and develop region-specific product portfolios aligned with automotive and packaging demand.
- Automotive & Packaging Companies : End-users in automotive and packaging sectors require market intelligence to secure reliable compound supply chains, negotiate pricing, and plan production capacity in Asia Pacific's fastest-growing markets.
- Investment & Private Equity Firms : Investors need comprehensive regional analysis to identify acquisition targets, evaluate market growth potential, and assess risk-return profiles for plastic compound businesses across Asia Pacific.
- Chemical Distributors & Traders : Distributors require country-level market sizing and growth forecasts to optimize inventory management, identify high-demand regions, and develop strategic partnerships with manufacturers.
- Strategic Consultants & Analysts : Consultants need detailed Asia Pacific market segmentation and outlook data to advise clients on market entry strategies, competitive positioning, and long-term business planning in the region.
Countries within Asia Pacific - compare and drill down
| Country | 2025 size (native) |
|---|---|
| China | USD 17055.2 Million |
| India | USD 5344.5 Million |
| Japan | USD 4008.4 Million |
| South Korea | USD 2633 Million |
| Malaysia | USD 1964.9 Million |
| Philippines | USD 1689.8 Million |
| Thailand | USD 1414.7 Million |
| Indonesia | USD 1336.1 Million |
| Australia | USD 1178.9 Million |
| Rest Of Asia Pacific | USD 2672.3 Million |
Country market size visualization
Reasons to Buy this Report
- Regional Market Dominance Insights : Gain comprehensive understanding of Asia Pacific's commanding 28.5% share of global plastic compounds market and identify growth opportunities across the world's largest consumption region.
- Country-Level Intelligence : Access detailed market data for China (USD 17.1B), India (USD 5.3B), Japan (USD 4.0B), and other key Asia Pacific nations to inform localized business strategies and investment decisions.
- Sector-Specific Growth Drivers : Understand how automotive expansion, packaging innovation, and consumer goods manufacturing are reshaping plastic compound demand across Asia Pacific's diverse industrial landscape.
- Competitive Positioning Strategy : Benchmark your operations against regional competitors and identify market gaps in high-growth segments like electric vehicles, sustainable packaging, and specialty compounds.
- Investment & Expansion Planning : Leverage 5-year forecast data (6.7% CAGR to USD 39.3B by 2029) to make informed decisions on facility location, capacity expansion, and market entry strategies in Asia Pacific.
Frequently asked questions
What is the current market size of plastic compounds in Asia Pacific?
Asia Pacific's plastic compounds market was valued at USD 28,477.2 million in 2024.
What is the projected market size for Asia Pacific plastic compounds by 2029?
Asia Pacific's plastic compounds market is forecast to reach USD 39,297.8 million by 2029.
What is the CAGR for Asia Pacific's plastic compounds market?
Asia Pacific's plastic compounds market is expected to grow at a compound annual growth rate (CAGR) of 6.7% from 2024 to 2029.
Which industries drive demand for plastic compounds in Asia Pacific?
Key industries driving Asia Pacific's plastic compounds demand include automotive, packaging, consumer goods, electronics, and transportation sectors.
Why is Asia Pacific significant in the global plastic compounds market?
Asia Pacific is significant due to its manufacturing capabilities, cost competitiveness, rapid industrialization, and emerging market opportunities that position it as a critical global hub for plastic compound production and consumption.
RESEARCH METHODOLOGY
The study involved four major activities to estimate the current size of the global plastic compounds market. Exhaustive secondary research was conducted to collect information on the market, the peer product market, and the parent product group market. The next step was to validate these findings, assumptions, and sizes with industry experts across the plastic compounds value chain through primary research. The top-down and bottom-up approaches were employed to estimate the overall size of the plastic compounds market. After that, market breakdown and data triangulation procedures were used to determine the size of different segments and sub-segments of the market.
Secondary Research
The market for companies offering plastic compounds was estimated using secondary data from paid and unpaid sources, analyzing the product portfolios of the major companies in the ecosystem, and rating the companies by their performance and quality. Secondary sources such as Business Standard, Bloomberg, World Bank, and Factiva were consulted to identify and collect information for this study on the plastic compounds market. These sources included annual reports, press releases, and investor presentations from door vendors, forums, certified publications, and whitepapers. The secondary research was used to obtain critical information on the industry’s value chain, the total pool of key players, market classification, and segmentation from both market and technology-oriented perspectives.
Primary Research
In the primary research process, various primary sources from both the supply and demand sides were interviewed to obtain qualitative and quantitative information for this report. The primary sources from the supply side included industry experts, such as Chief Executive Officers (CEOs), Vice Presidents (VPs), marketing directors, technology and innovation directors, and related key executives from several key companies and organizations operating in the Plastic compounds market. After the complete market engineering (calculations for market statistics, market breakdown, market size estimates, market forecasting, and data triangulation), extensive primary research was conducted to gather information and verify and validate the critical numbers arrived at. Primary research was also conducted to identify the segmentation types, industry trends, the competitive landscape of Plastic compounds offered by various market players, and key market dynamics, such as drivers, restraints, opportunities, challenges, and key player strategies. In the complete market engineering process, the top-down and bottom-up approaches and several data triangulation methods were extensively used to perform market estimation and market forecasting for the overall market segments and subsegments listed in this report. Extensive qualitative and quantitative analysis was performed throughout the complete market engineering process to list the key information/insights throughout the report.
Following is the breakdown of primary respondents:
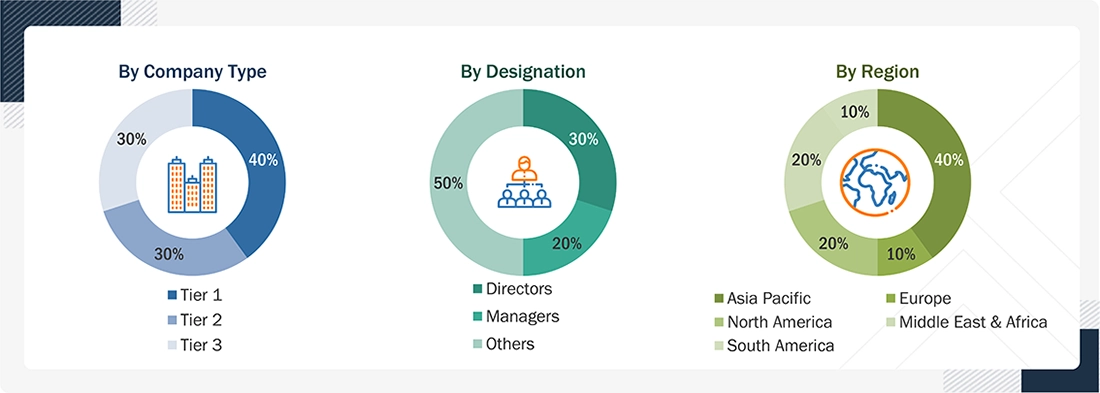
Notes: Other designations include sales, marketing, and product managers.
Tier 1: >USD 1 Billion; Tier 2: USD 500 million–1 Billion; and Tier 3: <USD 500 million.
To know about the assumptions considered for the study, download the pdf brochure
Market Size Estimation
The top-down and bottom-up approaches were used to estimate and validate the size of the global plastic compounds market. These approaches were also used extensively to estimate the size of various dependent market segments. The research methodology for estimating market size included the following:
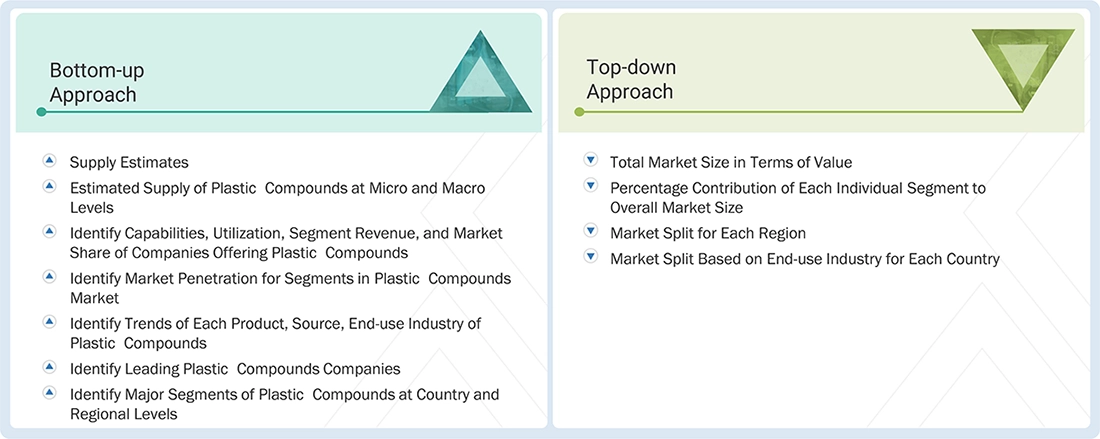
Data Triangulation
After determining the overall market size using market size estimation processes, the market was segmented into several segments and subsegments. Data triangulation and market breakup procedures were employed, wherever applicable, to complete the overall market engineering process and arrive at the exact statistics for each market segment and subsegment. The data was triangulated by analyzing various factors and trends from both the demand and supply sides.
Market Definition
Plastic compounds are formulated polymer materials created by combining base polymer resins with a variety of additives, fillers, reinforcement modifiers, pigments, and stabilizers to provide specific performance characteristics for various industrial and commercial uses. Functional properties of plastic compounds include improved mechanical, thermal, and chemical performance, impact resistance, dimensional stability, flame retardancy, durability, processability, and lightweight. Plastic compounds are classified by polymer composition into polyvinyl chloride (PVC), polypropylene (PP), polyethylene (PE), polystyrene (PS), polyamide (PA), polycarbonate (PC), polyethylene terephthalate (PET), polyurethane (PU), and acrylonitrile butadiene styrene (ABS). Based on raw material source, plastic compounds include fossil-based, bio-based, recycled, and so on. Different types of compounds have different formulations based on application requirements, available production facilities and manufacturing equipment, but they mainly depend on the optimized use of polymer composition, additive system, filler and reinforcement contents, and process conditions. The main application areas include automotive, packaging, electrical and electronics, building and construction, consumer goods, and medical, among others, driven by increasing demand for lightweight, durable, high-performance, and eco-friendly materials.
Key Stakeholders
- Plastic compound manufacturers
- Raw material and chemical suppliers
- Additive, filler, and reinforcement suppliers
- Distributors and plastic material suppliers
- End-use industries and industrial customers
- Regulatory bodies and industry associations
- Research and development (R&D) institutions
- Recyclers and recycled material suppliers
Report Objectives
- To define, describe, and forecast the size of the global plastic compounds market, based on product, source, end-use industry, and region in terms of value
- To provide detailed information on the significant drivers, restraints, opportunities, and challenges influencing the market
- To strategically analyze micro markets concerning individual growth trends, prospects, and their contribution to the market
- To assess the growth opportunities in the market for stakeholders and provide details on the competitive landscape for market leaders
- To forecast the market size of segments and subsegments for North America, Europe, Asia Pacific, South America, and the Middle East & Africa
- To strategically profile key players and comprehensively analyze their market shares and core competencies
- To analyze competitive developments such as product launches, acquisitions, expansions, partnerships, and agreements in the plastic compounds market
- To provide the impact of AI/Gen AI on the market
Available customizations:
With the given market data, MarketsandMarkets offers customizations according to client-specific needs.
The following customization options are available for the plastic compounds market report:
Product Analysis
- A product matrix that gives a detailed comparison of the product portfolio of each company
Regional Analysis
- A further breakdown of the plastic compounds market for additional countries
Company Information
- Detailed analysis and profiling of additional market players (up to five)
Get the Full Plastic Compounds Market Report
Full forecast, segment splits, and company analysis for all Plastic Compounds Market.
- Rest Of Asia Pacific Plastic Compounds Market
- GCC Countries Plastic Compounds Market
- -Rest Of GCC Plastic Compounds Market
- Rest Of South America Plastic Compounds Market
- US Plastic Compounds Market
- Canada Plastic Compounds Market
- Mexico Plastic Compounds Market
- Germany Plastic Compounds Market
- France Plastic Compounds Market
- UK Plastic Compounds Market
- Italy Plastic Compounds Market
- Spain Plastic Compounds Market
- China Plastic Compounds Market
- India Plastic Compounds Market
- Japan Plastic Compounds Market
- South Korea Plastic Compounds Market
- Malaysia Plastic Compounds Market
- Philippines Plastic Compounds Market
- Thailand Plastic Compounds Market
- Indonesia Plastic Compounds Market
- Australia Plastic Compounds Market
- South Africa Plastic Compounds Market
- Brazil Plastic Compounds Market
- Argentina Plastic Compounds Market
- Rest Of Europe Plastic Compounds Market
Need a Tailored Report?
Customize this report to your needs
Get 10% FREE Customization
Customize This Report
