
Asia Pacific Product Engineering Services Market (2025-2030)

The Asia Pacific Product Engineering Services Market was valued at $368270 Million in 2025 and projected to reach to $529330 Million by 2030, representing a compound annual growth rate of 7.5%. Asia Pacific's product engineering services market is poised for exceptional growth, driven by accelerating digital transformation across the region's diverse economies.


| Market Size in | USD 26.32 MN |
| Market Forecast in | |
| CAGR | |
| Forecast Period | |
| Units Considered | Value (USD MN) |
Asia Pacific Product Engineering Services Market Trends and Insights
- Asia Pacific's 7.5% compound annual growth rate outpaces global trends, driven by rapid digital transformation, increasing software complexity, and rising demand for specialized engineering talent across the region.
- Key markets including India, China, and Southeast Asia are attracting significant investment in R&D and engineering capabilities. Asia Pacific's dominance in global engineering services stems from its cost-competitive talent pools, established technology hubs, and growing domestic demand for innovation.
- Between 2025 and 2030, Asia Pacific is expected to capture an expanding share of worldwide product engineering work, supported by government initiatives promoting technology adoption and entrepreneurship.
- The region's manufacturing and software sectors are increasingly outsourcing engineering services to specialized providers, creating sustained market opportunities. Organizations across Asia Pacific are prioritizing digital-first product development, cloud-native architectures, and AI-integrated solutions, further accelerating demand for advanced engineering services.
- This trajectory positions Asia Pacific as a critical growth engine within the global Product Engineering Services Market through 2030..
Key Market Statistics
- CAGR (2025-2030) 7.5% CAGR
- Market Size, 2025 ~USD 368270 Million
- Forecast, 2030 ~USD 529330 Million
- Geography Asia Pacific
Asia Pacific Product Engineering Services Market Overview
Regional Growth Acceleration :
Asia Pacific's 7.5% CAGR significantly outpaces the global average of 6.768%, positioning the region as the fastest-growing hub for product engineering services driven by digital transformation initiatives across enterprises.
Market Valuation Expansion :
The Asia Pacific market is projected to grow from USD 368,270 million in 2025 to USD 529,330 million by 2030, representing a USD 161,060 million increase in market opportunity over the five-year forecast period.
China & India Dominance :
China leads with USD 212,320 million and Japan follows with USD 112,960 million, while India's USD 91,810 million market reflects the region's emergence as a critical engineering talent and services hub.
Digital Complexity Drivers :
Rising software complexity, cloud adoption, and specialized engineering talent demand across manufacturing, fintech, and e-commerce sectors are fueling sustained investment in product engineering services throughout Asia Pacific.
Asia Pacific Product Engineering Services Market Dynamics
- The region's competitive advantage in engineering talent, combined with increasing software complexity and cloud infrastructure adoption, creates substantial opportunities for service providers.
- Major markets including China, Japan, and India are investing heavily in R&D and product innovation, creating sustained demand for specialized engineering expertise. The forecast period through 2030 will witness intensified competition and consolidation as global and regional players expand their Asia Pacific footprints.
- Emerging technologies including AI, IoT, and blockchain integration will drive demand for advanced engineering capabilities.
- Companies leveraging nearshoring advantages and establishing regional innovation centers will capture significant market share in this high-growth geography..
Market Ecosystem
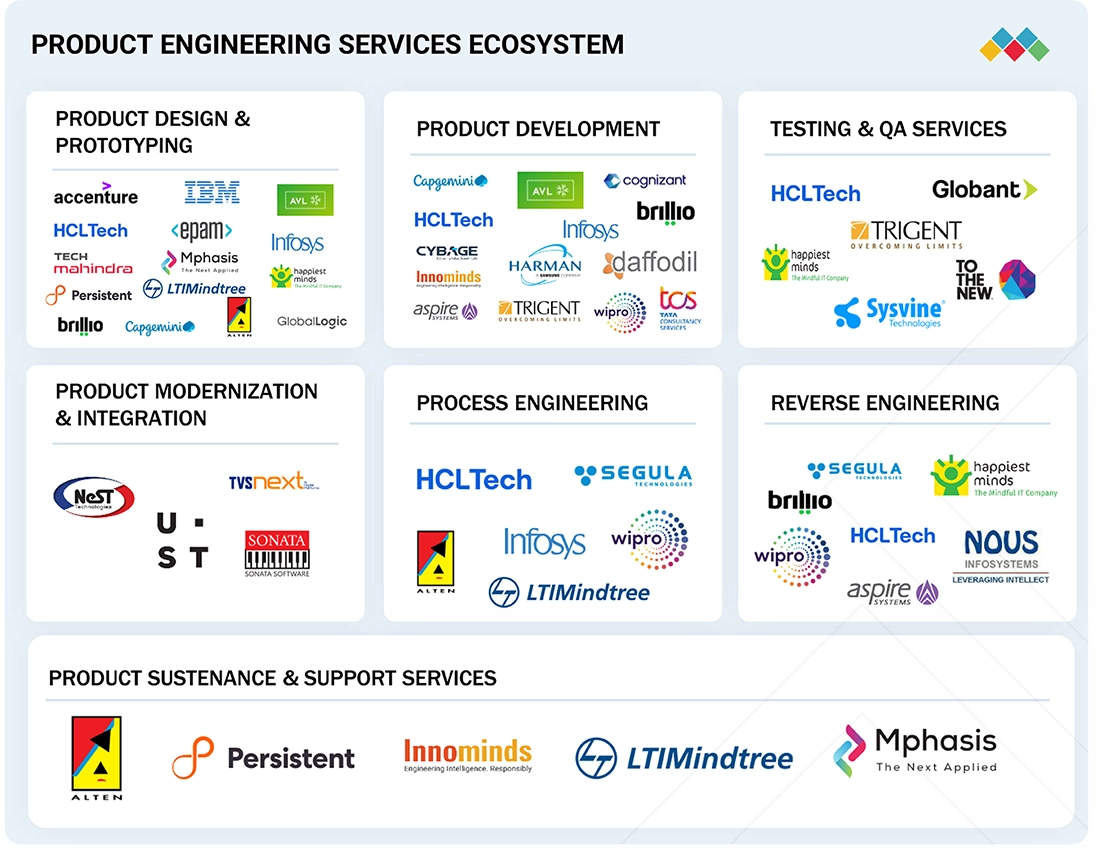
Product Engineering Services Market: COMMERCIAL USE CASES ACROSS INDUSTRIES
| COMPANY | USE CASE DESCRIPTION | BENEFITS |
|---|---|---|
 |
Infosys: Silicon and Platform Engineering for V2X SoC – Automotive Semiconductor Provider | Enabled next-generation V2X communication systems with full ISO 26262 functional safety compliance, supporting software-defined vehicle architectures and real-time connectivity. Leveraged early-stage prototyping and IP-led engineering to reduce development risk and accelerate innovation. |
|
|
Infosys: SoC Physical Design Implementation in TSMC 5nm – American Fabless Semiconductor Firm | Delivered high-frequency SoC performance with integrated analog IP blocks, optimized power delivery through EM/IR analysis, and accelerated design closure using advanced planning and simulation. |
 |
Tata Technologies: High-Performance Data Architecture for Global Engineering Operations | Migrated over 53 TB of engineering data from legacy systems, enabling real-time access for 2,500+ users. Established a low-latency, disaster-resilient digital backbone to support global collaboration, engineering continuity, and data-driven decision-making. |
 |
IBM: Driving Digital Transformation for Snack Empire | Enabled real-time supply chain visibility and faster product delivery through data integration and automation. Enhanced customer engagement via unified CRM insights on Salesforce, and accelerated innovation using IBM Garage’s agile co-creation framework. |
Logos and trademarks shown above are the property of their respective owners. Their use here is for informational and illustrative purposes only.
Related Ecosystem
Software And Services
- Natural Language Processing (NLP)
- Machine Learning
- Supply Chain Management
- Predictive Analytics
- Image Sensors
- International Business Machines Corporation
- MICROSOFT CORPORATION
- Oracle Corporation
- SAP SE
- Amazon.com, Inc.
Key Takeaways
- Asia Pacific's Product Engineering Services Market will grow from USD 368.3B (2025) to USD 529.3B (2030) at a 7.5% CAGR, outpacing global growth rates.
- Asia Pacific's competitive talent ecosystem and cost advantages position the region as the preferred destination for global product engineering outsourcing.
- Digital transformation initiatives and AI adoption across Asia Pacific industries are driving sustained demand for specialized engineering services through 2030.
- India, China, and Southeast Asia are emerging as primary growth hubs, supported by government technology policies and expanding domestic innovation ecosystems.
Product Engineering Services Market Report Scope
| Report Metric | Details |
|---|---|
| Base Year | 2025 |
| Fastest Growing Segment | SMES (End User) |
| Forecast Period | 2025-2030 |
| Growth Rate | CAGR of 6.768% from 2025 to 2030 |
| Largest Segment | LARGE ENTERPRISES (Organization Size) |
| Market Size Base Year (Billions) | ~USD 1297.7 (2025) |
| Revenue Forecast (Billions) | ~USD 1800.45 (2030) |
| Segments Covered | Service Type, Delivery Mode, Organization Size, Vertical, Offering, Software Type, End User |
Asia Pacific Product Engineering Services Market Report Segmentation
7 segment dimensions are covered across the global market.
By Service Type
- Analytics Services
- Cloud Engineering
- Experience Engineering
- Maintenance Services
- Process Engineering
- Product Design & Prototyping
- Product Development
- Product Engineering
- Product Modernization & Integration
- Product Sustenance & Support
- Reverse Engineering
- Security Engineering
- Testing & Quality Assurance
- Testing & Quality Assurance (Qa)
By Delivery Mode
- Hybrid
- Nearshore
- Offshore
- Onshore
By Organization Size
- Large Enterprises
- Small Enterprises
- Smes
By Vertical
- Aerospace & Defense
- Automotive & Transportation
- Bfsi
- Energy & Utilities
- Healthcare & Life Sciences
- Industrial Manufacturing
- It & Telecom
- Other Verticals
- Retail & Consumer Goods
- Retail & E-Commerce
- Semiconductor & Electronics
By Offering
- Professional Services
- Software
By Software Type
- Cad Simulation Software
- Cfd
- Electromagnetic Simulation Software
- Electronic Simulation Software
- Fea
- Gaming, Ar, Vr, And Training Simulation Software
- Healthcare & Epidemiological Simulation Software
- Manufacturing Simulation Software
- Other Software Types
- Physics & Multiphysics Simulation Software
- Process Simulation Software
By End User
- Large Enterprises
- Smes
Target Audience
- Engineering Services Providers : Service companies need Asia Pacific market data to identify growth opportunities, benchmark competitive positioning, and develop region-specific strategies for capturing share in the 7.5% CAGR expansion.
- Technology & Software Companies : Product firms require insights into Asia Pacific engineering talent availability, outsourcing trends, and regional demand patterns to optimize product development strategies and cost structures.
- Investment & Private Equity Firms : Investors evaluating Asia Pacific technology services opportunities need market sizing, growth forecasts, and competitive dynamics to assess portfolio companies and identify acquisition targets in high-growth segments.
- Enterprise Technology Leaders : CIOs and technology executives in Asia Pacific need market intelligence to evaluate engineering service providers, benchmark regional capabilities, and make informed outsourcing and partnership decisions.
- Management Consultants & Analysts : Consulting firms and research analysts require comprehensive Asia Pacific market data to support client advisory work, competitive analysis, and strategic recommendations in the engineering services sector.
Countries within Asia Pacific - compare and drill down
| Country | 2025 size (native) |
|---|---|
| China | USD 212320 Million |
| Japan | USD 112960 Million |
| India | USD 91810 Million |
| Rest Of Asia Pacific | USD 112250 Million |
Country market size visualization
Reasons to Buy this Report
- Regional Market Sizing & Forecasts : Obtain precise market valuations for Asia Pacific and individual country-level data (China, Japan, India, Rest of Asia Pacific) with detailed 2025-2030 projections to inform expansion and investment strategies.
- Competitive Landscape Intelligence : Understand market dynamics, key player positioning, and competitive strategies specific to Asia Pacific's high-growth engineering services ecosystem to identify partnership and acquisition opportunities.
- Growth Driver Analysis : Gain insights into region-specific growth catalysts including digital transformation initiatives, talent availability, cost advantages, and technology adoption patterns driving 7.5% CAGR across Asia Pacific.
- Country-Level Market Segmentation : Access granular market data across major Asia Pacific economies to identify high-potential markets, assess localization requirements, and prioritize resource allocation for market entry or expansion.
- Strategic Decision Support : Leverage comprehensive Asia Pacific market intelligence to support go-to-market strategies, pricing models, service offerings, and investment decisions in the region's fastest-growing engineering services markets.
Frequently asked questions
What is the projected market size for Product Engineering Services in Asia Pacific by 2030?
Asia Pacific's Product Engineering Services Market is projected to reach USD 529,330 million by 2030, up from USD 368,270 million in 2025.
What is the CAGR for Asia Pacific's Product Engineering Services Market?
Asia Pacific's Product Engineering Services Market is expected to grow at a compound annual growth rate of 7.5% between 2025 and 2030.
Which countries are driving growth in Asia Pacific's Product Engineering Services Market?
India, China, and Southeast Asian nations are primary growth drivers in Asia Pacific, supported by established tech hubs, talent availability, and government innovation initiatives.
What factors are accelerating demand for engineering services in Asia Pacific?
Digital transformation, cloud adoption, AI integration, software complexity, and increased R&D investment across manufacturing and software sectors are key demand drivers in Asia Pacific.
How does Asia Pacific's growth compare to global Product Engineering Services Market trends?
Asia Pacific's 7.5% CAGR exceeds the global market CAGR of 6.768%, reflecting the region's strategic importance and accelerating technology adoption.
RESEARCH METHODOLOGY
This research study on the product engineering services market involved extensive secondary sources, directories, IEEE Communication-Efficient: Algorithms and Systems, International Journal of Innovation and Technology Management, and paid databases. Primary sources were mainly industry experts from the core and related industries, preferred product engineering service providers, third-party service providers, consulting service providers, end users, and other commercial enterprises. In-depth interviews with primary respondents, including key industry participants and subject matter experts, were conducted to obtain and verify critical qualitative and quantitative information and assess the market’s prospects.
Secondary Research
In the secondary research process, various sources were referred to identify and collect information for this study. These included annual reports, press releases, and investor presentations of companies; white papers, journals, and certified publications; and articles from recognized authors, directories, and databases. The data was also collected from other secondary sources, such as journals, government websites, blogs, and vendors’ websites. Additionally, spending on various countries’ product engineering services was extracted from the respective sources.
Primary Research
In the primary research process, various sources from the supply and demand sides were interviewed to obtain qualitative and quantitative information on the market. The supply side sources included various industry experts, such as Chief Experience Officers (CXOs), Vice Presidents (VPs), and Directors specializing in business development, marketing, and product engineering service providers. It also included key executives from product engineering services vendors, system integrators (SIs), professional service providers, industry associations, and other key opinion leaders.
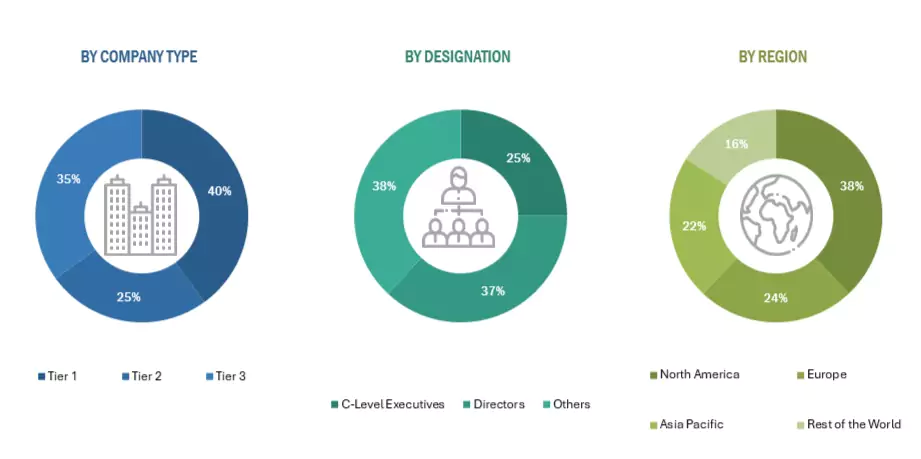
Note 1: Others include sales managers, marketing managers, and product managers.
Note 2: Tier 1 companies’ revenues are more than USD 10 billion; tier 2 companies’ revenues range between USD 1 and 10 billion; and tier 3 companies’ revenues range between USD 500 million and USD 1 billion.
Source: Industry Experts
To know about the assumptions considered for the study, download the pdf brochure
Market Size Estimation
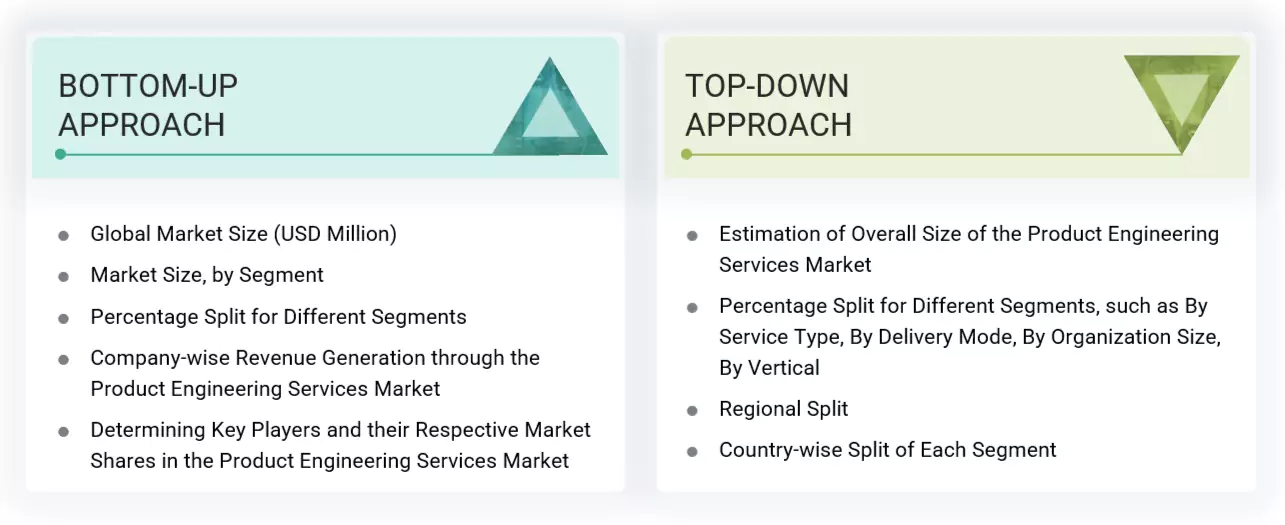
Multiple approaches were adopted to estimate and forecast the product engineering services market. The first approach involved estimating the market size by companies’ revenue generated through the sale of product engineering services.
The top-down approach prepared an exhaustive list of all the vendors offering products in the product engineering services market. The revenue contribution of the market vendors was estimated through annual reports, press releases, funding, investor presentations, paid databases, and primary interviews. Each vendor’s offerings were evaluated based on platform, degree of customization, type, application, end user, and region. The markets were triangulated through primary and secondary research. The primary procedure included extensive interviews for key insights from industry leaders, such as CIOs, CEOs, VPs, directors, and marketing executives. The market numbers were further triangulated with the existing MarketsandMarkets repository for validation.
Market Size Estimation Methodology-Bottom-up approach
The bottom-up approach identified the adoption rate of product engineering services among different verticals in key countries, focusing on the regions contributing the largest market share. The adoption of product engineering services among enterprises and other regional use cases was identified and extrapolated for cross-validation. Use cases identified in different areas were weighted for the market size calculation.
The regional split was determined by primary and secondary sources based on the market numbers. The procedure included an analysis of the product engineering services market’s regional penetration. Based on secondary research, the regional spending on Information and Communications Technology (ICT), socioeconomic analysis of each country, strategic vendor analysis of major product engineering service providers, and organic and inorganic business development activities of regional and global players were estimated.
Product Engineering Services Market : Top-Down and Bottom-Up Approach
Data Triangulation
After determining the overall market size using the market size estimation processes explained above, the market was split into several segments and subsegments. Where applicable, data triangulation and market breakup procedures were employed to complete the overall market engineering process and determine each market segment’s and subsegment’s exact statistics. The overall market size was used in the top-down procedure to estimate the size of other individual markets via percentage splits of the market segmentation.
Market Definition
The product engineering services (PES) encompasses outsourced services provided by third-party vendors to support software or hardware product design, development, testing, and deployment. These services span the entire product lifecycle, from ideation and prototyping to product maintenance and modernization. PES providers help organizations accelerate innovation, reduce time-to-market, optimize costs, and ensure high product quality. This market caters to automotive, healthcare, telecom, and consumer electronics industries, driven by the growing need for digital transformation, innovative product development, and emerging technologies such as AI, IoT, and cloud. PES typically includes embedded systems, software engineering, and mechanical design.
Stakeholders
- Product Engineering Service Providers
- Product Engineering Outsourcing Service Providers
- Consultants/Consultancies/Advisory Firms
- Governments and Standardization Bodies
- Independent Software Vendors
- Information Technology (IT) Infrastructure Providers
- Regional Associations
- Resellers and Distributors
- Support and Maintenance Service Providers
- System Integrators (SIs)
- Third-party Providers
- Value-added Resellers and Distributors
Report Objectives
- To describe and forecast the global product engineering services market based on service type, organization size, vertical, and region
- To forecast the market size of regional segments: North America, Europe, Asia Pacific, the Middle East, Africa, and Latin America
- To strategically analyze the market’s subsegments concerning individual growth trends, prospects, and contributions to the total market
- To provide detailed information related to the significant factors influencing the market growth (drivers, restraints, opportunities, and challenges)
- To analyze industry trends, patents and innovations, and pricing data related to the market
- To analyze the opportunities in the market for stakeholders and provide details of the competitive landscape for major players
- To analyze the impact of AI/GenAI on the global product engineering service market
- To profile key players in the market and comprehensively analyze their market share/ranking and core competencies
- To track and analyze competitive developments, such as mergers & acquisitions, product developments, and partnerships & collaborations in the market
Available Customizations
With the given market data, MarketsandMarkets offers customizations to meet the company’s needs. The following customization options are available for the report:
Product Analysis
- The product matrix provides a detailed comparison of each company’s portfolio.
Geographic Analysis as per Feasibility
- Further breakup of the North American product engineering services market
- Further breakup of the European product engineering services market
- Further breakup of the Asia Pacific product engineering services market
- Further breakup of the Middle East & Africa product engineering services market
- Further breakup of the Latin American product engineering services market
Company Information
- Detailed analysis and profiling of additional market players (up to five)
Get the Full Product Engineering Services Market Report
Full forecast, segment splits, and company analysis for all Product Engineering Services Market.
- Canada Product Engineering Services Market
- US Product Engineering Services Market
- UK Product Engineering Services Market
- Germany Product Engineering Services Market
- France Product Engineering Services Market
- Italy Product Engineering Services Market
- China Product Engineering Services Market
- Japan Product Engineering Services Market
- India Product Engineering Services Market
- UAE Product Engineering Services Market
- Saudi Arabia Product Engineering Services Market
- South Africa Product Engineering Services Market
- Brazil Product Engineering Services Market
- Mexico Product Engineering Services Market
- Rest Of Europe Product Engineering Services Market
- Rest Of Asia Pacific Product Engineering Services Market
- Rest Of Latin America Product Engineering Services Market
- GCC Product Engineering Services Market
- Rest Of GCC Product Engineering Services Market
Need a Tailored Report?
Customize this report to your needs
Get 10% FREE Customization
Customize This Report
