
Asia Pacific Refractories Market (2024-2029)

The Asia Pacific Refractories Market was valued at $20804.8 Million in 2024 and projected to reach to $26243 Million by 2029, representing a compound annual growth rate of 4.75%. The Asia Pacific refractories market is poised for sustained growth, driven by accelerating industrialization in China, India, and Southeast Asia.


| Market Size in | USD 26.32 MN |
| Market Forecast in | |
| CAGR | |
| Forecast Period | |
| Units Considered | Value (USD MN) |
Asia Pacific Refractories Market Trends and Insights
- Asia Pacific dominates the global refractories landscape, driven by robust industrial expansion across steel, cement, and glass manufacturing sectors.
- The region's rapid urbanization and infrastructure development continue to fuel demand for high-performance refractory materials essential for high-temperature industrial processes. Asia Pacific's growth trajectory reflects strong economic activity in key markets including China, India, and Southeast Asia, where heavy industries remain central to economic development.
- The region's refractories market benefits from increasing investments in manufacturing capacity and technological upgrades across foundries, petrochemical plants, and thermal power generation facilities.
- Between 2024 and 2029, Asia Pacific is expected to maintain its position as the largest regional market, supported by sustained demand from emerging economies and ongoing industrialization trends..
Key Market Statistics
- CAGR (2024-2029) 4.75% CAGR
- Market Size, 2024 ~USD 20804.8 Million
- Forecast, 2029 ~USD 26243 Million
- Geography Asia Pacific
Asia Pacific Refractories Market Overview
Market Dominance :
Asia Pacific commands over 45% of the global refractories market, with China alone accounting for USD 17,904.1 million, establishing the region as the world's largest refractory materials hub.
Steel & Cement Driven Growth :
Rapid expansion in steel production, cement manufacturing, and glass industries across China, India, and Japan fuels consistent demand for high-performance refractory materials in Asia Pacific.
Infrastructure Momentum :
Sustained urbanization, industrial modernization, and mega-infrastructure projects across emerging economies in Asia Pacific create sustained demand for refractories in construction and heavy industries.
Regional CAGR Leadership :
Asia Pacific's 4.75% CAGR outpaces the global average of 4.4%, reflecting stronger industrial growth trajectories and capacity expansions in the region through 2029.
Asia Pacific Refractories Market Dynamics
- Steel production capacity expansions, coupled with rising cement and glass manufacturing output, will continue to anchor demand for advanced refractory solutions.
- The region's focus on energy efficiency and high-temperature processing technologies will drive adoption of premium refractory products.
- By 2029, the market is expected to reach USD 26,243 million, reflecting robust industrial fundamentals and infrastructure investments across the region..
Market Ecosystem
Related Ecosystem
Ceramics And Glass
- Zirconia
- Alumina Ceramics
- Silicon Carbide
- Silicon Nitride
- Titanate Ceramics
- Saint-gobain
- 3M COMPANY
- Kyocera Corporation
- CERAMTEC GMBH
- COORSTEK INCORPORATED
Energy Circularity
- Epoxy Resin
- Progressive Cavity Pumps
- Amphoteric
- Bisphenol-A
- Cartridge Filters
- TotalEnergies SE
- ENEOS Holdings, Inc.
- Hess Corporation
- Baker Hughes Company
- Weatherford International plc
Key Takeaways
- Asia Pacific refractories market will grow from USD 20.8B (2024) to USD 26.2B (2029) at 4.75% CAGR
- Asia Pacific accounts for the largest share of global refractories demand driven by steel and cement industries
- Emerging economies in Asia Pacific are investing heavily in industrial infrastructure and manufacturing capacity expansion
- Asia Pacific's market growth is supported by technological advancements and increasing adoption of specialized refractory materials
Refractories Market Report Scope
| Report Metric | Details |
|---|---|
| Base Year | 2024 |
| Fastest Growing Segment | ACIDIC & NEUTRAL (Alkalinity) |
| Forecast Period | 2024-2029 |
| Growth Rate | CAGR of 4.4% from 2024 to 2029 |
| Largest Segment | STEEL (Type) |
| Market Size Base Year (Billions) | ~USD 34.19 (2024) |
| Revenue Forecast (Billions) | ~USD 42.4 (2029) |
| Segments Covered | Form, Alkalinity, End-Use Industry, Type |
Asia Pacific Refractories Market Report Segmentation
4 segment dimensions are covered across the global market.
By Form
- Shaped Refractories
- Unshaped Refractories
By Alkalinity
- Acidic & Neutral
- Basic
By End-Use Industry
- Automotive & Transportation
- Building & Construction
- Cement
- Consumer Goods
- Glass
- Heavy Industry
- Iron & Steel
- Non-Ferrous Metal
- Other End-Use Industries
- Power Generation
By Type
- Iron
- Steel
Target Audience
- Refractory Manufacturers & Suppliers : Optimize production capacity, pricing strategies, and distribution networks across Asia Pacific's dominant markets to capture growth in steel, cement, and glass sectors.
- Steel & Cement Producers : Benchmark refractory material costs, identify supplier alternatives, and plan capital investments in high-performance refractories for capacity expansions across the region.
- Industrial Equipment OEMs : Understand refractory material specifications and demand trends to design compatible high-temperature processing equipment for Asia Pacific's growing industrial base.
- Private Equity & Investment Firms : Evaluate M&A and investment opportunities in Asia Pacific's refractories sector, leveraging market sizing and growth forecasts for portfolio companies and strategic acquisitions.
- Government & Trade Organizations : Develop industrial policy, trade strategies, and infrastructure investment plans informed by Asia Pacific refractories market dynamics and regional competitive positioning.
Countries within Asia Pacific - compare and drill down
| Country | 2025 size (native) |
|---|---|
| China | USD 17904.1 Million |
| Japan | USD 2585.9 Million |
| India | USD 2293.7 Million |
| South Korea | USD 1473.7 Million |
| Australia | USD 349.8 Million |
| Rest Of Asia Pacific | USD 1636 Million |
Country market size visualization
Reasons to Buy this Report
- Regional Market Dominance Insights : Understand why Asia Pacific controls 45%+ of global refractories demand and identify growth opportunities across China, India, Japan, and South Korea's industrial ecosystems.
- Country-Level Competitive Intelligence : Access granular market sizing for China (USD 17.9B), India (USD 2.3B), and Japan (USD 2.6B) to benchmark competitive positioning and identify high-growth sub-markets.
- Sector-Specific Growth Drivers : Leverage detailed analysis of steel, cement, and glass manufacturing trends driving refractory demand across Asia Pacific's fastest-growing industrial hubs.
- Strategic Expansion Planning : Develop market entry and capacity expansion strategies with 5-year forecasts (2024-2029) tailored to Asia Pacific's 4.75% CAGR and regional growth dynamics.
- Supply Chain & Investment Opportunities : Identify emerging markets, supplier partnerships, and investment hotspots in Asia Pacific's refractories value chain amid rapid industrialization and infrastructure development.
Frequently asked questions
What is the current market size of refractories in Asia Pacific?
The Asia Pacific refractories market is valued at USD 20,804.8 million in 2024.
What is the projected market size for Asia Pacific refractories by 2029?
The Asia Pacific refractories market is projected to reach USD 26,243.0 million by 2029.
What is the CAGR for Asia Pacific refractories market?
The Asia Pacific refractories market is expected to grow at a CAGR of 4.75% from 2024 to 2029.
Which industries drive demand for refractories in Asia Pacific?
Steel manufacturing, cement production, glass manufacturing, petrochemical processing, and thermal power generation are the primary drivers of refractory demand in Asia Pacific.
Why is Asia Pacific the largest refractories market globally?
Asia Pacific leads globally due to its concentration of heavy industries, rapid industrialization, large manufacturing base, and significant infrastructure development investments across emerging economies.
RESEARCH METHODOLOGY
The study involved four major activities for estimating the current global size of the refractories market. Exhaustive secondary research was conducted to gather information on the market, the peer market, and the parent market. The next step was to validate these findings, assumptions, and sizes with the industry experts across the value chain of refractories through primary research. Both the top-down and bottom-up approaches were employed to estimate the overall size of the refractories market. After that, market breakdown and data triangulation procedures were used to determine the size of different segments and sub-segments of the market.
Secondary Research
In the secondary research process, various secondary sources such as Hoovers, Factiva, Bloomberg BusinessWeek, and Dun & Bradstreet were referred to, to identify and collect information for this study on the refractories market. These secondary sources included annual reports, press releases & investor presentations of companies, white papers, certified publications, articles by recognized authors, regulatory bodies, trade directories, and databases.
Primary Research
Various primary sources from both the supply and demand sides of the refractories market were interviewed to obtain qualitative and quantitative information. The primary sources from the supply side included industry experts, such as Chief Executive Officers (CEOs), vice presidents, marketing directors, sales professionals, and related key executives from various leading companies and organizations operating in the refractories industry. The breakdown of the profiles of primary respondents is as follows:
Breakdown of Primary Interviews
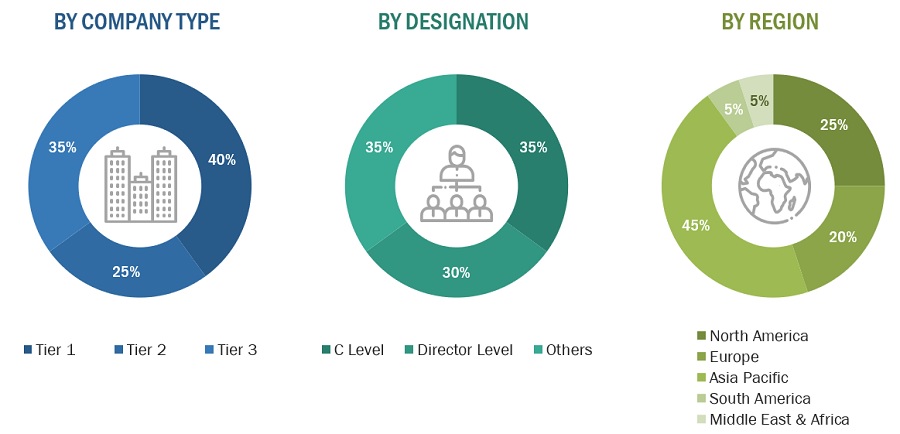
Notes: Companies are classified based on their revenue–Tier 1 = >USD 7 billion, Tier 2 = USD 500 million to USD 7 billion, and Tier 3 = <USD 500 million.
Others include sales, marketing, and product managers.
To know about the assumptions considered for the study, download the pdf brochure
Market Size Estimation
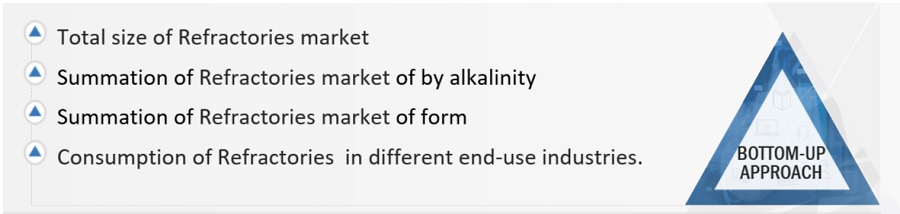
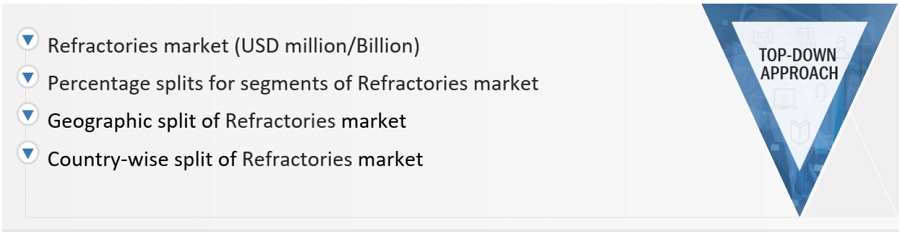
Both the top-down and bottom-up approaches were used to estimate and validate the global size of the refractories market. These approaches were also used extensively to estimate the size of various dependent segments of the market. The research methodology used to estimate the market size included the following details:
- The key players were identified through extensive secondary research.
- The industry’s supply chain and market size, in terms of value, were determined through primary and secondary research processes.
- All percentage shares, split, and breakdowns were determined using secondary sources and verified through primary sources.
- All possible parameters that affect the markets covered in this research study were accounted for, viewed in extensive detail, verified through primary research, and analysed to obtain the final quantitative and qualitative data.
- The research includes the study of reports, reviews, and newsletters of key industry players, along with extensive interviews with key officials, such as directors and marketing executives.
To know about the assumptions considered for the study, Request for Free Sample Report
Data Triangulation
After arriving at the overall market size from the estimation process explained above, the total market was split into several segments and sub-segments. The data triangulation and market breakdown procedures were employed, wherever applicable, to complete the overall market engineering process and arrive at the exact statistics for all segments and sub-segments of the refractories market. The data was triangulated by studying various factors and trends from both the demand- and supply-side.
In addition, the market size was validated by using both the top-down and bottom-up approaches. Then, it was verified through primary interviews. Hence, for every data segment, there are three sources—top-down approach, bottom-up approach, and expert interviews. The data were assumed to be correct when the values arrived at from the three sources matched.
Market Definition
The refractories market refers to the economic domain encompassing the production, distribution, and consumption of specialized materials designed to withstand extremely high temperatures and harsh operating conditions in industrial processes. These materials, known as refractories, are essential components in industries such as steelmaking, glass production, cement manufacturing, and chemical processing. The market involves manufacturers producing refractory products, end-users purchasing these materials for their industrial operations, distributors facilitating the supply chain, and maintenance services ensuring the longevity and efficiency of refractory linings in industrial equipment.
Key Stakeholders
- Raw material suppliers
- Refractories manufacturers
- Government & regulatory bodies
- Research organizations
- Associations and industry bodies
- End use industries
- Traders and distributors
Research Objectives
- To estimate and forecast the refractories market, in terms of value and volume
- To provide detailed information about the major factors (drivers, restraints, opportunities, and challenges) influencing the market growth
- To define, describe, and forecast the market size, based on form, alkalinity, end-use industry, and region
- To forecast the market size along with segments and submarkets, in key regions: North America, Europe, Asia Pacific (APAC), Middle East & Africa (MEA), and South America along with their key countries
- To strategically analyze micro markets, with respect to individual growth trends, prospects, and their contribution to the total market
- To analyze growth opportunities in the market for stakeholders and provide details on the competitive landscape for market leaders
- To strategically profile key players and comprehensively analyze their market shares and core competencies
- To analyze competitive developments, such as merger & acquisition, expansion & investment, and agreements in the refractories market
Available Customizations
With the given market data, MarketsandMarkets offers customizations according to client-specific needs.
The following customization options are available for the refractories report:
Product Analysis
- Product matrix, which offers a detailed comparison of the product portfolio of companies
Regional Analysis
- Further analysis of the refractories market for additional countries
Company Information
- Detailed analysis and profiling of additional market players (up to five)
Get the Full Refractories Market Report
Full forecast, segment splits, and company analysis for all Refractories Market.
- China Refractories Market
- Japan Refractories Market
- India Refractories Market
- South Korea Refractories Market
- Australia Refractories Market
- Germany Refractories Market
- UK Refractories Market
- France Refractories Market
- Spain Refractories Market
- Italy Refractories Market
- Russia Refractories Market
- US Refractories Market
- Canada Refractories Market
- Mexico Refractories Market
- Brazil Refractories Market
- Argentina Refractories Market
- Turkey Refractories Market
- South Africa Refractories Market
- Rest Of Europe Refractories Market
- Rest Of Asia Pacific Refractories Market
- GCC Countries Refractories Market
- -Rest Of GCC Refractories Market
- Rest Of South America Refractories Market
Need a Tailored Report?
Customize this report to your needs
Get 10% FREE Customization
Customize This Report
