
Asia Pacific Smart Infrastructure Market (2024-2029)

The Asia Pacific Smart Infrastructure Market was valued at $280520 Million in 2024 and projected to reach to $766830 Million by 2029, representing a compound annual growth rate of 22.3%. Asia Pacific is positioned as the fastest-growing region for smart infrastructure, driven by massive urbanization waves and government-backed digital transformation initiatives.


| Market Size in | USD 26.32 MN |
| Market Forecast in | |
| CAGR | |
| Forecast Period | |
| Units Considered | Value (USD MN) |
Asia Pacific Smart Infrastructure Market Trends and Insights
- The region's rapid urbanization, digital transformation initiatives, and government investments in IoT and 5G infrastructure are driving accelerated adoption of smart city solutions across Asia Pacific.
- Asia Pacific's 22.3% compound annual growth rate significantly outpaces the global average, reflecting strong demand from emerging economies and established tech hubs seeking to modernize their infrastructure ecosystems. Asia Pacific's smart infrastructure expansion is fueled by increasing investments in connected transportation, energy management, and public safety systems.
- Countries across Asia Pacific are prioritizing smart grid deployments and intelligent building technologies to address sustainability challenges and improve operational efficiency.
- The region's competitive advantage in semiconductor manufacturing and software development positions Asia Pacific as both a market leader and innovation hub for smart infrastructure solutions through 2029..
Key Market Statistics
- CAGR (2024-2029) 22.3% CAGR
- Market Size, 2024 ~USD 280520 Million
- Forecast, 2029 ~USD 766830 Million
- Geography Asia Pacific
Asia Pacific Smart Infrastructure Market Overview
Rapid Urbanization Driving Adoption :
Asia Pacific's accelerating urbanization is creating unprecedented demand for smart infrastructure solutions. Cities across China, India, and Southeast Asia are implementing IoT-enabled systems for traffic management, energy efficiency, and public safety, positioning the region as a global leader in smart city deployments.
Government Investment in 5G & IoT :
Substantial government initiatives across Asia Pacific are fueling smart infrastructure growth. National 5G rollout programs, digital transformation agendas, and smart city frameworks in countries like China, Japan, and India are creating favorable conditions for market expansion and technology adoption.
Highest Regional CAGR at 22.3% :
Asia Pacific's 22.3% CAGR significantly outpaces the global average of 18%, reflecting the region's exceptional growth trajectory. This accelerated expansion is driven by increasing digital infrastructure investments, rising IoT adoption, and growing demand for connected city solutions.
Market Expansion from $280.52B to $766.83B :
The Asia Pacific smart infrastructure market is projected to nearly triple from $280.52 billion in 2024 to $766.83 billion by 2029. This substantial growth underscores the region's critical importance as a primary growth engine for the global smart infrastructure sector.
Asia Pacific Smart Infrastructure Market Dynamics
- Countries including China, India, and Japan are investing heavily in 5G networks, IoT platforms, and smart city ecosystems, creating a robust foundation for market expansion.
- The region's young, tech-savvy population and increasing smartphone penetration further accelerate adoption rates. The forecast period through 2029 will witness intensified competition among technology providers and increased consolidation as enterprises vie for market share.
- Public-private partnerships will emerge as a key growth driver, enabling faster deployment of smart infrastructure solutions.
- Rising cybersecurity concerns and data privacy regulations will shape product development strategies, while cost optimization and localization will become critical success factors for vendors operating across Asia Pacific's diverse markets..
Market Ecosystem
Related Ecosystem
Software And Services
- Natural Language Processing (NLP)
- Machine Learning
- Supply Chain Management
- Predictive Analytics
- Image Sensors
- International Business Machines Corporation
- MICROSOFT CORPORATION
- Oracle Corporation
- SAP SE
- Amazon.com, Inc.
Aviation
- Narrow Body Aircraft
- Wide Body Aircraft
- Military Helicopters
- Special Mission Aircraft
- Fighter Aircraft
- HONEYWELL INTERNATIONAL INC.
- COLLINS AEROSPACE
- Thales group
- Safran group
- HEICO Corporation
Digitalization And Iot
- Sensors
- Remote Monitoring
- Supply Chain Management
- Passenger Information System (PIS)
- Platform as A Service (PaaS)
- International Business Machines Corporation
- Cisco Systems, Inc.
- MICROSOFT CORPORATION
- Oracle Corporation
- HUAWEI TECHNOLOGIES CO LTD
Key Takeaways
- Asia Pacific smart infrastructure market will grow from $280.52B (2024) to $766.83B (2029) at a 22.3% CAGR, outpacing global growth rates.
- Asia Pacific's urbanization and digital transformation initiatives are accelerating smart city adoption across the region.
- Government investments in IoT, 5G, and smart grid infrastructure are primary growth catalysts for Asia Pacific.
- Asia Pacific's manufacturing and software development capabilities position the region as a global innovation leader in smart infrastructure.
Smart Infrastructure Market Report Scope
| Report Metric | Details |
|---|---|
| Base Year | 2024 |
| Fastest Growing Segment | SMART HEALTHCARE (Type) |
| Forecast Period | 2024-2029 |
| Growth Rate | CAGR of 18% from 2024 to 2029 |
| Largest Segment | HARDWARE (Offering) |
| Market Size Base Year (Billions) | ~USD 922.08 (2024) |
| Revenue Forecast (Billions) | ~USD 2109.5 (2029) |
| Segments Covered | Offering, Service, Professional Service, Focus Area, End User, Type, Transportation Mode |
Asia Pacific Smart Infrastructure Market Report Segmentation
7 segment dimensions are covered across the global market.
By Offering
- Hardware
- Services
- Software
By Service
- Managed Services
- Professional Services
By Professional Service
- Consulting & Implementation
- Support & Maintenance
- Training & Education
By Focus Area
- Other Focus Areas
- Smart Agriculture
- Smart Buildings
- Smart Citizen Services
- Smart Government
- Smart Healthcare
- Smart Hospitality
- Smart Manufacturing
- Smart Transportation
- Smart Utilities
By End User
- Commercial
- Government & Defense
- Industrial
- Residential
By Type
- Egovernance
- Services
- Smart Education
- Smart Healthcare
- Smart Public Safety
- Smart Street Lighting
- Solutions
By Transportation Mode
- Airway
- Maritime
- Railway
- Roadway
Target Audience
- Technology Solution Providers : Smart infrastructure vendors and IoT platform developers need Asia Pacific market data to identify growth segments, understand regional customer requirements, and develop localized solutions for China, India, Japan, and emerging markets.
- Government & Urban Planning Agencies : City planners and government officials require market intelligence to benchmark smart city initiatives, understand technology trends, and make informed decisions about infrastructure investments and vendor selection.
- Investment & Private Equity Firms : Investors seeking exposure to Asia Pacific's high-growth smart infrastructure sector need detailed market sizing, growth forecasts, and country-level analysis to identify acquisition targets and investment opportunities.
- Telecommunications & Infrastructure Companies : Telecom operators and infrastructure providers need Asia Pacific market insights to understand 5G-enabled smart infrastructure demand, identify partnership opportunities, and plan network expansion strategies.
- Management Consultants & Analysts : Consulting firms and research analysts require comprehensive Asia Pacific market data to support client advisory work, competitive analysis, and strategic planning across the smart infrastructure sector.
Countries within Asia Pacific - compare and drill down
| Country | 2025 size (native) |
|---|---|
| China | USD 338320 Million |
| Japan | USD 178900 Million |
| India | USD 165870 Million |
| UAE | USD 49230 Million |
| Rest Of Asia Pacific | USD 83740 Million |
Country market size visualization
Reasons to Buy this Report
- Identify High-Growth Opportunities : Gain detailed insights into Asia Pacific's 22.3% CAGR market dynamics to identify emerging opportunities in smart city solutions, IoT infrastructure, and 5G deployments across the region's fastest-growing economies.
- Strategic Market Positioning : Understand country-specific market sizes and growth trajectories across China, Japan, India, and other Asia Pacific nations to develop targeted market entry and expansion strategies aligned with regional demand patterns.
- Competitive Intelligence : Access comprehensive analysis of Asia Pacific's smart infrastructure landscape to benchmark competitive positioning, identify market gaps, and anticipate competitor moves in this rapidly evolving region.
- Investment Decision Support : Leverage detailed market forecasts and regional growth projections through 2029 to make informed investment decisions, allocate resources effectively, and prioritize markets with the highest return potential.
- Government & Policy Insights : Understand how government initiatives, 5G rollouts, and digital transformation policies across Asia Pacific are shaping smart infrastructure adoption, enabling proactive business strategy adjustments.
Frequently asked questions
What is the projected market size for smart infrastructure in Asia Pacific by 2029?
Asia Pacific's smart infrastructure market is projected to reach $766.83 billion by 2029, growing from $280.52 billion in 2024.
What is the CAGR for Asia Pacific's smart infrastructure market?
Asia Pacific's smart infrastructure market is expected to grow at a compound annual growth rate of 22.3% between 2024 and 2029.
Which factors are driving smart infrastructure growth in Asia Pacific?
Key drivers include rapid urbanization, government digital transformation initiatives, investments in 5G and IoT infrastructure, and demand for smart city solutions across Asia Pacific.
How does Asia Pacific's growth compare to the global smart infrastructure market?
Asia Pacific's 22.3% CAGR significantly exceeds the global average of 18%, making the region the fastest-growing market for smart infrastructure.
What smart infrastructure solutions are most in demand across Asia Pacific?
Asia Pacific shows strong demand for smart grids, intelligent transportation systems, connected building technologies, and public safety infrastructure solutions.
RESEARCH METHODOLOGY
The study involved four major activities in estimating the current size of the global smart infrastructure market. Exhaustive secondary research was done to collect information on the market, peer market, and parent market. The next step was to validate these findings, assumptions, and sizing with industry experts across the value chain through primary research. Both top-down and bottom-up approaches were employed to estimate the total smart infrastructure market size. After that, the market breakup and data triangulation techniques were used to estimate the market size of segments and subsegments.
Secondary Research
Various secondary sources, such as Bloomberg and BusinessWeek, were referred to in the secondary research process to identify and collect information for this study. The secondary sources included company annual reports, press releases, and investor presentations; white papers; journals, such as Linux Journal and Container Journal; and articles from recognized authors, directories, and databases.
Primary Research
Various primary sources from supply and demand sides were interviewed to obtain qualitative and quantitative information for this report. The primary sources from the supply side included industry experts, such as Chief Executive Officers (CEOs), Chief Marketing Officers (CMO), Vice Presidents (VPs), Managing Directors (MDs), technology and innovation directors, and related key executives from various key companies and organizations operating in the smart infrastructure market along with the associated service providers, and system integrators operating in the targeted regions. All possible parameters that affect the market covered in this research study have been accounted for, viewed in extensive detail, verified through primary research, and analyzed to get the final quantitative and qualitative data. Following is the breakup of primary respondents.
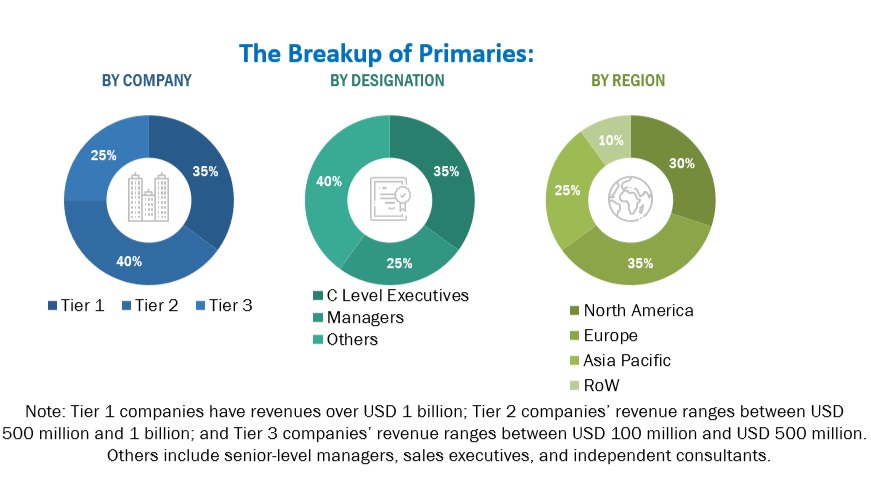
To know about the assumptions considered for the study, download the pdf brochure
|
Company Name |
Designation |
|
Siemens |
Senior Manager |
|
Sense |
VP |
|
Hitachi |
Business Executive |
Market Size Estimation
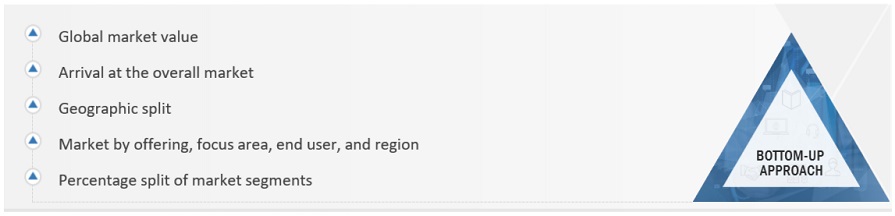
The top-down and bottom-up approaches were used to make market estimates and forecast the smart infrastructure market and other dependent submarkets. The bottom-up procedure was used to arrive at the overall market size of the global smart infrastructure market using key companies’ revenue and their offerings in the market. The research methodology used to estimate the market size includes the following:
- The key players in the Smart Infrastructure Market have been identified through extensive secondary research.
- The market size, in terms of value, has been determined through primary and secondary research processes.
- All percentage shares, splits, and breakups have been determined using secondary sources and verified through primary sources.
Smart Infrastructure Market Size: Bottom-Up Approach
To know about the assumptions considered for the study, Request for Free Sample Report
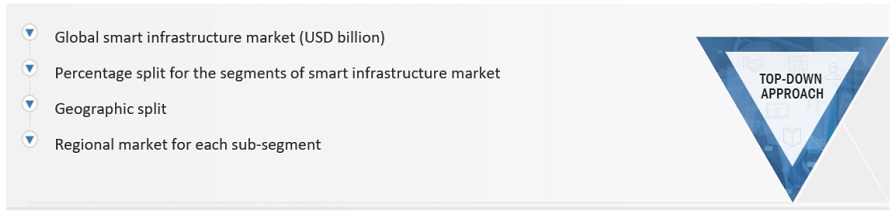
Smart infrastructure market Size: Top-Down Approach
Data Triangulation
This study determined and confirmed the exact value of the overall parent market size through data triangulation and validation through primary interviews. The overall market size was then used in the top-down procedure to estimate the size of other individual markets via percentage splits of the market segmentation.
Market Definition
Smart infrastructure encompasses advanced technologies and solutions designed to improve the efficiency, sustainability, and functionality of infrastructure systems. These systems include transportation, buildings, energy, water, waste management, public services, etc. Smart infrastructure integrates various digital technologies, such as IoT (Internet of Things), AI (Artificial Intelligence), big data analytics, and cloud computing, among others, to create interconnected, intelligent systems that enhance the quality of life, economic efficiency, and environmental sustainability.
Key Stakeholders
- Network infrastructure enablers
- Technology vendors
- Real-estate Developers
- Telecom Service Providers (TSPs)
- Communication Service Providers (CSPs)
- System Integrators (SIs)
- Platform Providers
- Compliance regulatory authorities
- Government authorities
- Investment firms
- Independent Software Vendors (ISVs)
- Smart Infrastructure Alliances/Groups
- Utility Companies
- Transportation Service Providers
Report Objectives
- To determine, segment, and forecast the global smart infrastructure market based on offering, focus area, end user, and region in terms of value.
- To forecast the size of the market segments to five main regions: North America, Europe, Asia Pacific, Middle East & Africa, and Latin America.
- To provide detailed information about the major factors (drivers, opportunities, threats, and challenges) influencing the growth of the smart infrastructure market.
- To study the complete value chain and related industry segments and perform a value chain analysis of the smart infrastructure market landscape.
- To strategically analyze the macro and micro markets to individual growth trends, prospects, and contributions to the total smart infrastructure market.
- To analyze the industry trends, patents, and innovations related to the smart infrastructure market.
- To analyze the opportunities for stakeholders by identifying the high-growth segments of the smart infrastructure market.
- To profile the key players in the market and comprehensively analyze their market share/ranking and core competencies.
- To track and analyze competitive developments, such as mergers & acquisitions, product launches & developments, partnerships, agreements, collaborations, business expansions, and Research & Development (R&D) activities.
Available Customizations
With the given market data, MarketsandMarkets offers customizations as per the company’s specific needs. The following customization options are available for the report:
Company Information
- Detailed analysis and profiling of an additional two market players
Get the Full Smart Infrastructure Market Report
Full forecast, segment splits, and company analysis for all Smart Infrastructure Market.
- Canada Smart Infrastructure Market
- US Smart Infrastructure Market
- UK Smart Infrastructure Market
- Germany Smart Infrastructure Market
- China Smart Infrastructure Market
- Japan Smart Infrastructure Market
- India Smart Infrastructure Market
- UAE Smart Infrastructure Market
- Brazil Smart Infrastructure Market
- France Smart Infrastructure Market
- Italy Smart Infrastructure Market
- Rest Of Europe Smart Infrastructure Market
- Rest Of Asia Pacific Smart Infrastructure Market
- Mexico Smart Infrastructure Market
- Rest Of Latin America Smart Infrastructure Market
- Ksa Smart Infrastructure Market
- Rest Of GCC Countries Smart Infrastructure Market
Need a Tailored Report?
Customize this report to your needs
Get 10% FREE Customization
Customize This Report
