
Asia Pacific Smart Shopping Cart Market (2025-2030)

The Asia Pacific Smart Shopping Cart Market was valued at $68.79 Million in 2025 and projected to reach to $372.13 Million by 2030, representing a compound annual growth rate of 40.2%. Asia Pacific is positioned as the fastest-growing region for smart shopping cart adoption, driven by transformative digital retail trends and substantial retailer investments in omnichannel infrastructure.


| Market Size in | USD 26.32 MN |
| Market Forecast in | |
| CAGR | |
| Forecast Period | |
| Units Considered | Value (USD MN) |
Asia Pacific Smart Shopping Cart Market Trends and Insights
- Asia Pacific is emerging as a critical growth hub for intelligent retail technologies, driven by increasing smartphone penetration, urbanization, and retailer investment in omnichannel solutions.
- The region's 40.2% compound annual growth rate significantly outpaces global trends, reflecting strong adoption across major economies including China, India, Japan, and Southeast Asia. Asia Pacific retailers are leveraging smart shopping carts to enhance customer experience, reduce checkout friction, and capture real-time shopping behavior data.
- The forecast period (2025–2030) will see accelerated deployment across hypermarkets, supermarkets, and specialty retailers as infrastructure matures and costs decline.
- Asia Pacific's young, tech-savvy consumer base and competitive retail landscape position the region as a primary driver of global smart shopping cart innovation and market growth..
Key Market Statistics
- CAGR (2025-2030) 40.2% CAGR
- Market Size, 2025 ~USD 68.79 Million
- Forecast, 2030 ~USD 372.13 Million
- Geography Asia Pacific
Asia Pacific Smart Shopping Cart Market Overview
Explosive Growth Trajectory :
Asia Pacific's smart shopping cart market is projected to grow from $68.79 million in 2025 to $372.13 million by 2030, representing a 40.2% CAGR—significantly outpacing the global average of 34.4%.
China's Market Dominance :
China leads the Asia Pacific region with a market size of $171.55 million, driven by advanced e-commerce infrastructure, high smartphone adoption, and major retailer investments in AI-powered retail solutions.
Urbanization & Digital Adoption :
Rapid urbanization across Asia Pacific, combined with increasing smartphone penetration and rising middle-class consumer bases, is accelerating demand for intelligent retail technologies and omnichannel shopping experiences.
Emerging Market Opportunities :
Beyond China and Japan, emerging economies in Asia Pacific present untapped potential, with Rest of Asia Pacific valued at $32.3 million and growing as retailers modernize operations and consumer tech adoption accelerates.
Asia Pacific Smart Shopping Cart Market Dynamics
- The region's 40.2% CAGR reflects strong momentum from China's e-commerce leadership, Japan's retail innovation, and India's emerging digital consumer base.
- Smartphone penetration, urbanization, and competitive retail landscapes are compelling businesses to deploy intelligent shopping solutions that enhance customer experience and operational efficiency. Looking ahead to 2030, Asia Pacific's market is expected to nearly quintuple, reaching $372.13 million as adoption spreads beyond tier-1 cities into secondary and tertiary markets.
- Government digital initiatives, increasing consumer expectations for seamless shopping, and retailer focus on data-driven personalization will continue fueling expansion.
- The region's young, tech-savvy demographic and growing logistics capabilities position Asia Pacific as a critical innovation hub for smart retail technologies globally..
Market Ecosystem
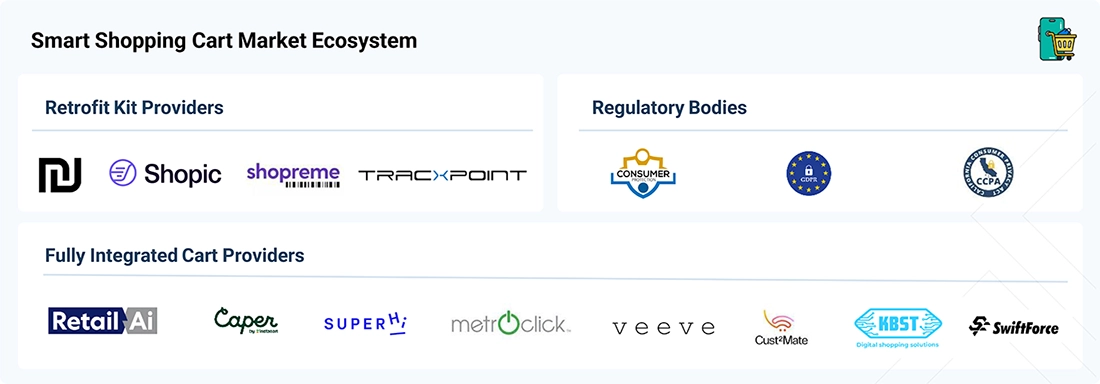
SMART SHOPPING CART MARKET: COMMERCIAL USE CASES ACROSS INDUSTRIES
| COMPANY | USE CASE DESCRIPTION | BENEFITS |
|---|---|---|
 |
Schnucks deployed Caper Carts to give customers AI-powered product recognition, running basket totals, digital coupons, and checkout directly in the cart. Caper also enables location-based promotions and advertising as shoppers move through the store. (Instacart) | Improves shopping convenience, supports personalized promotions, and creates opportunities to increase basket sizes and generate retail media revenue. |
 |
Shufersal deployed Shopic's smart cart solution across its stores using Shopic's modular clip-on technology. The solution was designed to provide automated product recognition, personalized engagement, and a faster shopping experience without replacing the retailer's existing cart fleet. Shopic reported an 8% increase in shoppers' monthly spending during the case study and said Shufersal planned deployment across about 200 large branches. (Shopic) | Supports larger basket values, customer engagement, and scalable deployment while reducing the need for retailers to replace existing shopping carts. |
 |
Yochananof, a major Israeli supermarket chain, deployed Cust2Mate smart carts across its stores to address checkout queues and improve store automation. The carts let shoppers scan and pay for products during their shopping trip while providing personalized ads, coupons, and shopping information. Cust2Mate reports that the deployment served thousands of customers daily and eliminated five cashier lines per store. (Cust2Mate) | Reduces checkout congestion and labor requirements while supporting larger basket sizes, personalized promotions, and improved shopper engagement. |
Logos and trademarks shown above are the property of their respective owners. Their use here is for informational and illustrative purposes only.
Related Ecosystem
Key Takeaways
- Asia Pacific smart shopping cart market will grow from $68.79M (2025) to $372.13M (2030) at a 40.2% CAGR, outpacing global growth.
- China, India, and Japan lead Asia Pacific adoption, driven by digital transformation and competitive retail environments.
- Integration with mobile payments, loyalty programs, and AI-powered recommendations is accelerating Asia Pacific market penetration.
- Infrastructure maturation and declining hardware costs will unlock mass-market deployment across Asia Pacific retail chains by 2030.
Smart Shopping Cart Market Report Scope
| Report Metric | Details |
|---|---|
| Base Year | 2025 |
| Fastest Growing Segment | DISTRIBUTOR (Mode Of Sale) |
| Forecast Period | 2025–2030 |
| Growth Rate | CAGR of 34.4% from 2025 to 2030 |
| Largest Segment | DIRECT (Mode Of Sale) |
| Market Size Base Year (Billions) | ~USD 0.32 (2025) |
| Revenue Forecast (Billions) | ~USD 1.42 (2030) |
| Segments Covered | Cart Type, Application Area, Mode Of Sale |
Asia Pacific Smart Shopping Cart Market Report Segmentation
3 segment dimensions are covered across the global market.
By Cart Type
- Fully Integrated Cart
- Fully Integrated Carts
- Retrofit Kits
By Application Area
- Other Application Areas
- Shopping Malls
- Supermarkets
By Mode Of Sale
- Direct
- Distributor
Target Audience
- Retail Technology Vendors : Smart cart manufacturers and software providers need Asia Pacific market data to prioritize product development, localize solutions for regional preferences, and identify high-growth country markets for expansion.
- Retail Chains & Operators : Large retailers and supermarket chains across Asia Pacific require competitive benchmarking, adoption trend analysis, and ROI projections to justify smart shopping cart investments and omnichannel modernization.
- Private Equity & Investors : Investment firms evaluating retail technology opportunities in Asia Pacific need detailed market sizing, growth forecasts, and regional dynamics to assess portfolio companies and identify acquisition targets.
- Consultants & Strategy Firms : Management consultants advising retailers and technology companies on digital transformation strategies require Asia Pacific-specific market intelligence to develop credible, region-tailored recommendations.
- Government & Trade Bodies : Policy makers and industry associations in Asia Pacific need market data to understand retail technology adoption, inform digital commerce initiatives, and support regional economic development strategies.
Key Companies in the Asia Pacific Smart Shopping Cart Market
| Company | HQ | Ownership | Strongest segments |
|---|---|---|---|
| AMAZON | United States | Public Company | Fully Integrated Carts,Retrofit Kits,Shopping Malls, |
| SUPERHII | Singapore | Public Company | Fully Integrated Carts,Retrofit Kits, |
| CUST2MATE | Canada | Public Company | Fully Integrated Carts,Retrofit Kits,Software, Data & Maintenance Services, |
| SHEKEL | Israel | Private Company | Retrofit Kits,Fully Integrated Carts,Embedded Weighing for OEM Carts, |
| KBST | South Korea | Public Investment Firm | Fully Integrated Carts,Retrofit Kits, |
AMAZON
Amazon is a public company founded in 1994 in the United States with 1,576,000 employees. It operates as a multinational technology and e-commerce corporation.
SUPERHII
Superhii is a public company founded in 2022 in Singapore with 14,003 employees.
CUST2MATE
Cust2Mate is a public company founded in Canada with 201 employees.
SHEKEL
Shekel is a private company founded in 1971 in Israel.
KBST
KBST is a public investment firm based in South Korea.
Countries within Asia Pacific - compare and drill down
| Country | 2025 size (native) |
|---|---|
| China | USD 171.55 Million |
| India | USD 42.5 Million |
| Japan | USD 85.22 Million |
| Anz | USD 40.56 Million |
| Rest Of Asia Pacific | USD 32.3 Million |
Country market size visualization
Reasons to Buy this Report
- Regional Growth Insights : Gain detailed market intelligence specific to Asia Pacific's 40.2% CAGR, including country-level breakdowns for China, Japan, India, and emerging markets to identify high-potential expansion opportunities.
- Competitive Landscape Analysis : Understand Asia Pacific's unique competitive dynamics, retailer strategies, and technology adoption patterns that differ significantly from Western markets, enabling informed market entry and positioning decisions.
- Investment & Expansion Planning : Access forecasted market valuations through 2030 to support capital allocation, partnership development, and go-to-market strategies tailored to Asia Pacific's rapidly evolving retail ecosystem.
- Consumer & Retailer Behavior : Discover Asia Pacific-specific consumer preferences, urbanization trends, and retailer investment priorities driving smart shopping cart adoption across diverse markets and retail segments.
- Technology Adoption Trends : Identify emerging technology integration patterns, omnichannel requirements, and digital transformation priorities unique to Asia Pacific retailers seeking competitive differentiation.
Frequently asked questions
What is the projected size of the Asia Pacific smart shopping cart market by 2030?
The Asia Pacific smart shopping cart market is projected to reach $372.13 million by 2030, growing from $68.79 million in 2025.
What is the CAGR for the Asia Pacific smart shopping cart market?
Asia Pacific is expected to grow at a compound annual growth rate of 40.2% between 2025 and 2030.
Which countries are driving growth in the Asia Pacific smart shopping cart market?
China, India, Japan, and Southeast Asian nations are primary growth drivers in Asia Pacific, supported by digital infrastructure and retail modernization.
What technologies are integrated into Asia Pacific smart shopping carts?
Asia Pacific smart shopping carts incorporate mobile payment systems, AI-powered product recommendations, RFID tracking, and loyalty program integration.
Why is Asia Pacific growing faster than the global smart shopping cart market?
Asia Pacific's rapid growth is driven by high smartphone adoption, urbanization, competitive retail landscapes, and aggressive digital transformation investments by major retailers.
RESEARCH METHODOLOGY
This research study relied heavily on secondary sources, directories, and databases, including Dun & Bradstreet (D&B), Hoovers, and Bloomberg Businessweek, to identify and collect information relevant to a technical, market-oriented, and commercial study of the smart shopping cart market. The primary sources have consisted primarily of industry experts from core and related industries, as well as preferred suppliers, manufacturers, distributors, service providers, technology developers, alliances, and organizations related to all segments of the value chain of this market. In-depth interviews were conducted with primary respondents, including key industry participants, subject matter experts, C-level executives of key market players, and industry consultants, to obtain and verify critical qualitative and quantitative information.
Secondary Research
The market size of companies offering smart shopping carts worldwide was arrived at based on secondary data available through paid and unpaid sources. It was also determined by analyzing the product portfolio of major companies and rating them based on their performance and quality. In the secondary research process, various secondary sources were referred to identify and collect information for the study. These sources included annual reports, press releases, company investor presentations, white papers, certified publications, and articles from recognized associations and government publishing sources. Several journals and associations, such as The Grocer & Progressive Grocer and the International Journal of Retail & Distribution Management, were also referenced. Secondary research was used to gather key information on industry insights, the market’s value chain, the overall pool of key players, market classification, and segmentation based on industry trends, regional markets, and key developments from both market- and technology-oriented perspectives.
Secondary research was mainly used to obtain key information about the industry’s value chain and supply chain and to identify key players through various solutions and services, market classification and segmentation according to offerings of major players, industry trends related to technologies, applications, and regions, and key developments from both market-oriented and technology-oriented perspectives.
Primary Research
During the primary research process, various primary sources from both the supply and demand sides were interviewed to gather qualitative and quantitative information on the market. The primary sources from the supply side included various industry experts, including Chief Experience Officers (CXOs), Vice Presidents (VPs), directors from business development, marketing, and product development/innovation teams, related key executives from smart shopping cart solution vendors, professional service providers, and industry associations, and key opinion leaders.
Primary interviews gathered insights, including market statistics, revenue data from solutions and services, market segmentation, market size estimates, market forecasts, and data triangulation. Primary research also helped in understanding various trends related to technologies, applications, deployments, and regions. Stakeholders from the demand side, such as Chief Information Officers (CIOs), Chief Technology Officers (CTOs), Chief Strategy Officers (CSOs), and end users using smart shopping cart solutions, were interviewed to understand the buyer’s perspective on suppliers, products, service providers, and their current usage of smart shopping cart solutions, which would impact the overall Smart shopping cart market.
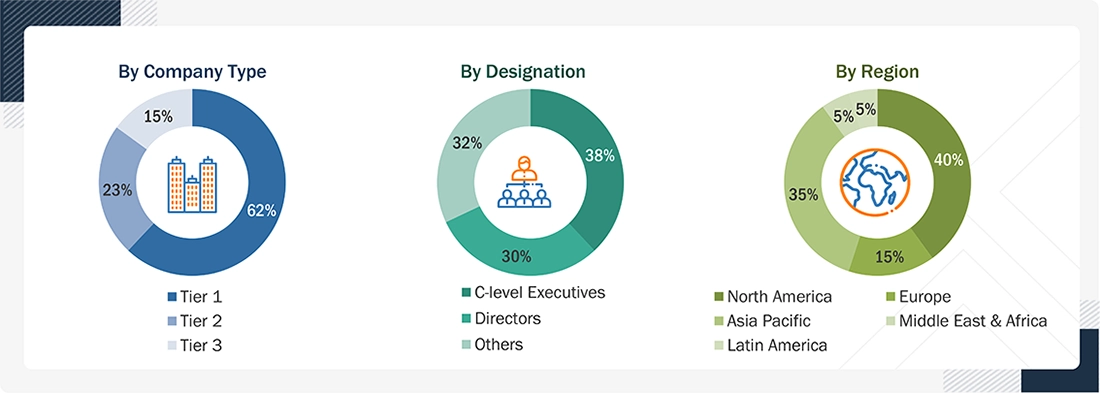
Others include sales managers, marketing managers, and product managers.
Note: Tier 1 companies’ revenue is more than USD 1 billion; Tier 2 companies’ revenue ranges between USD 500 million and USD 1 billion; and Tier 3 companies’ revenue ranges between USD 100 million and USD 500 million
To know about the assumptions considered for the study, download the pdf brochure
Market Size Estimation
Multiple approaches were adopted to estimate and forecast the size of the smart shopping cart market. The first approach estimates market size by summing up the revenue generated by companies from sales of smart shopping cart solutions.
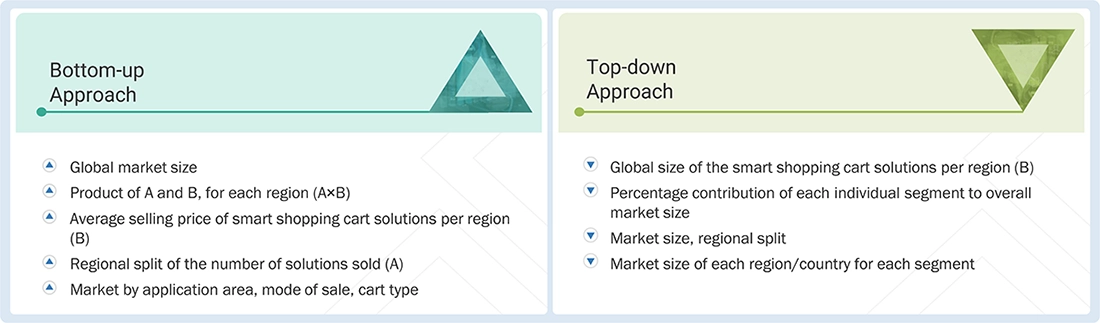
The report used top-down and bottom-up approaches to estimate and validate the total size of the smart shopping cart market. These methods were also extensively used to estimate the size of various market segments. The research methodology used to evaluate the market size is listed below.
- Key players in the market have been identified through extensive secondary research.
- For value, the industry’s supply chain and market size were determined through a combination of primary and secondary research.
- All percentage shares, splits, and breakups have been determined using secondary sources and verified through primary sources.
Smart Shopping Cart Market : Top-Down and Bottom-Up Approach
Data Triangulation
After determining the overall market size, the smart shopping cart market was segmented into several categories and subcategories. A data triangulation procedure was employed to complete the overall market engineering process and derive the precise statistics for all segments and subsegments, as applicable. The data was triangulated by examining factors and trends from both the demand and supply sides. In addition to data triangulation and market breakdown, the market size was validated using both top-down and bottom-up approaches.
Market Definition
A smart shopping cart is an Internet of Things (IoT) enabled retail device that integrates advanced hardware and software, such as barcode scanners, computer vision cameras, weight sensors, and touchscreens, directly into the physical shopping trolley. This technology lets customers scan, weigh, and pay for items directly at the cart, bypassing traditional checkout lines while giving retailers real-time data on shopping behavior and inventory levels.
Key Stakeholders
- Technology & Hardware Providers
- Retailers
- End Users
- Infrastructure & Enablers
- Regulatory & Governance Organizations
- Software and Connectivity Providers
- Consulting and Advisory Firms
- Investors and Venture Capitalists
- Independent Software Vendors (ISVs)
- Value-added Resellers (VARs) and Distributors
Report Objectives
- To determine and forecast the global smart shopping cart market by application area, mode of sale, cart type, and region
- To forecast the size of the market segments for North America, Europe, Asia Pacific, Latin America, and the Middle East & Africa
- To provide detailed information about the major factors (drivers, restraints, opportunities, and challenges) influencing the growth of the smart shopping cart market
- To analyze each submarket concerning individual growth trends, prospects, and contributions to the overall smart shopping cart market
- To analyze the opportunities in the market for stakeholders by identifying the high-growth segments of the smart shopping cart market
- To profile the key market players, provide a comparative analysis based on business overviews, regional presence, product offerings, business strategies, and key financials, and illustrate the market’s competitive landscape
- Track and analyze competitive developments in the market, such as mergers and acquisitions, product development, partnerships and collaborations, and research and development (R&D) activities
Available customizations:
With the given market data, MarketsandMarkets offers customizations to meet the company’s specific needs. The following customization options are available for the report:
Country-wise information
- Analysis for additional countries (up to five)
Company Information
- Detailed analysis and profiling of additional market players (up to 5)
Get the Full Smart Shopping Cart Market Report
Full forecast, segment splits, and company analysis for all Smart Shopping Cart Market.
- US Smart Shopping Cart Market
- Canada Smart Shopping Cart Market
- UK Smart Shopping Cart Market
- Germany Smart Shopping Cart Market
- France Smart Shopping Cart Market
- Italy Smart Shopping Cart Market
- China Smart Shopping Cart Market
- India Smart Shopping Cart Market
- Japan Smart Shopping Cart Market
- Israel Smart Shopping Cart Market
- UAE Smart Shopping Cart Market
- South Africa Smart Shopping Cart Market
- Chile Smart Shopping Cart Market
- Mexico Smart Shopping Cart Market
- Rest Of Europe Smart Shopping Cart Market
- Anz Smart Shopping Cart Market
- Rest Of Asia Pacific Smart Shopping Cart Market
- Rest Of Latin America Smart Shopping Cart Market
Need a Tailored Report?
Customize this report to your needs
Get 10% FREE Customization
Customize This Report
