
Asia Pacific Tea Extract Market (2025-2030)

The Asia Pacific Tea Extract Market was valued at $1072.5 Million in 2025 and projected to reach to $1571.9 Million by 2030, representing a compound annual growth rate of 7.9%. The Asia Pacific tea extract market is positioned for sustained expansion through 2030, with the region's valuation growing from USD 1,072.5 million to USD 1,571.9 million.


| Market Size in | USD 26.32 MN |
| Market Forecast in | |
| CAGR | |
| Forecast Period | |
| Units Considered | Value (USD MN) |
Asia Pacific Tea Extract Market Trends and Insights
- Asia Pacific dominates global tea extract consumption, driven by strong demand from beverage manufacturers, functional food producers, and the region's deep-rooted tea culture.
- The market's 7.9% compound annual growth rate reflects increasing consumer preference for natural ingredients, health-conscious formulations, and ready-to-drink tea beverages across major economies including China, India, Japan, and Southeast Asia. Asia Pacific's tea extract market benefits from rising disposable incomes, urbanization, and growing awareness of tea's antioxidant and wellness properties.
- Manufacturers in Asia Pacific are innovating with concentrated extracts, instant tea powders, and specialty formulations to meet diverse applications in beverages, confectionery, cosmetics, and pharmaceuticals.
- The region's established tea production infrastructure and supply chain advantages position Asia Pacific as both a major consumer and exporter of tea extracts globally..
Key Market Statistics
- CAGR (2025-2030) 7.9% CAGR
- Market Size, 2025 ~USD 1072.5 Million
- Forecast, 2030 ~USD 1571.9 Million
- Geography Asia Pacific
Asia Pacific Tea Extract Market Overview
Regional Market Dominance :
Asia Pacific commands the largest share of global tea extract consumption, leveraging centuries-old tea traditions and rapidly expanding modern beverage manufacturing sectors across China, Japan, and India.
Strong CAGR Performance :
The region's 7.9% CAGR from 2025-2030 demonstrates sustained growth momentum, slightly outpacing the global average of 7.8%, driven by increasing functional beverage adoption and health-conscious consumer trends.
China's Market Leadership :
China represents the largest market within Asia Pacific at USD 708.7 million, accounting for over 66% of regional demand, supported by massive tea production capacity and growing export-oriented beverage innovation.
Diversified Growth Drivers :
Market expansion is fueled by functional food producers, premium beverage manufacturers, and nutraceutical companies capitalizing on tea extract's antioxidant properties and clean-label appeal across multiple product categories.
Asia Pacific Tea Extract Market Dynamics
- This growth trajectory reflects deepening consumer awareness of tea's health benefits, particularly in functional beverages and dietary supplements.
- China's dominance as a production and consumption hub, combined with India's emerging beverage sector and Japan's premium positioning, creates a diversified growth landscape. Key catalysts include rising disposable incomes, urbanization, and shifting preferences toward natural ingredients over synthetic additives.
- Beverage manufacturers are increasingly incorporating tea extracts into ready-to-drink products, energy drinks, and wellness beverages.
- The region's established tea culture provides inherent market advantages, while regulatory support for natural food ingredients and growing export opportunities further accelerate market penetration across Asia Pacific's diverse consumer base..
Market Ecosystem
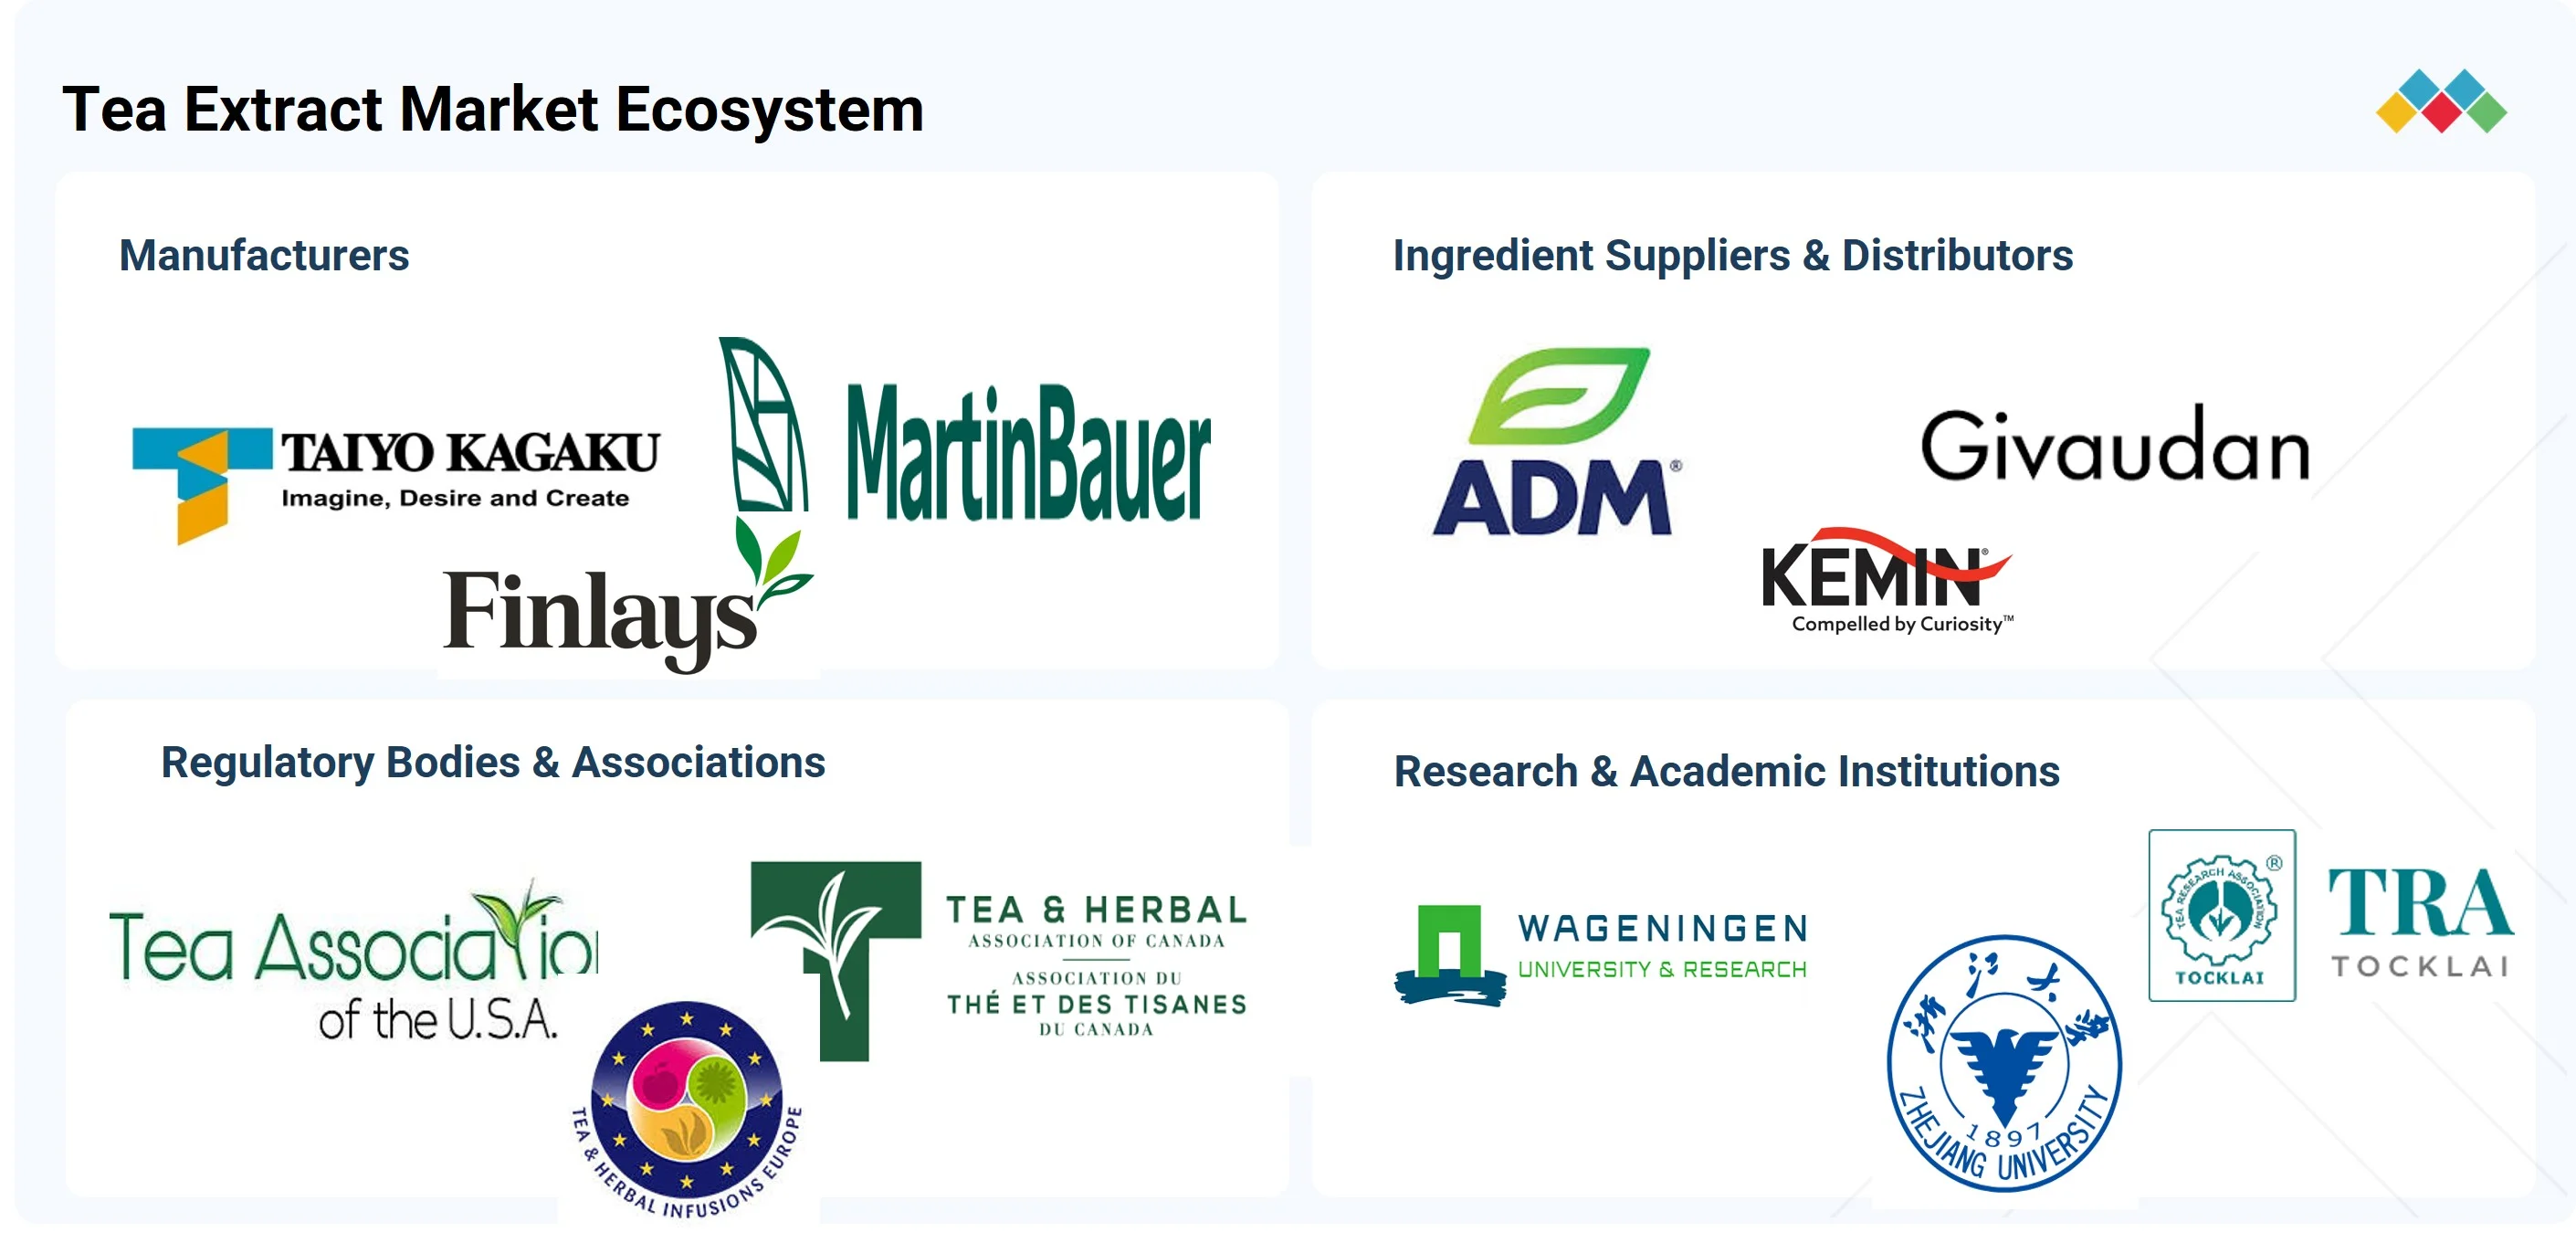
TEA EXTRACT MARKET: COMMERCIAL USE CASES ACROSS INDUSTRIES
| COMPANY | USE CASE DESCRIPTION | BENEFITS |
|---|---|---|
 |
Tea extracts, concentrates, powders, and aromas for ready-to-drink teas, functional beverages, and other food and beverage applications. | Consistent tea flavor, streamlined beverage manufacturing, and flexible product formulation. |
 |
Tea and botanical extracts for functional beverages, herbal infusions, dietary supplements, and wellness-oriented products. | Access to botanical ingredient expertise, diversified formulations, and reliable ingredient quality. |
 |
Green tea extracts and water-soluble tea ingredients for functional beverages, food products, and nutraceutical formulations. | Improved water solubility, convenient processing, and enhanced formulation versatility. |
 |
Green tea extracts and standardized botanical ingredients for dietary supplements, food, and health-oriented formulations. | Consistent ingredient specifications, formulation support, and the incorporation of bioactive compounds derived from tea. |
Logos and trademarks shown above are the property of their respective owners. Their use here is for informational and illustrative purposes only.
Related Ecosystem
Plant Based Alternatives Ingredients
- Dairy Products
- Bakery Products
- Diaphragm Pumps
- Enzymatic Hydrolysis
- Microorganism
- AZELIS HOLDINGS SA
- Archer-Daniels-Midland Company
- Amway
- CARGILL, INCORPORATED
- GRIFFITH FOODS
Key Takeaways
- Asia Pacific tea extract market valued at USD 1,072.5 million in 2025, expanding to USD 1,571.9 million by 2030 at 7.9% CAGR
- Asia Pacific's strong tea heritage and growing functional beverage demand drive regional market leadership and innovation
- Rising health consciousness and premiumization trends in Asia Pacific fuel adoption of concentrated tea extracts across multiple applications
- Asia Pacific's integrated supply chain and production capabilities position the region as a global hub for tea extract manufacturing and export
Tea Extract Market Report Scope
| Report Metric | Details |
|---|---|
| Base Year | 2025 |
| Fastest Growing Segment | ORGANIC TEA EXTRACTS (Category) |
| Forecast Period | 2025–2030 |
| Growth Rate | CAGR of 7.8% from 2025 to 2030 |
| Largest Segment | CONVENTIONAL TEA EXTRACTS (Category) |
| Market Size Base Year (Billions) | ~USD 2.99 (2025) |
| Revenue Forecast (Billions) | ~USD 4.36 (2030) |
| Segments Covered | Source, Form, Category, Application, Sub-Application |
Asia Pacific Tea Extract Market Report Segmentation
5 segment dimensions are covered across the global market.
By Source
- Black Tea
- Green Tea
- Oolong Tea
- Other Tea Sources
By Form
- Encapsulated
- Liquid
- Powder
By Category
- Conventional Tea Extracts
- Organic Tea Extracts
By Application
- Cosmetics & Personal Care
- Food & Beverage
- Pharmaceuticals & Dietary Supplements
By Sub-Application
- Anti-Aging Creams
- Antioxidant Supplements
- Bakery & Confectionery
- Carbonated & Soft Drinks
- Dairy Products
- Functional Beverages
- Hair Care
- Herbal Medicines
- Oral Care
- Other Cosmetics & Personal Care
- Other Foods & Beverages
- Other Pharmaceuticals & Dietary Supplements
- Skin Care
- Therapeutic Products
- Weight Loss Products
Target Audience
- Beverage Manufacturers : Require Asia Pacific market data to develop regional product portfolios, optimize tea extract sourcing from local suppliers, and capitalize on growing demand for functional and premium beverages.
- Food & Nutraceutical Companies : Need country-specific market insights to expand tea extract applications in dietary supplements, fortified foods, and wellness products tailored to Asia Pacific consumer preferences.
- Tea Extract Suppliers & Producers : Depend on regional market forecasts and competitive analysis to identify growth markets, optimize production capacity, and develop distribution strategies across Asia Pacific.
- Investment & Private Equity Firms : Utilize market sizing and CAGR data to evaluate acquisition targets, assess regional growth potential, and make informed investment decisions in Asia Pacific's tea extract value chain.
- Market Strategists & Consultants : Leverage comprehensive Asia Pacific data to advise clients on market entry, competitive positioning, and long-term growth strategies in the region's expanding tea extract sector.
Key Companies in the Asia Pacific Tea Extract Market
| Company | HQ | Ownership | Strongest segments |
|---|---|---|---|
| ADM | United States | Public Company | Ag Services and Oilseeds,Carbohydrate Solutions,Nutrition, |
| TAIYO KAGAKU CO., LTD. | Japan | Public Company | Nutrition (catechins, L-theanine, fibers, NDS iron/vitamins/PUFA),Interface Solution (emulsifiers, emulsified products, protein-based materials, industrial cosmetics/chemicals),Natural Ingredients – processed eggs, instant food ingredients, beverages, confectionery inputs, |
| UMANG GLOBAL GROUP PVT. LTD. | India | Private Company | Core flagship products/services,Customized / value-added solutions,Ancillary products & trading lines, |
ADM
ADM (Archer Daniels Midland) is a publicly traded United States agricultural processing and food ingredients company founded in 1902 with over 41,000 employees.
TAIYO KAGAKU CO., LTD.
Taiyo Kagaku Co., Ltd. is a publicly traded Japanese food ingredients and specialty chemicals company founded in 1946 with 867 employees.
UMANG GLOBAL GROUP PVT. LTD.
Umang Global Group Pvt. Ltd. is a privately held Indian company founded in 1982.
Countries within Asia Pacific - compare and drill down
| Country | 2025 size (native) |
|---|---|
| China | USD 708.7 Million |
| India | USD 184.9 Million |
| Japan | USD 289.9 Million |
| Australia & New Zealand | USD 152.6 Million |
| Rest Of Asia Pacific | USD 235.8 Million |
Country market size visualization
Reasons to Buy this Report
- Country-Level Market Sizing : Access granular market data for China (USD 708.7M), Japan (USD 289.9M), India (USD 184.9M), and other Asia Pacific nations to identify high-potential markets and allocate resources strategically.
- Competitive Landscape Intelligence : Understand regional competitive dynamics, local manufacturer strategies, and market consolidation trends specific to Asia Pacific's fragmented tea extract supply chain.
- Growth Opportunity Mapping : Identify emerging segments within functional beverages, nutraceuticals, and food applications driving the 7.9% CAGR, with Asia Pacific-specific consumer preference insights.
- Regulatory & Trade Insights : Navigate Asia Pacific's diverse regulatory frameworks, quality standards, and export-import dynamics affecting tea extract sourcing, production, and market entry strategies.
- Investment & Expansion Strategy : Leverage regional market forecasts and country-specific valuations to support M&A decisions, facility location planning, and partnership development across Asia Pacific's high-growth markets.
Frequently asked questions
What is the current size of the Asia Pacific tea extract market?
The Asia Pacific tea extract market is valued at USD 1,072.5 million in 2025 and is projected to grow to USD 1,571.9 million by 2030.
What is the growth rate of the Asia Pacific tea extract market?
Asia Pacific's tea extract market is growing at a compound annual growth rate (CAGR) of 7.9% from 2025 to 2030.
Which countries drive the Asia Pacific tea extract market?
Major markets in Asia Pacific include China, India, Japan, and Southeast Asian nations, which collectively drive significant demand for tea extracts in beverages and functional foods.
What applications dominate the Asia Pacific tea extract market?
Asia Pacific tea extracts are primarily used in ready-to-drink beverages, functional foods, confectionery, cosmetics, and pharmaceutical formulations.
What factors are driving growth in Asia Pacific's tea extract market?
Key growth drivers in Asia Pacific include rising health consciousness, premiumization trends, urbanization, increasing disposable incomes, and strong demand for natural, functional ingredients.
RESEARCH METHODOLOGY
This study used two main approaches to estimate the current size of the tea extract market. Exhaustive secondary research was done to collect information on the source (black tea, green tea, oolong tea & other tea sources), form, category, application, and region segments of the market. The next step involved validating these findings, assumptions, and sizing with industry experts across the value chain through primary research. Both top-down and bottom-up approaches were employed to estimate the complete market size. Thereafter, data triangulation was used to estimate the market size of segments and subsegments.
Secondary Research
This study used extensive secondary sources—directories and databases such as Bloomberg Businessweek and Factiva—to identify and collect information for a technical, market-oriented, and commercial market study. In the secondary research process, sources such as annual reports, press releases & investor presentations, white papers, food journals, certified publications, articles from recognized authors, directories, and databases were consulted to identify and collect information. Secondary research was mainly used to obtain key information about the industry’s supply chain, the pool of key players, and market classification and segmentation, aligned with industry trends, down to the bottom-most level, regional markets, and key developments from market- and technology-oriented perspectives.
Primary Research
Extensive primary research was conducted after obtaining information regarding the tea extract market scenario through secondary research. Several primary interviews were conducted with market experts from the demand and supply sides across major countries of North America, Europe, Asia Pacific, South America, and the Rest of the World. Primary data was collected through questionnaires, emails, and telephonic interviews. Primary supply-side sources included industry experts such as Chief Experience Officers (CXOs), vice presidents (VPs), directors from business development, marketing, research, and development teams, and key executives from distributors and key opinion leaders. Primary interviews were conducted to gather insights such as market statistics, data on revenue collected from the products and services, market breakdowns, market size estimations, market forecasting, and data triangulation. Primary research also helped understand the various trends related to source (black tea, green tea, oolong tea & other tea sources), form (liquid, powder, encapsulated), category (organic tea extract, conventional tea extract), application (food & beverages, pharmaceuticals & dietary supplements, cosmetics & personal care), and region. We interviewed demand-side stakeholders, such as farmers, agricultural cooperatives, and commercial agricultural enterprises, to understand buyers’ perspectives on suppliers, products, and business outlook, which will affect the overall market.
Following is the breakdown of primary respondents:
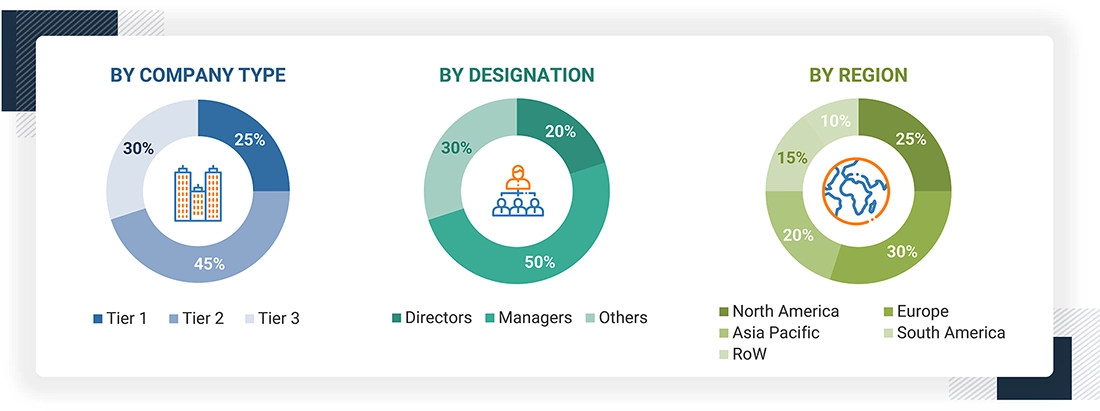
To know about the assumptions considered for the study, download the pdf brochure
Note: The three tiers of companies are defined based on total revenue in 2023 or 2024, based on available financial data: Tier 1: Revenue >USD 1 billion; Tier 2: USD 100 million ≤ revenue ≤ USD 1 billion; Tier 3: Revenue <USD 100 million. RoW includes Africa and the Middle East
|
COMPANY NAME |
DESIGNATION |
|
ADM (US) |
Product Development Manager |
|
Givaudan (Switzerland) |
Sales Head |
|
IFF (US) |
Marketing Head |
|
Tata Consumer Products (India) |
Sales Head |
|
Finlays (UK) |
Senior Research Executive |
Market Size Estimation
The top-down and bottom-up approaches were used to estimate and validate the total size of the tea extract market. These approaches were also used extensively to determine the size of various market subsegments. The research methodology used to estimate the market size includes the following details:
- The key players in the industry and the overall market were identified through extensive secondary research.
- All shares, splits, and breakdowns were determined using secondary sources and verified through primary sources.
- All possible parameters that affect the market covered in this research study were accounted for, viewed in extensive detail, verified through primary research, and analyzed to obtain final quantitative and qualitative data.
- The research included the study of reports, reviews, and newsletters of top market players, along with extensive interviews for opinions from leaders, such as CEOs, directors, and marketing executives.
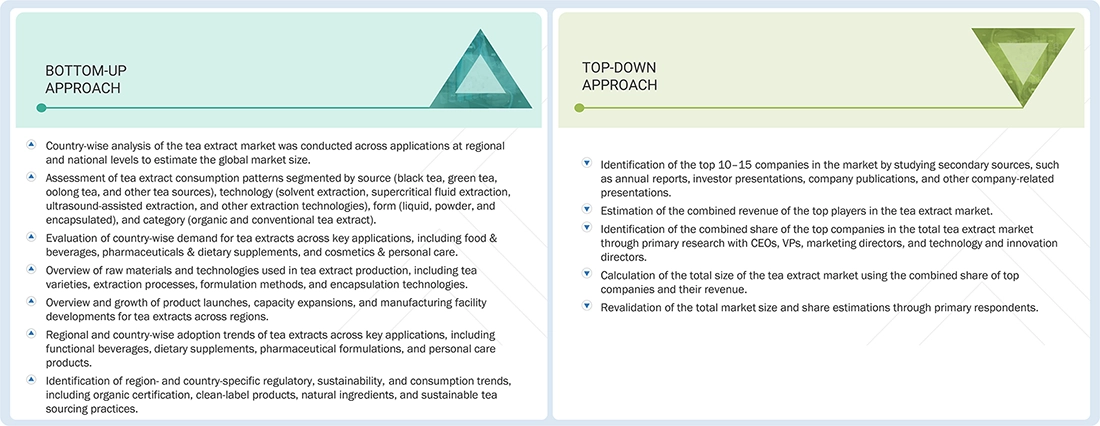
Data Triangulation
After determining the overall market size from the estimation process explained above, the total market was split into several segments and subsegments. The data triangulation procedure was employed, where applicable, to estimate the overall tea extract market and derive accurate statistics for all segments and subsegments. The data was triangulated by studying various factors and trends from the demand and supply sides. The market size was also validated using both the top-down and bottom-up approaches.
Market Definition
Tea extract is a concentrated form derived from carefully processed tea leaves to capture their essential compounds, flavors, and nutrients. It contains soluble tea-leaf components, primarily caffeine, polyphenols, catechins, and antioxidants, which contribute to tea's health benefits and distinct taste. The extraction process involves selecting high-quality tea leaves and using water or solvent extraction to preserve their natural properties. Tea extracts are widely used in food, beverages, cosmetics, and supplements for their functional and nutritional benefits, offering a potent and convenient alternative to brewed tea in various applications.
Key Stakeholders
- Tea Extract Manufacturers
- Tea Growers and Plantation Owners
- Raw Material Suppliers
- Tea Processing Companies
- Extraction Technology and Equipment Providers
- Food and Beverage Manufacturers
- Pharmaceutical and Dietary Supplement Manufacturers
- Cosmetics and Personal Care Product Manufacturers
- Distributors and Ingredient Suppliers
- Retailers and E-commerce Companies
- Regulatory Authorities and Certification Agencies
- Research Institutions and Laboratories
- End Consumers
-
Associations and industry bodies:
- Tea Association of the USA
- Tea & Herbal Association of Canada
- UK Tea & Infusions Association
- Tea Board of India
- China Tea Marketing Association
- Sri Lanka Tea Board
- Kenya Tea Board
- FAO Intergovernmental Group on Tea
- European Tea Committee
- German Tea Association (Deutscher Tee & Kräutertee Verband)
- Japan Tea Association
- International Tea Committee
- Tea Research Association (India)
- Ethical Tea Partnership
- Rainforest Alliance
Report Objectives
- To determine and project the size of the tea extract market based on the source (green tea, black tea, oolong tea, other tea sources), category, application, form, and region, over five years, ranging from 2026 to 2031
- To identify the attractive opportunities in the market by determining the largest and fastest-growing segments across regions
- To provide detailed information about the key factors influencing market growth (drivers, restraints, opportunities, and challenges)
- To analyze the opportunities in the market for stakeholders and provide details of the competitive landscape for market leaders
- To analyze the micro markets with respect to individual growth trends, prospects, and their contribution to the total market
- To identify and profile the key players in the market
- To understand the competitive landscape and identify the major growth strategies adopted by players across the key regions
Customization Options
Based on the provided market data, MarketsandMarkets offers customizations to meet company-specific scientific needs. The following customization options are available for the report:
Product Analysis
- Product matrix, which gives a detailed comparison of the product portfolio of each company.
Geographic Analysis
With the given market data, MarketsandMarkets offers customizations according to company-specific.
- Further breakdown of the Rest of Europe tea extract market into key countries
- Further breakdown of the Rest of Asia Pacific tea extract market into key countries
- Further breakdown of the Rest of South America tea extract market into key countries
Company Information
- Detailed analyses and profiling of additional market players (up to five)
Get the Full Tea Extract Market Report
Full forecast, segment splits, and company analysis for all Tea Extract Market.
- China Tea Extract Market
- India Tea Extract Market
- Japan Tea Extract Market
- Canada Tea Extract Market
- Mexico Tea Extract Market
- US Tea Extract Market
- Germany Tea Extract Market
- UK Tea Extract Market
- France Tea Extract Market
- Spain Tea Extract Market
- Italy Tea Extract Market
- Brazil Tea Extract Market
- Argentina Tea Extract Market
- Rest Of Europe Tea Extract Market
- Rest Of Asia Pacific Tea Extract Market
Need a Tailored Report?
Customize this report to your needs
Get 10% FREE Customization
Customize This Report