
Italy Wearables in Pharma & Biotech Market (2026-2031)

The Italy Wearables in Pharma & Biotech Market was valued at $100.6 Million in 2026 and projected to reach to $249.4 Million by 2031, representing a compound annual growth rate of 19.9%. Italy's wearables in pharma and biotech sector is poised for substantial growth, driven by increasing healthcare digitalization, aging population demographics, and regulatory support for remote patient monitoring solutions.


| Market Size in | USD 26.32 MN |
| Market Forecast in | |
| CAGR | |
| Forecast Period | |
| Units Considered | Value (USD MN) |
Italy Wearables in Pharma & Biotech Market Trends and Insights
- This growth trajectory reflects Italy's increasing adoption of digital health technologies and remote patient monitoring solutions across the healthcare sector.
- Italy's pharmaceutical and biotech industries are leveraging wearable devices to enhance clinical trials, improve patient compliance, and enable real-world evidence collection. The Italian market is driven by rising healthcare expenditure, aging demographics, and regulatory support for digital health innovation.
- Italy's position within the European healthcare ecosystem positions it as a key adopter of wearable technologies for chronic disease management and preventive care.
- Between 2026 and 2031, Italy is expected to see accelerated integration of wearables in drug development pipelines and post-market surveillance programs. Italy's competitive landscape includes both multinational medtech firms and emerging local innovators focused on connected health solutions.
- The country's strong pharmaceutical manufacturing base and research institutions provide a foundation for sustained market growth through 2031..
Key Market Statistics
- CAGR (2026-2031) 19.9% CAGR
- Market Size, 2026 ~USD 100.6 Million
- Forecast, 2031 ~USD 249.4 Million
- Country Italy
Italy Wearables in Pharma & Biotech Market Overview
Strong Market Valuation :
Italy's wearables in pharma and biotech market is valued at USD 100.6 million in 2026, demonstrating significant investment and adoption of digital health technologies across the Italian healthcare ecosystem.
Robust Growth Trajectory :
With a CAGR of 19.9% from 2026 to 2031, Italy's market is expanding faster than many European counterparts, driven by increased healthcare digitalization and remote patient monitoring initiatives.
Projected Market Expansion :
The market is forecasted to reach USD 249.4 million by 2031, representing a 148% increase over the five-year period and reflecting growing confidence in wearable technology adoption among Italian healthcare providers.
Digital Health Integration :
Italian pharmaceutical and biotech companies are actively integrating wearable devices into clinical trials and patient management programs, positioning Italy as a key hub for digital health innovation in Southern Europe.
Italy Wearables in Pharma & Biotech Market Dynamics
- Italian healthcare institutions are progressively adopting wearable technologies to enhance clinical outcomes and reduce healthcare costs, creating opportunities for both established and emerging market players. The convergence of Italy's strong pharmaceutical manufacturing base with advancing digital health infrastructure positions the country as a strategic market for wearable innovation.
- Government initiatives promoting digital health adoption, combined with growing patient acceptance of remote monitoring devices, are expected to accelerate market penetration across therapeutic areas including cardiology, diabetes management, and chronic disease monitoring through 2031..
Market Ecosystem
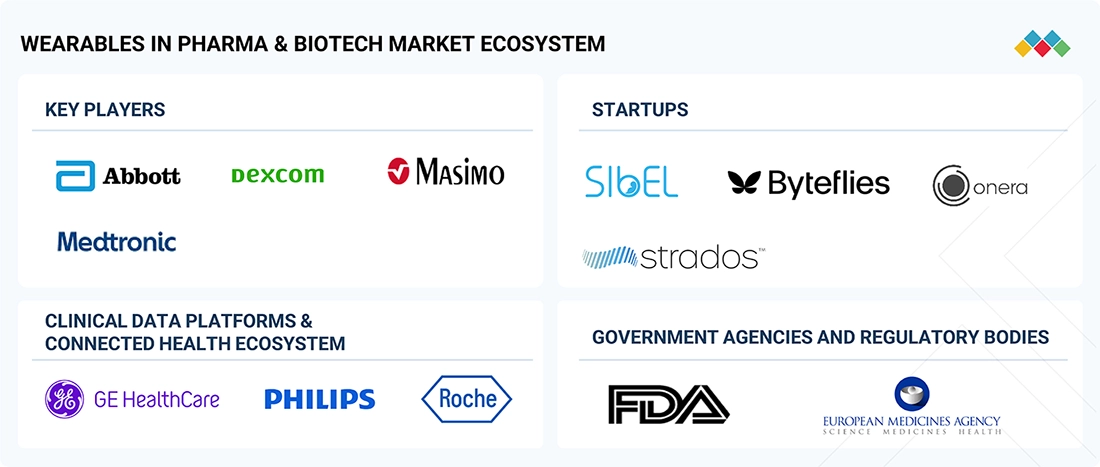
WEARABLES IN PHARMA & BIOTECH MARKET: COMMERCIAL USE CASES ACROSS INDUSTRIES
| COMPANY | USE CASE DESCRIPTION | BENEFITS |
|---|---|---|
 |
Integration of wearables in clinical trials for continuous monitoring of physiological parameters | Improves endpoint accuracy, reduces site visits, enables decentralized trials |
 |
Continuous glucose monitoring for diabetes management and research | Provides real-time glucose data, improves glycemic control, supports clinical studies |
 |
Deployment of CGMs for remote monitoring and therapeutic evaluation | Enables continuous monitoring, reduces invasive testing, supports long-term disease management |
 |
Continuous monitoring of oxygen saturation and vital signs via wearables | Improves patient safety, enables early intervention |
 |
Use of wearable-enabled platforms for real-world data collection in drug development | Enhances real-world evidence generation and patient-centric trial design |
Logos and trademarks shown above are the property of their respective owners. Their use here is for informational and illustrative purposes only.
Related Ecosystem
Healthcare It
- Computed Tomography (CT)
- Machine Learning
- Magnetic Resonance Imaging (MRI)
- Natural Language Processing (NLP)
- Predictive Analytics
- CERNER CORPORATION
- PHILIPS HEALTHCARE
- Oracle Corporation
- GE HealthCare Technologies Inc.
- Siemens healthineers
Key Takeaways
- Italy's wearables in pharma & biotech market will grow from USD 100.6M (2026) to USD 249.4M (2031) at a 19.9% CAGR.
- Italy is leveraging wearables for clinical trial optimization, patient monitoring, and real-world evidence generation.
- Italy's aging population and healthcare infrastructure investments are primary drivers of wearable adoption in pharma.
- Italy's regulatory environment and EU digital health directives support accelerated market expansion through 2031.
Wearables in Pharma & Biotech Market Report Scope
| Report Metric | Details |
|---|---|
| Base Year | 2026 |
| Fastest Growing Segment | MENTAL HEALTH & BEHAVIORAL HEALTH (Therapeutic Area) |
| Forecast Period | 2026–2031 |
| Growth Rate | CAGR of 20.2% from 2026 to 2031 |
| Largest Segment | PHARMACEUTICAL & BIOTECH COMPANIES (End User) |
| Market Size Base Year (Billions) | ~USD 3.97 (2026) |
| Revenue Forecast (Billions) | ~USD 9.97 (2031) |
| Segments Covered | Product, Therapeutic Area, Type, Application, End User |
Italy Wearables in Pharma & Biotech Market Report Segmentation
5 segment dimensions are covered across the global market.
By Product
- Continuous Glucose Monitors
- Fitness Bands
- Other Products
- Patches
- Smart Rings
- Smartwatches
- Wearable Injectors
By Therapeutic Area
- Cardiovascular
- Diabetes
- Lifestyle & Wellness Improvement
- Mental Health & Behavioral Health
- Musculoskeletal Disorders/Pain Management
- Neurology
- Oncology
- Other Diseases
- Respiratory Disorders
- Women’S Health & Reproductive Health
By Type
- Atherosclerotic Cardiovascular Diseases/Secondary Prevention
- Atrial Fibrillation/Stroke Prevention
- Brain Tumor
- Breast Cancer
- Colorectal Cancer
- Heart Failure
- Hematologic Malignancies
- Hypertension
- Leukemia
- Lung Cancer
- Lymphoma
- Multiple Myeloma
- Other Hematologic Malignancies
- Other Solid Tumors
- Phase Ii
- Phase Iii
- Phase Iv
- Prostate Cancer
- Pulmonary Hypertension
- Solid Tumors
- Structural Heart Diseases/Interventional Cardiology
By Application
- Chronic Disease Monitoring
- Clinical Trials
- Drug Discovery
- Medication Adherence & Behavioral Support
- Personalized & Preventive Digital Therapeutics
By End User
- Contract Research Organizations
- Healthcare Providers & Clinicians
- Other End Users
- Pharmaceutical & Biotech Companies
ITALY: WEARABLES IN PHARMA & BIOTECH MARKET, BY END USER, 2024–2031
| Segment | 2024 | 2025 | 2026 | 2027 | 2028 | 2029 | 2030 | 2031 | CAGR (%) |
|---|---|---|---|---|---|---|---|---|---|
| CONTRACT RESEARCH ORGANIZATIONS | 23.3 | 27.7 | 33.1 | 39.7 | 47.9 | 58 | 70.5 | 85.8 | 21 |
| HEALTHCARE PROVIDERS & CLINICIANS | 8.1 | 9.5 | 11.1 | 13.1 | 15.5 | 18.5 | 22 | 26.3 | 18.8 |
| OTHER END USERS | 5.1 | 5.9 | 6.9 | 8.1 | 9.5 | 11.2 | 13.3 | 15.7 | 18 |
| PHARMACEUTICAL & BIOTECH COMPANIES | 35.6 | 41.8 | 49.5 | 58.8 | 70.2 | 84 | 100.9 | 121.5 | 19.7 |
| TOTAL | 72 | 84.8 | 100.6 | 119.7 | 143.2 | 171.7 | 206.7 | 249.4 | 19.9 |
Target Audience
- Pharmaceutical Companies : Italian and international pharma firms need Italy-specific wearable market data to develop localized digital health strategies, optimize clinical trial designs, and identify partnership opportunities within Italy's healthcare ecosystem.
- Biotech Enterprises : Biotech companies require detailed Italy market insights to assess commercial viability of wearable-integrated therapeutics, understand regulatory pathways, and plan market entry strategies for Italian healthcare providers.
- Medical Device Manufacturers : Wearable device manufacturers need Italy-focused market analysis to evaluate demand, competitive positioning, reimbursement landscapes, and distribution channel strategies specific to the Italian healthcare market.
- Healthcare Investors : Private equity, venture capital, and strategic investors require Italy market data to evaluate investment opportunities in digital health startups, assess portfolio company growth potential, and identify acquisition targets.
- Healthcare Consultants : Management consulting firms and healthcare advisors need Italy-specific wearable market intelligence to support client strategy development, market entry planning, and competitive positioning recommendations.
Reasons to Buy this Report
- Italy-Specific Market Sizing : Obtain precise market valuation data exclusive to Italy, including 2026 baseline (USD 100.6M) and 2031 projections (USD 249.4M), enabling accurate financial forecasting and investment planning for the Italian market.
- Competitive Landscape Intelligence : Gain detailed insights into Italy's wearable pharma and biotech competitive dynamics, including key players, market share distribution, and strategic positioning specific to the Italian healthcare environment.
- Growth Driver Analysis : Understand Italy-specific growth catalysts including regulatory frameworks, healthcare system adoption rates, reimbursement policies, and technological infrastructure that differentiate the Italian market from broader European trends.
- Investment Decision Support : Make informed investment and expansion decisions with Italy-focused market data, including segment breakdowns, regional adoption patterns, and opportunity identification for market entry or portfolio expansion.
- Strategic Partnership Opportunities : Identify collaboration and partnership opportunities with Italian pharmaceutical companies, biotech firms, and healthcare institutions leveraging wearable technologies for clinical applications and patient management.
Frequently asked questions
What is the current market size of wearables in pharma & biotech in Italy?
Italy's wearables in pharma and biotech market was valued at USD 100.6 million in 2026 and is projected to grow to USD 249.4 million by 2031.
What is the expected growth rate for Italy's wearables market through 2031?
Italy's market is expected to grow at a compound annual growth rate (CAGR) of 19.9% from 2026 to 2031.
Which applications are driving wearable adoption in Italy's pharma sector?
Italy's pharmaceutical industry is adopting wearables primarily for clinical trial management, remote patient monitoring, chronic disease management, and real-world evidence collection.
What factors are accelerating wearable adoption in Italy's healthcare market?
Key drivers in Italy include an aging population, increased healthcare spending, EU digital health regulations, and growing demand for remote monitoring solutions.
How does Italy's market compare to broader European trends?
Italy's 19.9% CAGR aligns closely with European market dynamics, reflecting strong regional adoption of digital health technologies and wearable-enabled clinical solutions.
RESEARCH METHODOLOGY
This study involved five major activities to estimate the current size of the wearables in pharma & biotech market. Exhaustive secondary research was conducted to collect information on the market and its different subsegments. The next step was to validate these findings, assumptions, and sizing with industry experts across the value chain through primary research. Both top-down and bottom-up approaches were employed to estimate the complete market size. Thereafter, market breakdown and data triangulation procedures were used to estimate the market size of the segments and subsegments.
Secondary Research
In the secondary research process, various secondary sources such as annual reports, press releases & investor presentations of companies, white papers, certified publications, articles by recognized authors, gold-standard & silver-standard websites, regulatory bodies, and databases (such as D&B Hoovers, Bloomberg Business, and Factiva) were referred to to identify and collect information for the study of the wearables in pharma & biotech market. It was also used to obtain important information about the top players, market classification, and segmentation according to industry trends to the bottom-most level, geographic markets, and key developments related to the market. A database of the key industry leaders was also prepared using secondary research.
Primary Research
Extensive primary research was conducted after acquiring basic knowledge about the global wearables in pharma & biotech market scenario through secondary research. Several primary interviews were conducted with market experts from both the demand side (hospital directors, hospital vice presidents, department heads, and critical care specialists) and supply side (such as C-level and D-level executives, technology experts, product managers, marketing and sales managers, among others) across five major regions: North America, Europe, Asia Pacific, Latin America, the Middle East & Africa. This primary data was collected through questionnaires, e-mails, online surveys, personal interviews, and telephonic interviews.
The following is a breakdown of the primary respondents:
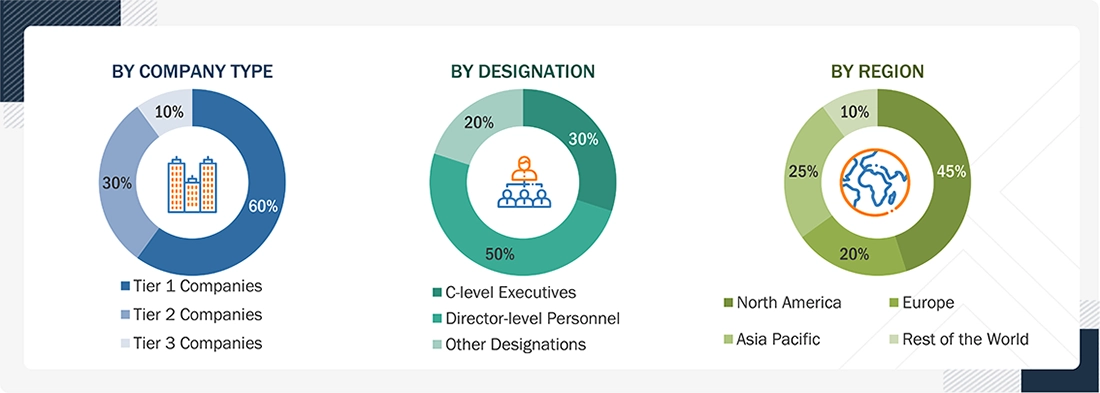
Note: Tiers of companies are defined based on their total revenues in 2023. Tier 1 = >USD 1 billion, Tier 2 = USD 500 million to USD 1 billion, and Tier 3 = USD 500 million. Other designations include sales managers, marketing managers, and product managers.
To know about the assumptions considered for the study, download the pdf brochure
Market Size Estimation
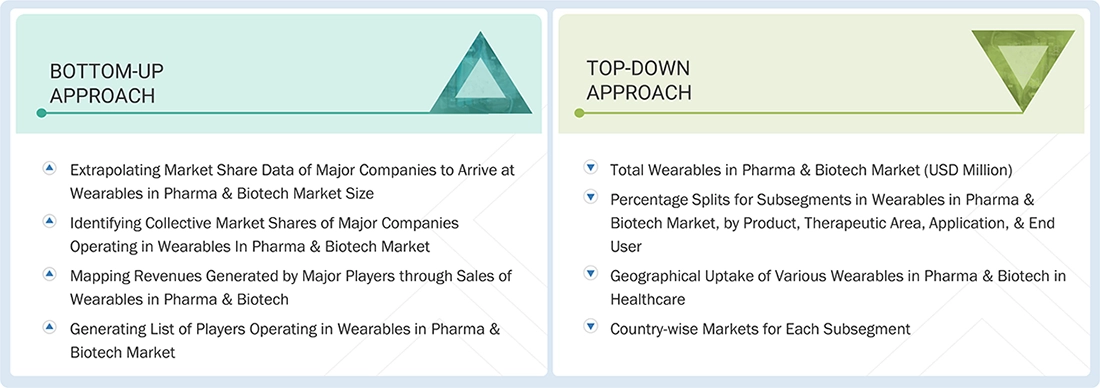
Both top-down and bottom-up approaches were used to estimate and validate the total size of the wearables in pharma & biotech market. These methods were also used extensively to estimate the size of various subsegments in the market.
The research methodology used to estimate the market size includes the following:
Wearables in Pharma & Biotech Market : Top-Down and Bottom-Up Approach
Data Triangulation
After arriving at the overall market size using the market size estimation processes, the market was split into several segments and subsegments. To complete the overall market engineering process and arrive at the exact statistics of each market segment and sub-segment, data triangulation and market breakdown procedures were employed, wherever applicable. The data was triangulated by studying various factors and trends from both the demand and supply sides in the wearables in pharma & biotech market.
Market Definition
The wearables in pharma & biotech market comprise sensor-based, body-worn, or minimally invasive devices and associated digital platforms used to capture continuous physiological and behavioral data across the drug development and healthcare continuum. This includes products such as smartwatches, fitness bands, smart rings, continuous glucose monitors (CGMs), wearable patches, and wearable injectors, which enable real-time monitoring of parameters like heart rate, glucose levels, activity, and treatment adherence. These technologies are applied across a wide range of therapeutic areas, including cardiovascular diseases, oncology (solid tumors and hematologic malignancies), diabetes, mental health, respiratory, neurological, musculoskeletal, and women’s health conditions. The market spans key applications, such as drug discovery, clinical trials (Phase II–IV), medication adherence, chronic disease monitoring, and personalized digital therapeutics, supporting decentralized trials and real-world evidence generation. End users primarily include pharmaceutical and biotechnology companies, healthcare providers, and research organizations, all leveraging wearable technologies to enable data-driven, patient-centric care and more efficient drug development.
Key Stakeholders
- Wearable device & biosensor manufacturers (smartwatches, CGMs, patches, smart rings, wearable injectors)
- Digital health & software platform providers (mobile apps, cloud platforms, AI analytics)
- Component, sensor, & semiconductor technology providers
- Pharmaceutical companies
- Biotechnology companies
- Contract research organizations (CROs)
- Clinical trial sponsors & site management organizations
- Healthcare providers (hospitals, clinics, remote patient monitoring programs)
- Patients & caregivers
- Payers & insurers
- Regulatory & public health authorities (e.g., US Food and Drug Administration, European Medicines Agency)
- Academic institutions & research organizations
- Data management, interoperability & cloud infrastructure providers
- Cybersecurity & data privacy solution providers
- System integrators & IT service providers
- Venture capital & private equity firms
- Investors & financial institutions
- Consulting, regulatory, & compliance service providers
Report Objectives
- To define, describe, and forecast the wearables in pharma & biotech market based on product, therapeutic area, application, end user, and region
- To provide detailed information regarding the major factors (such as drivers, restraints, opportunities, and challenges) influencing market growth
- To strategically analyze micro-markets with respect to individual growth trends, prospects, and contributions to the overall market
- To analyze opportunities in the market for stakeholders and provide details of the competitive landscape for market leaders
- To strategically analyze the market structure profile of the key players and comprehensively analyze their core competencies
- To forecast the size of the market segments with respect to five regions: North America, Europe, Asia Pacific, Latin America, and the Middle East & Africa
- To track and analyze competitive developments such as product launches and enhancements, investments, partnerships, collaborations, acquisitions, expansions, product approvals, and alliances in the market
Customization Options:
With the given market data, MarketsandMarkets offers customizations as per the company’s specific needs. The following customization options are available for the report:
Product Analysis
- Product matrix, which gives a detailed comparison of the product portfolios of each company.
Geographic Analysis
- Further breakdown of the Latin America, Europe, and the Middle East & Africa markets into specific countries
Get the Full Wearables in Pharma & Biotech Market Report
Full forecast, segment splits, and company analysis for all Wearables in Pharma & Biotech Market.
- US Wearables in Pharma & Biotech Market
- Canada Wearables in Pharma & Biotech Market
- Germany Wearables in Pharma & Biotech Market
- France Wearables in Pharma & Biotech Market
- UK Wearables in Pharma & Biotech Market
- Spain Wearables in Pharma & Biotech Market
- China Wearables in Pharma & Biotech Market
- Japan Wearables in Pharma & Biotech Market
- India Wearables in Pharma & Biotech Market
- Australia Wearables in Pharma & Biotech Market
- South Korea Wearables in Pharma & Biotech Market
- Brazil Wearables in Pharma & Biotech Market
- Mexico Wearables in Pharma & Biotech Market
- Saudi Arabia Wearables in Pharma & Biotech Market
- UAE Wearables in Pharma & Biotech Market
- South Africa Wearables in Pharma & Biotech Market
Need a Tailored Report?
Customize this report to your needs
Get 10% FREE Customization
Customize This Report
