Hematology Analyzers and Reagents Market

Hematology Analyzers and Reagents Market by Products & Services [Hematology Analyzers (5 Parts, 6 Parts, 3 Part, PoC, Semi-Automated), Hemostasis, Immunohematology], Price Range (High, Low), End User (Government Labs) & Region - Global Forecast to 2025

Report Code: MD 2479 May, 2020, by marketsandmarkets.com

Inquire Now to get the global numbers on Hematology Analyzers Market

The global hematology analyzers market in terms of revenue was estimated to be worth $7.6 billion in 2020 and is poised to reach $10.6 billion by 2025, growing at a CAGR of 6.9% from 2020 to 2025.The new research study consists of an industry trend analysis of the market. The new research study consists of industry trends, pricing analysis, patent analysis, conference and webinar materials, key stakeholders, and buying behaviour in the market. Market growth is largely driven by factors such as the growth in the number of blood donations, increasing incidence of blood disorders, and technological advancements in hematology analyzers and reagents.

Hematology Analyzers and Reagents Market

The hematology products & services segment accounted for the largest share of the global hematology analyzers industry.

Based on products & services, the market is classified into hematology, hemostasis, and immunohematology products & services. The hematology products & services segment accounted for the largest market share in 2019. This can be attributed to the increasing adoption of POC testing hematology analyzers in emerging economies, the launch of technologically advanced hematology products, the increasing preference for automation, and the availability of a wide range of services from major hematology providers.  

The low-end hematology analyzers segment accounted for the largest share of the global hematology analyzers industry, by price range.

By price range, the market is classified into high-end, mid-range, and low-end hematology analyzers. The low-end hematology analyzers segment accounted for the largest share of the global hematology instruments market in 2019.

The commercial service providers segment accounted for the largest share of the hematology analyzers industry, by end user.

On the basis of end user, the market is segmented into hospital laboratories, commercial service providers, government reference laboratories, and research & academic institutes. In 2019, the commercial service providers segment accounted for the largest share of the market owing to the increasing incidence of leukemia and anemia, shift from manual testing to automated testing, and the competitive benefits offered by these providers as compared to hospitals (such as affordable service costs, efficient turnaround time, and efficient management for sample collection).

Hematology Analyzers and Reagents Market

North America commanded the largest share of the hematology analyzers industry, by region.

North America commanded the largest share of the market in 2019, owing to factors such as rising incidence of patients suffering from blood disorders, growing prevalence of target diseases, and rising demand for blood transfusions in the region.

The major players of the market are Sysmex Corporation (Japan), Danaher Corporation (US), Nihon Kohden (Japan), Siemens (Germany), Abbott (US), Boule Diagnostics (Sweden), HORIBA (Japan), Bio-Rad Laboratories (US), BioSystems (Spain), Diatron (Hungary), Drew Scientific (US), EKF Diagnostics (UK), Mindray (China), Ortho Clinical Diagnostics (US), and Roche (Switzerland), among others. An analysis of the market developments between 2016 and 2019 revealed that product launches & enhancements, partnerships, agreements, and acquisitions were adopted by market players to strengthen their product portfolios and maintain a competitive position in the market. Product launches were the most widely adopted growth strategies.

Sysmex (Japan) held the leading position in the global hematology analyzers market. The company is an integrated supplier of instruments and reagents in the field of diagnostics. It focuses on both organic and inorganic growth methods such as expansions, agreements, and new product launches to ensure its growth in the market. In line with this, over the last three years, the company launched XN-9100, XN-3100, XN-1500, XN-L, and SP-50 (an automated hematology slide preparation unit). Additionally, the company has improved its sales and support networks in emerging markets, due to which it maintains its leading position in the global market. Therefore, the heavy investments in developing better and technologically superior products are fueling the company’s market growth in the industry.

Scope of the Hematology Analyzers Industry:

Report Metric

Details

Market Revenue in 2020

$7.6.billion

Estimated Value by 2025

$10.6 billion

Revenue Rate

Poised to grow at a CAGR of 6.9%

Market Driver

Forthcoming technological innovations

Market Opportunity

Emerging economies

This report categorizes the global hematology analyzers market to forecast revenue and analyze trends in each of the following submarkets :

By Product & Service

  • Hematology Products & Services
    • Instruments
      • 5-part and 6-part Fully Automated Hematology Analyzers
      • 3-part Fully Automated Hematology Analyzers
      • Point-of-care Testing Hematology Analyzers
      • Semi-automated Hematology Analyzers
    • Reagents & Consumables
      • Hematology Reagents
      • Slide Stainers/Makers
      • Controls and Calibrators
      • Consumables
    • Services
      • Hemostasis Products & Services
    • Instruments
    • Reagents & Consumables
    • Services
      • Immunohematology Products & Services
    • Instruments
    • Reagents & Consumables
    • Services

By Price range

  • High-end Hematology Analyzers
  • Mid-range Hematology Analyzers
  • Low-end Hematology Analyzers

By End User

  • Hospital Laboratories
  • Commercial Service Providers
  • Government Reference Laboratories
  • Research & Academic Institutes

By Region

  • North America
    • US
    • Canada
  • Europe
    • Germany
    • France
    • UK
    • Rest of Europe (RoE)
  • Asia Pacific
    • Japan
    • China
    • India
    • Rest of Asia Pacific (RoAPAC)
  • Latin America
    • Brazil
    • Mexico
    • Rest of Latin America (RoLATAM)
  • Middle East & Africa

Recent Developments of Hematology Analyzers Industry:

  • In February 2018, Sysmex entered into an agreement with McKesson to distribute Sysmex’s XW-100 automated hematology analyzers in the US.
  • In September 2017, Sysmex entered into an agreement with Mongolia’s Ministry of Health to provide technological, scientific, and external quality assessment support in the field of blood morphology to raise the accuracy of testing in the Mongolian region.
  • Sysmex expanded its direct sales network in the Republic of Ghana (Africa) to reinforce its hematology sales and service structure in the African market.
  • In July 2017, Sysmex launched XN-9100, XN-3100, XN-1500, and SP-50 (an automated hematology slide preparation unit).
  • In July 2017, Sysmex launched the XN-L automated hematology analyzers in the US.
  • In November 2016, Sysmex entered into an agreement with the National Health Laboratory to conduct scientific support activities to enhance the quality of clinical testing, including hematology-related tests.
  • In May 2016, Sysmex Asia Pacific (Singapore) opened a branch in Yangon, Myanmar, to enhance after-sales support and customer services in Myanmar.

Frequently Asked Questions (FAQ):

To speak to our analyst for a discussion on the above findings, click Speak to Analyst

TABLE OF CONTENTS

1 INTRODUCTION (Page No. - 21)
    1.1 OBJECTIVES OF THE STUDY
    1.2 MARKET DEFINITION
    1.3 MARKET SCOPE
           1.3.1 YEARS CONSIDERED FOR THE STUDY
    1.4 CURRENCY USED FOR THE STUDY
    1.5 MAJOR MARKET STAKEHOLDERS

2 RESEARCH METHODOLOGY (Page No. - 24)
    2.1 RESEARCH DATA
           2.1.1 SECONDARY DATA
                    2.1.1.1 Secondary sources
           2.1.2 PRIMARY DATA
    2.2 MARKET ESTIMATION METHODOLOGY
           2.2.1 REVENUE MAPPING-BASED MARKET ESTIMATION
           2.2.2 PROCEDURE-BASED MARKET ESTIMATION
           2.2.3 PRIMARY RESEARCH VALIDATION
    2.3 DATA TRIANGULATION
    2.4 RESEARCH ASSUMPTIONS
    2.5 RESEARCH LIMITATIONS

3 EXECUTIVE SUMMARY (Page No. - 34)

4 PREMIUM INSIGHTS (Page No. - 39)
    4.1 HEMATOLOGY ANALYZERS MARKET OVERVIEW
    4.2 GLOBAL HEMATOLOGY ANALYZERS INDUSTRY, BY PRODUCT & SERVICE
    4.3 GLOBAL HEMATOLOGY ANALYZERS INDUSTRY, BY END USER
    4.4 GEOGRAPHIC SNAPSHOT OF THE GLOBAL MARKET

5 HEMATOLOGY ANALYZERS MARKET, BY PRODUCT & SERVICE (Page No. - 41)
    5.1 INTRODUCTION
    5.2 HEMATOLOGY PRODUCTS & SERVICES
           5.2.1 REAGENTS & CONSUMABLES
                    5.2.1.1 Hematology reagents
                               5.2.1.1.1 Growing preference for reagent rental business models to boost the adoption of hematology reagents
                    5.2.1.2 Consumables
                               5.2.1.2.1 Consumables are reusable, inexpensive, and required in limited quantities; supporting their adoption
                    5.2.1.3 Controls & calibrators
                               5.2.1.3.1 Controls & calibrators offer the highest quality of lab results, have long-term stability, and are convenient to use
                    5.2.1.4 Slide stainers/makers
                               5.2.1.4.1 Automated slide stainers/makers help laboratories provide cost-efficient, reliable, and uniform staining results
           5.2.2 INSTRUMENTS
                    5.2.2.1 5-part and 6-part fully automated hematology analyzers
                               5.2.2.1.1 Growing preference for 5-part and 6-part hematology analyzers due to their advantages to drive market growth
                    5.2.2.2 3-part fully automated hematology analyzers
                               5.2.2.2.1 3-part analyzers offer reduced maintenance costs, making them ideal cost-effective solutions for developing countries
                    5.2.2.3 Point-of-care testing hematology analyzers
                               5.2.2.3.1 Rising inclination towards home testing of blood levels will lead to market growth
                    5.2.2.4 Semi-automated hematology analyzers
                               5.2.2.4.1 Need for manual interruption will limit the adoption of these products
           5.2.3 SERVICES
                    5.2.3.1 High adoption of hematology diagnostic techniques will aid market growth
    5.3 HEMOSTASIS PRODUCTS & SERVICES
           5.3.1 REAGENTS & CONSUMABLES
                    5.3.1.1 Rising prevalence of coagulation disorders to support growth
           5.3.2 INSTRUMENTS
                    5.3.2.1 Hemostasis instruments offer outstanding productivity while reducing complexities and increasing output
           5.3.3 SERVICES
                    5.3.3.1 Advancements in hemostasis diagnostic techniques will accelerate market growth
    5.4 IMMUNOHEMATOLOGY PRODUCTS & SERVICES
           5.4.1 REAGENTS & CONSUMABLES
                    5.4.1.1 Development of novel immunohematology reagents is supporting market growth
           5.4.2 INSTRUMENTS
                    5.4.2.1 Growing automation in immunohematology labs to boost market growth
           5.4.3 SERVICES
                    5.4.3.1 services enable customer-focused care—a key factor driving market growth

6 HEMATOLOGY ANALYZERS MARKET, BY PRICE RANGE (Page No. - 73)
    6.1 INTRODUCTION
    6.2 LOW-END HEMATOLOGY ANALYZERS
           6.2.1 LOWER THROUGHPUT RATES AND REDUCED ACCURACY WILL HAMPER THE MARKET GROWTH IN THIS SEGMENT
    6.3 HIGH-END HEMATOLOGY ANALYZERS
           6.3.1 HIGH-END ANALYZERS OFFER ADVANTAGES SUCH AS RELIABILITY, HIGH ACCURACY, FLEXIBILITY, AND EASE OF USE
    6.4 MID-RANGE HEMATOLOGY ANALYZERS
           6.4.1 LOWER COST OF MID-RANGE HEMATOLOGY ANALYZERS IN COMPARISON WITH HIGH-END ANALYZERS—A KEY GROWTH DRIVER

7 HEMATOLOGY ANALYZERS MARKET, BY APPLICATION (Page No. - 78)
    7.1 INTRODUCTION
    7.2 HEMORRHAGIC CONDITIONS
           7.2.1 INCREASE IN HEMORRHAGIC CASES TO SUPPORT THE ADOPTION OF HEMATOLOGY INSTRUMENTS
    7.3 INFECTION-RELATED CONDITIONS
           7.3.1 GROWING BURDEN OF INFECTIOUS DISEASES TO SUPPORT THE ADOPTION OF HEMATOLOGY INSTRUMENTS
    7.4 IMMUNE SYSTEM-RELATED CONDITIONS
           7.4.1 RISING USE IN POINT-OF-CARE APPLICATIONS IS LIKELY TO AID THE ADOPTION OF HEMATOLOGY ANALYZERS & REAGENTS
    7.5 BLOOD CANCER
           7.5.1 HEMATOLOGY ANALYZERS ARE KEY INSTRUMENTS USED FOR THE DETERMINATION OF HEMATOLOGICAL MALIGNANCIES
    7.6 ANEMIA
           7.6.1 GROWING INCIDENCE OF ANEMIA TO SUPPORT THE ADOPTION OF HEMATOLOGY INSTRUMENTS
    7.7 OTHER APPLICATIONS

8 HEMATOLOGY ANALYZERS MARKET, BY USAGE TYPE (Page No. - 85)
    8.1 INTRODUCTION
    8.2 STANDALONE ANALYZERS
           8.2.1 INCREASED USE OF STANDALONE ANALYZERS IN HOSPITALS AND REFERENCE LABS TO DRIVE MARKET GROWTH
    8.3 POINT-OF-CARE ANALYZERS
           8.3.1 SMALL SAMPLE REQUIREMENT LEADING TO INCREASED PREFERENCE FOR POC ANALYZERS AMONG END USERS

9 HEMATOLOGY ANALYZERS MARKET, BY END USER (Page No. - 89)
    9.1 INTRODUCTION
    9.2 COMMERCIAL SERVICE PROVIDERS
           9.2.1 GROWING OUTSOURCING WILL INCREASE THE MARKET GROWTH IN THIS SEGMENT
    9.3 HOSPITAL LABORATORIES
           9.3.1 HIGH PREVALENCE OF BLOOD-RELATED DISORDERS WILL RESULT IN HIGH MARKET GROWTH
    9.4 GOVERNMENT REFERENCE LABORATORIES
           9.4.1 AFFORDABILITY AND PROVISION OF FREE SERVICES ARE LIKELY TO PROPEL THE GROWTH OF THIS END-USER SEGMENT
    9.5 RESEARCH & ACADEMIC INSTITUTES
           9.5.1 INCREASING NUMBER OF DRUG DISCOVERY AND RESEARCH ACTIVITIES TO SUPPORT MARKET GROWTH

10 HEMATOLOGY ANALYZERS MARKET, BY REGION (Page No. - 94)
     10.1 INTRODUCTION
     10.2 NORTH AMERICA
             10.2.1 US
                        10.2.1.1 Favorable research scenario will drive market growth in the US
             10.2.2 CANADA
                        10.2.2.1 Rising demand for blood and blood components to support market growth
     10.3 EUROPE
             10.3.1 GERMANY
                        10.3.1.1 Increasing number of anemic patients is a major factor driving the growth of the hematology analyzers and reagents market in Germany
             10.3.2 UK
                        10.3.2.1 Government support to develop innovative diagnostic technologies contributing to market growth
             10.3.3 FRANCE
                        10.3.3.1 Presence of proper protocols and guidelines in diagnostics to propel market growth in the coming years
             10.3.4 ITALY
                        10.3.4.1 Increasing preference for hematology testing during transplantation will result in market growth
             10.3.5 SPAIN
                        10.3.5.1 Consolidation of laboratories in Spain will drive market growth
             10.3.6 REST OF EUROPE
     10.4 ASIA PACIFIC
             10.4.1 CHINA
                        10.4.1.1 Government initiatives and improving healthcare infrastructure to aid growth 124
             10.4.2 JAPAN
                        10.4.2.1 Rising prevalence of flu in Japan in recent years is contributing to market growth
             10.4.3 INDIA
                        10.4.3.1 High burden of chronic diseases to support market growth
             10.4.4 AUSTRALIA
                        10.4.4.1 Rising prevalence of celiac disease to support the use of hematology analyzers and reagents
             10.4.5 SOUTH KOREA
                        10.4.5.1 Rising healthcare spending will support market growth
             10.4.6 REST OF ASIA PACIFIC
     10.5 LATIN AMERICA
             10.5.1 BRAZIL
                        10.5.1.1 Investments by leading hematology analyzer and reagent manufacturers in the country to drive market growth
             10.5.2 MEXICO
                        10.5.2.1 Rising prevalence of diabetes and cancer to support market growth in Mexico
             10.5.3 REST OF LATAM
     10.6 MIDDLE EAST & AFRICA
             10.6.1 MEA WILL HOLD A SMALLER SHARE AND GROW AT A LOWER RATE THAN THE MAJOR REGIONAL MARKETS

11 COMPETITIVE LANDSCAPE (Page No. - 148)
     11.1 OVERVIEW
     11.2 MARKET SHARE ANALYSIS
     11.3 COMPETITIVE SCENARIO
             11.3.1 PRODUCT LAUNCHES & APPROVALS
             11.3.2 PARTNERSHIPS & COLLABORATIONS
             11.3.3 MERGERS & ACQUISITIONS
             11.3.4 MARKET EXPANSIONS
     11.4 COMPETITIVE LEADERSHIP MAPPING
             11.4.1 VISIONARY LEADERS
             11.4.2 INNOVATORS
             11.4.3 DYNAMIC DIFFERENTIATORS
             11.4.4 EMERGING COMPANIES

12 COMPANY PROFILES (Page No. - 154)
     12.1 ROCHE
             12.1.1 BUSINESS OVERVIEW
             12.1.2 RECENT DEVELOPMENTS
     12.2 ABBOTT LABORATORIES
             12.2.1 12.1.1 BUSINESS OVERVIEW
             12.2.2 PRODUCTS OFFERED
             12.2.3 RECENT DEVELOPMENTS
             12.2.4 MNM VIEW
     12.3 DANAHER CORPORATION
             12.3.1 BUSINESS OVERVIEW
             12.3.2 PRODUCTS & SERVICES OFFERED
             12.3.3 RECENT DEVELOPMENTS
             12.3.4 MNM VIEW
     12.4 DIATRON
             12.4.1 BUSINESS OVERVIEW
             12.4.2 PRODUCTS OFFERED
             12.4.3 RECENT DEVELOPMENTS
     12.5 DREW SCIENTIFIC GROUP
             12.5.1 BUSINESS OVERVIEW
             12.5.2 PRODUCTS OFFERED
     12.6 SIEMENS HEALTHINEERS GROUP
             12.6.1 BUSINESS OVERVIEW
             12.6.2 PRODUCTS & SERVICES OFFERED
             12.6.3 RECENT DEVELOPMENTS
     12.7 SYSMEX CORPORATION
             12.7.1 BUSINESS OVERVIEW
             12.7.2 PRODUCTS & SERVICES OFFERED
             12.7.3 RECENT DEVELOPMENTS
             12.7.4 MNM VIEW
     12.8 BIO-RAD LABORATORIES
             12.8.1 BUSINESS OVERVIEW
             12.8.2 PRODUCTS OFFERED
             12.8.3 RECENT DEVELOPMENTS
     12.9 HORIBA
             12.9.1 BUSINESS OVERVIEW
             12.9.2 PRODUCTS OFFERED
             12.9.3 RECENT DEVELOPMENTS
     12.10 NIHON KOHDEN
             12.10.1 BUSINESS OVERVIEW
             12.10.2 PRODUCTS OFFERED
             12.10.3 RECENT DEVELOPMENTS
     12.11 EKF DIAGNOSTICS
             12.11.1 BUSINESS OVERVIEW
             12.11.2 PRODUCTS OFFERED
             12.11.3 RECENT DEVELOPMENTS
     12.12 BOULE DIAGNOSTICS AB
             12.12.1 BUSINESS OVERVIEW
             12.12.2 PRODUCTS OFFERED
             12.12.3 RECENT DEVELOPMENTS
     12.13 MINDRAY
             12.13.1 BUSINESS OVERVIEW
             12.13.2 PRODUCTS OFFERED
             12.13.3 RECENT DEVELOPMENTS
     12.14 BIOSYSTEMS S.A. (A GINPER GROUP COMPANY)
             12.14.1 BUSINESS OVERVIEW
             12.14.2 PRODUCTS OFFERED
     12.15 ORTHO CLINICAL DIAGNOSTICS
             12.15.1 BUSINESS OVERVIEW
             12.15.2 PRODUCTS OFFERED
             12.15.3 RECENT DEVELOPMENTS
     12.16 DRUCKER DIAGNOSTICS
     12.17 VITAL DIAGNOSTICS
     12.18 ACCUREX BIOMEDICAL PVT. LTD.
     12.19 CAROLINA LIQUID CHEMISTRIES
     12.20 NEOMEDICA BIOSCIENCE TECHNOLOGY

13 APPENDIX (Page No. - 196)
     13.1 DISCUSSION GUIDE
     13.2 KNOWLEDGE STORE: MARKETSANDMARKETS’ SUBSCRIPTION PORTAL
     13.3 AVAILABLE CUSTOMIZATIONS
     13.4 RELATED REPORTS
     13.5 AUTHOR DETAILS


LIST OF TABLES (199 TABLES)

TABLE 1 HEMATOLOGY ANALYZERS MARKET, BY PRODUCT & SERVICE, 2018–2025 (USD MILLION)
TABLE 2 HEMATOLOGY PRODUCTS & SERVICES MARKET, BY REGION, 2018–2025 (USD MILLION)
TABLE 3 HEMATOLOGY PRODUCTS & SERVICES MARKET, BY TYPE, 2018–2025 (USD MILLION)
TABLE 4 HEMATOLOGY PRODUCTS & SERVICES MARKET, BY APPLICATION, 2018–2025 (USD MILLION)
TABLE 5 HEMATOLOGY PRODUCTS & SERVICES MARKET, BY USAGE TYPE, 2018–2025 (USD MILLION)
TABLE 6 HEMATOLOGY PRODUCTS & SERVICES MARKET, BY END USER, 2018–2025 (USD MILLION)
TABLE 7 HEMATOLOGY REAGENTS & CONSUMABLES MARKET, BY TYPE, 2018–2025 (USD MILLION)
TABLE 8 HEMATOLOGY REAGENTS & CONSUMABLES MARKET, BY REGION, 2018–2025 (USD MILLION)
TABLE 9 HEMATOLOGY REAGENTS & CONSUMABLES MARKET, BY APPLICATION, 2018–2025 (USD MILLION)
TABLE 10 HEMATOLOGY REAGENTS & CONSUMABLES MARKET, BY USAGE TYPE, 2018–2025 (USD MILLION)
TABLE 11 HEMATOLOGY REAGENTS & CONSUMABLES MARKET, BY END USER, 2018–2025 (USD MILLION)
TABLE 12 HEMATOLOGY REAGENTS MARKET, BY REGION, 2018–2025 (USD MILLION)
TABLE 13 HEMATOLOGY CONSUMABLES MARKET, BY REGION, 2018–2025 (USD MILLION)
TABLE 14 HEMATOLOGY CONTROLS & CALIBRATORS MARKET, BY REGION, 2018–2025 (USD MILLION)
TABLE 15 HEMATOLOGY SLIDE STAINERS/MAKERS MARKET, BY REGION, 2018–2025 (USD MILLION)
TABLE 16 HEMATOLOGY INSTRUMENTS MARKET, BY TYPE, 2018–2025 (USD MILLION)
TABLE 17 HEMATOLOGY INSTRUMENTS MARKET, BY REGION, 2018–2025 (USD MILLION)
TABLE 18 HEMATOLOGY INSTRUMENTS MARKET, BY APPLICATION, 2018–2025 (USD MILLION)
TABLE 19 HEMATOLOGY INSTRUMENTS MARKET, BY USAGE TYPE, 2018–2025 (USD MILLION)
TABLE 20 HEMATOLOGY INSTRUMENTS MARKET, BY END USER, 2018–2025 (USD MILLION)
TABLE 21 5-PART AND 6-PART FULLY AUTOMATED HEMATOLOGY ANALYZERS MARKET, BY REGION, 2018–2025 (USD MILLION)
TABLE 22 3-PART FULLY AUTOMATED HEMATOLOGY ANALYZERS MARKET, BY REGION, 2018–2025 (USD MILLION)
TABLE 23 POINT-OF-CARE TESTING HEMATOLOGY ANALYZERS MARKET, BY REGION, 2018–2025 (USD MILLION)
TABLE 24 SEMI-AUTOMATED HEMATOLOGY ANALYZERS MARKET, BY REGION, 2018–2025 (USD MILLION)
TABLE 25 HEMATOLOGY SERVICES MARKET, BY REGION, 2018–2025 (USD MILLION)
TABLE 26 HEMATOLOGY SERVICES MARKET, BY APPLICATION, 2018–2025 (USD MILLION)
TABLE 27 HEMATOLOGY SERVICES MARKET, BY USAGE TYPE, 2018–2025 (USD MILLION)
TABLE 28 HEMATOLOGY SERVICES MARKET, BY END USER, 2018–2025 (USD MILLION)
TABLE 29 HEMOSTASIS PRODUCTS & SERVICES MARKET, BY REGION, 2018–2025 (USD MILLION)
TABLE 30 HEMOSTASIS PRODUCTS & SERVICES MARKET, BY TYPE, 2018–2025 (USD MILLION)
TABLE 31 HEMOSTASIS PRODUCTS & SERVICES MARKET, BY USAGE TYPE, 2018–2025 (USD MILLION)
TABLE 32 HEMOSTASIS PRODUCTS & SERVICES MARKET, BY APPLICATION, 2018–2025 (USD MILLION)
TABLE 33 HEMOSTASIS PRODUCTS & SERVICES MARKET, BY END USER, 2018–2025 (USD MILLION)
TABLE 34 HEMOSTASIS REAGENTS & CONSUMABLES MARKET, BY REGION, 2018–2025 (USD MILLION)
TABLE 35 HEMOSTASIS REAGENTS & CONSUMABLES MARKET, BY USAGE TYPE, 2018–2025 (USD MILLION)
TABLE 36 HEMOSTASIS REAGENTS & CONSUMABLES MARKET, BY APPLICATION, 2018–2025 (USD MILLION)
TABLE 37 HEMOSTASIS REAGENTS & CONSUMABLES MARKET, BY END USER, 2018–2025 (USD MILLION)
TABLE 38 HEMOSTASIS INSTRUMENTS MARKET, BY REGION, 2018–2025 (USD MILLION)
TABLE 39 HEMOSTASIS INSTRUMENTS MARKET, BY USAGE TYPE, 2018–2025 (USD MILLION)
TABLE 40 HEMOSTASIS INSTRUMENTS MARKET, BY APPLICATION, 2018–2025 (USD MILLION)
TABLE 41 HEMOSTASIS INSTRUMENTS MARKET, BY END USER, 2018–2025 (USD MILLION)
TABLE 42 HEMOSTASIS SERVICES MARKET, BY REGION, 2018–2025 (USD MILLION)
TABLE 43 HEMOSTASIS SERVICES MARKET, BY USAGE TYPE, 2018–2025 (USD MILLION)
TABLE 44 HEMOSTASIS SERVICES MARKET, BY APPLICATION, 2018–2025 (USD MILLION)
TABLE 45 HEMOSTASIS SERVICES MARKET, BY END USER, 2018–2025 (USD MILLION)
TABLE 46 IMMUNOHEMATOLOGY PRODUCTS & SERVICES MARKET, BY REGION, 2018–2025 (USD MILLION)
TABLE 47 IMMUNOHEMATOLOGY PRODUCTS & SERVICES MARKET, BY TYPE, 2018–2025 (USD MILLION)
TABLE 48 IMMUNOHEMATOLOGY PRODUCTS & SERVICES MARKET, BY USAGE TYPE, 2018–2025 (USD MILLION)
TABLE 49 IMMUNOHEMATOLOGY PRODUCTS & SERVICES MARKET, BY APPLICATION, 2018–2025 (USD MILLION)
TABLE 50 IMMUNOHEMATOLOGY PRODUCTS & SERVICES MARKET, BY END USER, 2018–2025 (USD MILLION)
TABLE 51 IMMUNOHEMATOLOGY REAGENTS & CONSUMABLES MARKET, BY REGION, 2018–2025 (USD MILLION)
TABLE 52 IMMUNOHEMATOLOGY REAGENTS & CONSUMABLES MARKET, BY USAGE TYPE, 2018–2025 (USD MILLION)
TABLE 53 IMMUNOHEMATOLOGY REAGENTS & CONSUMABLES MARKET, BY APPLICATION, 2018–2025 (USD MILLION)
TABLE 54 IMMUNOHEMATOLOGY REAGENTS & CONSUMABLES MARKET, BY END USER, 2018–2025 (USD MILLION)
TABLE 55 IMMUNOHEMATOLOGY INSTRUMENTS MARKET, BY REGION, 2018–2025 (USD MILLION)
TABLE 56 IMMUNOHEMATOLOGY INSTRUMENTS MARKET, BY USAGE TYPE, 2018–2025 (USD MILLION)
TABLE 57 IMMUNOHEMATOLOGY INSTRUMENTS MARKET, BY APPLICATION, 2018–2025 (USD MILLION)
TABLE 58 IMMUNOHEMATOLOGY INSTRUMENTS MARKET, BY END USER, 2018–2025 (USD MILLION)
TABLE 59 IMMUNOHEMATOLOGY SERVICES MARKET, BY REGION, 2018–2025 (USD MILLION)
TABLE 60 IMMUNOHEMATOLOGY SERVICES MARKET, BY USAGE TYPE, 2018–2025 (USD MILLION)
TABLE 61 IMMUNOHEMATOLOGY SERVICES MARKET, BY APPLICATION, 2018–2025 (USD MILLION)
TABLE 62 IMMUNOHEMATOLOGY SERVICES MARKET, BY END USER, 2018–2025 (USD MILLION)
TABLE 63 HEMATOLOGY ANALYZERS MARKET, BY PRICE RANGE, 2018–2025 (USD MILLION)
TABLE 64 LOW-END HEMATOLOGY ANALYZERS MARKET, BY REGION, 2018–2025 (USD MILLION)
TABLE 65 HIGH-END HEMATOLOGY ANALYZERS MARKET, BY REGION, 2018–2025 (USD MILLION)
TABLE 66 MID-RANGE HEMATOLOGY ANALYZERS MARKET, BY REGION, 2018–2025 (USD MILLION)
TABLE 67 HEMATOLOGY ANALYZERS MARKET, BY APPLICATION, 2018–2025 (USD MILLION)
TABLE 68 HEMATOLOGY ANALYZERS AND REAGENTS MARKET FOR HEMORRHAGIC CONDITIONS, BY REGION, 2018–2025 (USD MILLION)
TABLE 69 HEMATOLOGY ANALYZERS AND REAGENTS MARKET FOR INFECTION-RELATED CONDITIONS, BY REGION, 2018–2025 (USD MILLION)
TABLE 70 HEMATOLOGY ANALYZERS AND REAGENTS MARKET FOR IMMUNE SYSTEM-RELATED CONDITIONS, BY REGION, 2018–2025 (USD MILLION)
TABLE 71 HEMATOLOGY ANALYZERS AND REAGENTS MARKET FOR BLOOD CANCER, BY REGION, 2018–2025 (USD MILLION)
TABLE 72 HEMATOLOGY ANALYZERS AND REAGENTS MARKET FOR ANEMIA, BY REGION, 2018–2025 (USD MILLION)
TABLE 73 HEMATOLOGY ANALYZERS AND REAGENTS MARKET FOR OTHER APPLICATIONS, BY REGION, 2018–2025 (USD MILLION)
TABLE 74 HEMATOLOGY ANALYZERS AND REAGENTS MARKET, BY USAGE TYPE, 2018–2025 (USD MILLION)
TABLE 75 STANDALONE HEMATOLOGY ANALYZERS MARKET, BY REGION, 2018–2025 (USD MILLION)
TABLE 76 POINT-OF-CARE HEMATOLOGY ANALYZERS, BY REGION, 2018–2025 (USD MILLION)
TABLE 77 HEMATOLOGY ANALYZERS MARKET, BY END USER, 2018–2025 (USD MILLION)
TABLE 78 HEMATOLOGY ANALYZERS AND REAGENTS MARKET FOR COMMERCIAL SERVICE PROVIDERS, BY REGION, 2018–2025 (USD MILLION)
TABLE 79 HEMATOLOGY ANALYZERS AND REAGENTS MARKET FOR HOSPITAL LABORATORIES, BY REGION, 2018–2025 (USD MILLION)
TABLE 80 HEMATOLOGY ANALYZERS AND REAGENTS MARKET FOR GOVERNMENT REFERENCE LABORATORIES, BY REGION, 2018–2025 (USD MILLION)
TABLE 81 HEMATOLOGY ANALYZERS AND REAGENTS MARKET FOR RESEARCH & ACADEMIC INSTITUTES, BY REGION, 2018–2025 (USD MILLION)
TABLE 82 HEMATOLOGY ANALYZERS AND REAGENTS MARKET, BY REGION, 2018–2025 (USD MILLION)
TABLE 83 NORTH AMERICA: HEMATOLOGY ANALYZERS MARKET, BY COUNTRY, 2018–2025 (USD MILLION)
TABLE 84 NORTH AMERICA: HEMATOLOGY ANALYZERS AND REAGENTS MARKET, BY PRODUCT & SERVICE, 2018–2025 (USD MILLION)
TABLE 85 NORTH AMERICA: HEMATOLOGY PRODUCTS & SERVICES MARKET, BY TYPE, 2018–2025 (USD MILLION)
TABLE 86 NORTH AMERICA: HEMATOLOGY INSTRUMENTS MARKET, BY TYPE, 2018–2025 (USD MILLION)
TABLE 87 NORTH AMERICA: HEMATOLOGY REAGENTS & CONSUMABLES MARKET, BY TYPE, 2018–2025 (USD MILLION)
TABLE 88 NORTH AMERICA: HEMOSTASIS PRODUCTS & SERVICES MARKET, BY TYPE, 2018–2025 (USD MILLION)
TABLE 89 NORTH AMERICA: IMMUNOHEMATOLOGY PRODUCTS & SERVICES MARKET, BY TYPE, 2018–2025 (USD MILLION)
TABLE 90 NORTH AMERICA: HEMATOLOGY ANALYZERS AND REAGENTS MARKET, BY PRICE RANGE, 2018–2025 (USD MILLION)
TABLE 91 NORTH AMERICA: HEMATOLOGY ANALYZERS & REAGENTS MARKET, BY APPLICATION, 2018–2025 (USD MILLION)
TABLE 92 NORTH AMERICA: HEMATOLOGY ANALYZERS AND REAGENTS MARKET, BY END USER, 2018–2025 (USD MILLION)
TABLE 93 US: HEMATOLOGY ANALYZERS MARKET, BY PRODUCT & SERVICE, 2018–2025 (USD MILLION)
TABLE 94 US: HEMATOLOGY PRODUCTS & SERVICES MARKET, BY TYPE, 2018–2025 (USD MILLION)
TABLE 95 US: HEMOSTASIS PRODUCTS & SERVICES MARKET, BY TYPE, 2018–2025 (USD MILLION)
TABLE 96 US: IMMUNOHEMATOLOGY PRODUCTS & SERVICES MARKET, BY TYPE, 2018–2025 (USD MILLION)
TABLE 97 CANADA: HEMATOLOGY ANALYZERS MARKET, BY PRODUCT & SERVICE, 2018–2025 (USD MILLION)
TABLE 98 CANADA: HEMATOLOGY PRODUCTS & SERVICES MARKET, BY TYPE, 2018–2025 (USD MILLION)
TABLE 99 CANADA: HEMOSTASIS PRODUCTS & SERVICES MARKET, BY TYPE, 2018–2025 (USD MILLION)
TABLE 100 CANADA: IMMUNOHEMATOLOGY PRODUCTS & SERVICES MARKET, BY TYPE, 2018–2025 (USD MILLION)
TABLE 101 EUROPE: HEMATOLOGY ANALYZERS MARKET, BY COUNTRY, 2018–2025 (USD MILLION)
TABLE 102 EUROPE: HEMATOLOGY ANALYZERS AND REAGENTS MARKET, BY PRODUCT & SERVICE, 2018–2025 (USD MILLION)
TABLE 103 EUROPE: HEMATOLOGY PRODUCTS & SERVICES MARKET, BY TYPE, 2018–2025 (USD MILLION)
TABLE 104 NORTH AMERICA: HEMATOLOGY INSTRUMENTS MARKET, BY TYPE, 2018–2025 (USD MILLION)
TABLE 105 EUROPE: HEMATOLOGY REAGENTS & CONSUMABLES MARKET, BY TYPE, 2018–2025 (USD MILLION)
TABLE 106 EUROPE: HEMOSTASIS PRODUCTS & SERVICES MARKET, BY TYPE, 2018–2025 (USD MILLION)
TABLE 107 EUROPE: IMMUNOHEMATOLOGY PRODUCTS & SERVICES MARKET, BY TYPE, 2018–2025 (USD MILLION)
TABLE 108 EUROPE: HEMATOLOGY ANALYZERS AND REAGENTS MARKET, BY PRICE RANGE, 2018–2025 (USD MILLION)
TABLE 109 EUROPE: HEMATOLOGY ANALYZERS & REAGENTS MARKET, BY APPLICATION, 2018–2025 (USD MILLION)
TABLE 110 EUROPE: HEMATOLOGY ANALYZERS AND REAGENTS MARKET, BY END USER, 2018–2025 (USD MILLION)
TABLE 111 GERMANY: HEMATOLOGY ANALYZERS MARKET, BY PRODUCT & SERVICE, 2018–2025 (USD MILLION)
TABLE 112 GERMANY: HEMATOLOGY PRODUCTS & SERVICES MARKET, BY TYPE, 2018–2025 (USD MILLION)
TABLE 113 GERMANY: HEMOSTASIS PRODUCTS & SERVICES MARKET, BY TYPE, 2018–2025 (USD MILLION)
TABLE 114 GERMANY: IMMUNOHEMATOLOGY PRODUCTS & SERVICES MARKET, BY TYPE, 2018–2025 (USD MILLION)
TABLE 115 UK: HEMATOLOGY ANALYZERS MARKET, BY PRODUCT & SERVICE, 2018–2025 (USD MILLION)
TABLE 116 UK: HEMATOLOGY PRODUCTS & SERVICES MARKET, BY TYPE, 2018–2025 (USD MILLION)
TABLE 117 UK: HEMOSTASIS PRODUCTS & SERVICES MARKET, BY TYPE, 2018–2025 (USD MILLION)
TABLE 118 UK: IMMUNOHEMATOLOGY PRODUCTS & SERVICES MARKET, BY TYPE, 2018–2025 (USD MILLION)
TABLE 119 FRANCE: HEMATOLOGY ANALYZERS MARKET, BY PRODUCT & SERVICE, 2018–2025 (USD MILLION)
TABLE 120 FRANCE: HEMATOLOGY PRODUCTS & SERVICES MARKET, BY TYPE, 2018–2025 (USD MILLION)
TABLE 121 FRANCE: HEMOSTASIS PRODUCTS & SERVICES MARKET, BY TYPE, 2018–2025 (USD MILLION)
TABLE 122 FRANCE: IMMUNOHEMATOLOGY PRODUCTS & SERVICES MARKET, BY TYPE, 2018–2025 (USD MILLION)
TABLE 123 ITALY: HEMATOLOGY ANALYZERS MARKET, BY PRODUCT & SERVICE, 2018–2025 (USD MILLION)
TABLE 124 ITALY: HEMATOLOGY PRODUCTS & SERVICES MARKET, BY TYPE, 2018–2025 (USD MILLION)
TABLE 125 ITALY: HEMOSTASIS PRODUCTS & SERVICES MARKET, BY TYPE, 2018–2025 (USD MILLION)
TABLE 126 ITALY: IMMUNOHEMATOLOGY PRODUCTS & SERVICES MARKET, BY TYPE, 2018–2025 (USD MILLION)
TABLE 127 SPAIN: HEMATOLOGY ANALYZERS MARKET, BY PRODUCT & SERVICE, 2018–2025 (USD MILLION)
TABLE 128 SPAIN: HEMATOLOGY PRODUCTS & SERVICES MARKET, BY TYPE, 2018–2025 (USD MILLION)
TABLE 129 SPAIN: HEMOSTASIS PRODUCTS & SERVICES MARKET, BY TYPE, 2018–2025 (USD MILLION)
TABLE 130 SPAIN: IMMUNOHEMATOLOGY PRODUCTS & SERVICES MARKET, BY TYPE, 2018–2025 (USD MILLION)
TABLE 131 ROE: HEMATOLOGY ANALYZERS MARKET, BY PRODUCT & SERVICE, 2018–2025 (USD MILLION)
TABLE 132 ROE: HEMATOLOGY PRODUCTS & SERVICES MARKET, BY TYPE, 2018–2025 (USD MILLION)
TABLE 133 ROE: HEMOSTASIS PRODUCTS & SERVICES MARKET, BY TYPE, 2018–2025 (USD MILLION)
TABLE 134 ROE: IMMUNOHEMATOLOGY PRODUCTS & SERVICES MARKET, BY TYPE, 2018–2025 (USD MILLION)
TABLE 135 APAC: HEMATOLOGY ANALYZERS MARKET, BY COUNTRY, 2018–2025 (USD MILLION)
TABLE 136 APAC: HEMATOLOGY ANALYZERS AND REAGENTS MARKET, BY PRODUCT & SERVICE, 2018–2025 (USD MILLION)
TABLE 137 APAC: HEMATOLOGY PRODUCTS & SERVICES MARKET, BY TYPE, 2018–2025 (USD MILLION)
TABLE 138 APAC: HEMATOLOGY INSTRUMENTS MARKET, BY TYPE, 2018–2025 (USD MILLION)
TABLE 139 APAC: HEMATOLOGY REAGENTS & CONSUMABLES MARKET, BY TYPE, 2018–2025 (USD MILLION)
TABLE 140 APAC: HEMOSTASIS PRODUCTS & SERVICES MARKET, BY TYPE, 2018–2025 (USD MILLION)
TABLE 141 APAC: IMMUNOHEMATOLOGY PRODUCTS & SERVICES MARKET, BY TYPE, 2018–2025 (USD MILLION)
TABLE 142 APAC: HEMATOLOGY ANALYZERS AND REAGENTS MARKET, BY PRICE RANGE, 2018–2025 (USD MILLION)
TABLE 143 APAC: HEMATOLOGY MARKET, BY APPLICATION, 2018–2025 (USD MILLION)
TABLE 144 APAC: HEMATOLOGY ANALYZERS AND REAGENTS MARKET, BY END USER, 2018–2025 (USD MILLION)
TABLE 145 CHINA: HEMATOLOGY ANALYZERS MARKET, BY PRODUCT & SERVICE, 2018–2025 (USD MILLION)
TABLE 146 CHINA: HEMATOLOGY PRODUCTS & SERVICES MARKET, BY TYPE, 2018–2025 (USD MILLION)
TABLE 147 CHINA: HEMOSTASIS PRODUCTS & SERVICES MARKET, BY TYPE, 2018–2025 (USD MILLION)
TABLE 148 CHINA: IMMUNOHEMATOLOGY PRODUCTS & SERVICES MARKET, BY TYPE, 2018–2025 (USD MILLION)
TABLE 149 JAPAN: HEMATOLOGY ANALYZERS MARKET, BY PRODUCT & SERVICE, 2018–2025 (USD MILLION)
TABLE 150 JAPAN: HEMATOLOGY PRODUCTS & SERVICES MARKET, BY TYPE, 2018–2025 (USD MILLION)
TABLE 151 JAPAN: HEMOSTASIS PRODUCTS & SERVICES MARKET, BY TYPE, 2018–2025 (USD MILLION)
TABLE 152 JAPAN: IMMUNOHEMATOLOGY PRODUCTS & SERVICES MARKET, BY TYPE, 2018–2025 (USD MILLION)
TABLE 153 INDIA: HEMATOLOGY ANALYZERS MARKET, BY PRODUCT & SERVICE, 2018–2025 (USD MILLION)
TABLE 154 INDIA: HEMATOLOGY PRODUCTS & SERVICES MARKET, BY TYPE, 2018–2025 (USD MILLION)
TABLE 155 INDIA: HEMOSTASIS PRODUCTS & SERVICES MARKET, BY TYPE, 2018–2025 (USD MILLION)
TABLE 156 INDIA: IMMUNOHEMATOLOGY PRODUCTS & SERVICES MARKET, BY TYPE, 2018–2025 (USD MILLION)
TABLE 157 AUSTRALIA: HEMATOLOGY ANALYZERS MARKET, BY PRODUCT & SERVICE, 2018–2025 (USD MILLION)
TABLE 158 AUSTRALIA: HEMATOLOGY PRODUCTS & SERVICES MARKET, BY TYPE, 2018–2025 (USD MILLION)
TABLE 159 AUSTRALIA: HEMOSTASIS PRODUCTS & SERVICES MARKET, BY TYPE, 2018–2025 (USD MILLION)
TABLE 160 AUSTRALIA: IMMUNOHEMATOLOGY PRODUCTS & SERVICES MARKET, BY TYPE, 2018–2025 (USD MILLION)
TABLE 161 SOUTH KOREA: HEMATOLOGY ANALYZERS MARKET, BY PRODUCT & SERVICE, 2018–2025 (USD MILLION)
TABLE 162 SOUTH KOREA: HEMATOLOGY PRODUCTS & SERVICES MARKET, BY TYPE, 2018–2025 (USD MILLION)
TABLE 163 SOUTH KOREA: HEMOSTASIS PRODUCTS & SERVICES MARKET, BY TYPE, 2018–2025 (USD MILLION)
TABLE 164 SOUTH KOREA: IMMUNOHEMATOLOGY PRODUCTS & SERVICES MARKET, BY TYPE, 2018–2025 (USD MILLION)
TABLE 165 ROAPAC: HEMATOLOGY ANALYZERS MARKET, BY PRODUCT & SERVICE, 2018–2025 (USD MILLION)
TABLE 166 ROAPAC: HEMATOLOGY PRODUCTS & SERVICES MARKET, BY TYPE, 2018–2025 (USD MILLION)
TABLE 167 ROAPAC: HEMOSTASIS PRODUCTS & SERVICES MARKET, BY TYPE, 2018–2025 (USD MILLION)
TABLE 168 ROAPAC: IMMUNOHEMATOLOGY PRODUCTS & SERVICES MARKET, BY TYPE, 2018–2025 (USD MILLION)
TABLE 169 LATIN AMERICA: HEMATOLOGY ANALYZERS MARKET, BY COUNTRY, 2018–2025 (USD MILLION)
TABLE 170 LATAM: HEMATOLOGY ANALYZERS AND REAGENTS MARKET, BY PRODUCT & SERVICE, 2018–2025 (USD MILLION)
TABLE 171 LATAM: HEMATOLOGY PRODUCTS & SERVICES MARKET, BY TYPE, 2018–2025 (USD MILLION)
TABLE 172 LATAM: HEMATOLOGY INSTRUMENTS MARKET, BY TYPE, 2018–2025 (USD MILLION)
TABLE 173 LATAM: HEMATOLOGY REAGENTS & CONSUMABLES MARKET, BY TYPE, 2018–2025 (USD MILLION)
TABLE 174 LATAM: HEMOSTASIS PRODUCTS & SERVICES MARKET, BY TYPE, 2018–2025 (USD MILLION)
TABLE 175 LATAM: IMMUNOHEMATOLOGY PRODUCTS & SERVICES MARKET, BY TYPE, 2018–2025 (USD MILLION)
TABLE 176 LATAM: HEMATOLOGY ANALYZERS AND REAGENTS MARKET, BY PRICE RANGE, 2018–2025 (USD MILLION)
TABLE 177 LATAM: HEMATOLOGY MARKET, BY APPLICATION, 2018–2025 (USD MILLION)
TABLE 178 LATAM: HEMATOLOGY ANALYZERS AND REAGENTS MARKET, BY END USER, 2018–2025 (USD MILLION)
TABLE 179 BRAZIL: HEMATOLOGY ANALYZERS MARKET, BY PRODUCT & SERVICE, 2018–2025 (USD MILLION)
TABLE 180 BRAZIL: HEMATOLOGY PRODUCTS & SERVICES MARKET, BY TYPE, 2018–2025 (USD MILLION)
TABLE 181 BRAZIL: HEMOSTASIS PRODUCTS & SERVICES MARKET, BY TYPE, 2018–2025 (USD MILLION)
TABLE 182 BRAZIL: IMMUNOHEMATOLOGY PRODUCTS & SERVICES MARKET, BY TYPE, 2018–2025 (USD MILLION)
TABLE 183 MEXICO: HEMATOLOGY ANALYZERS MARKET, BY PRODUCT & SERVICE, 2018–2025 (USD MILLION)
TABLE 184 MEXICO: HEMATOLOGY PRODUCTS & SERVICES MARKET, BY TYPE, 2018–2025 (USD MILLION)
TABLE 185 MEXICO: HEMOSTASIS PRODUCTS & SERVICES MARKET, BY TYPE, 2018–2025 (USD MILLION)
TABLE 186 MEXICO: IMMUNOHEMATOLOGY PRODUCTS & SERVICES MARKET, BY TYPE, 2018–2025 (USD MILLION)
TABLE 187 ROLATAM: HEMATOLOGY ANALYZERS MARKET, BY PRODUCT & SERVICE, 2018–2025 (USD MILLION)
TABLE 188 ROLATAM: HEMATOLOGY PRODUCTS & SERVICES MARKET, BY TYPE, 2018–2025 (USD MILLION)
TABLE 189 ROLATAM: HEMOSTASIS PRODUCTS & SERVICES MARKET, BY TYPE, 2018–2025 (USD MILLION)
TABLE 190 ROAPAC: IMMUNOHEMATOLOGY PRODUCTS & SERVICES MARKET, BY TYPE, 2018–2025 (USD MILLION)
TABLE 191 MEA: HEMATOLOGY ANALYZERS MARKET, BY PRODUCT & SERVICE, 2018–2025 (USD MILLION)
TABLE 192 MEA: HEMATOLOGY PRODUCT & SERVICES MARKET, BY TYPE, 2018–2025 (USD MILLION)
TABLE 193 MEA: HEMATOLOGY INSTRUMENTS MARKET, BY TYPE, 2018–2025 (USD MILLION)
TABLE 194 MEA: HEMATOLOGY REAGENTS & CONSUMABLES MARKET, BY TYPE, 2018–2025 (USD MILLION)
TABLE 195 MEA: HEMOSTASIS PRODUCTS & SERVICES MARKET, BY TYPE, 2018–2025 (USD MILLION)
TABLE 196 MEA: IMMUNOHEMATOLOGY PRODUCTS & SERVICES MARKET, BY TYPE, 2018–2025 (USD MILLION)
TABLE 197 MEA: HEMATOLOGY ANALYZERS MARKET, BY PRICE RANGE, 2018–2025 (USD MILLION)
TABLE 198 MEA: HEMATOLOGY ANALYZERS & REAGENTS MARKET, BY APPLICATION, 2018–2025 (USD MILLION)
TABLE 199 MEA: HEMATOLOGY ANALYZERS AND REAGENTS MARKET, BY END USER, 2018–2025 (USD MILLION)


LIST OF FIGURES (30 FIGURES)

FIGURE 1 RESEARCH DESIGN
FIGURE 2 BREAKDOWN OF PRIMARIES: GLOBAL HEMATOLOGY ANALYZERS MARKET
FIGURE 3 RESEARCH METHODOLOGY: HYPOTHESIS BUILDING
FIGURE 4 MARKET SIZE ESTIMATION: HEMATOLOGY ANALYZERS INDUSTRY
FIGURE 5 DATA TRIANGULATION
FIGURE 6 HEMATOLOGY ANALYZERS INDUSTRY SHARE, BY PRODUCT & SERVICE, 2020 VS. 2025
FIGURE 7 HEMATOLOGY ANALYZERS AND REAGENTS MARKET, BY APPLICATION, 2020 VS. 2025 (USD MILLION)
FIGURE 8 HEMATOLOGY ANALYZERS AND REAGENTS MARKET, BY USAGE TYPE, 2020 VS. 2025 (USD MILLION)
FIGURE 9 HEMATOLOGY ANALYZERS AND REAGENTS MARKET, BY PRICE RANGE, 2020 VS. 2025 (USD MILLION)
FIGURE 10 HEMATOLOGY ANALYZERS AND REAGENTS MARKET, BY END USER, 2020 VS. 2025 (USD MILLION)
FIGURE 11 HEMATOLOGY ANALYZERS INDUSTRY: REGIONAL SNAPSHOT
FIGURE 12 INCREASING NUMBER OF BLOOD DONATIONS TO DRIVE MARKET GROWTH
FIGURE 13 HEMATOLOGY PRODUCTS & SERVICES WILL CONTINUE TO DOMINATE THE MARKET DURING THE FORECAST PERIOD
FIGURE 14 COMMERCIAL SERVICE PROVIDERS TO DOMINATE THE GLOBAL HEMATOLOGY ANALYZERS INDUSTRY DURING THE FORECAST PERIOD
FIGURE 15 ASIA PACIFIC TO REGISTER THE HIGHEST CAGR DURING THE FORECAST PERIOD
FIGURE 16 NORTH AMERICA: HEMATOLOGY ANALYZERS MARKET SNAPSHOT
FIGURE 17 APAC: HEMATOLOGY ANALYZERS AND REAGENTS MARKET SNAPSHOT
FIGURE 18 KEY DEVELOPMENTS BY LEADING MARKET PLAYERS IN THE HEMATOLOGY ANALYZERS AND REAGENTS MARKET, 2016–2019
FIGURE 19 HEMATOLOGY ANALYZERS AND REAGENTS MARKET SHARE, BY KEY PLAYER, 2018
FIGURE 20 HEMATOLOGY ANALYZERS AND REAGENTS MARKET (GLOBAL) COMPETITIVE LEADERSHIP MAPPING, 2019
FIGURE 21 ROCHE DIAGNOSTICS: COMPANY SNAPSHOT (2019)
FIGURE 22 ABBOTT LABORATORIES: COMPANY SNAPSHOT (2019)
FIGURE 23 DANAHER CORPORATION: COMPANY SNAPSHOT (2019)
FIGURE 24 SIEMENS HEALTHINEERS GROUP: COMPANY SNAPSHOT (2019)
FIGURE 25 SYSMEX CORPORATION: COMPANY SNAPSHOT (2019)
FIGURE 26 BIO-RAD LABORATORIES: COMPANY SNAPSHOT (2019)
FIGURE 27 HORIBA: COMPANY SNAPSHOT (2018)
FIGURE 28 NIHON KOHDEN: COMPANY SNAPSHOT (2019)
FIGURE 29 EKF DIAGNOSTICS: COMPANY SNAPSHOT (2018)
FIGURE 30 BOULE DIAGNOSTICS: COMPANY SNAPSHOT (2019)

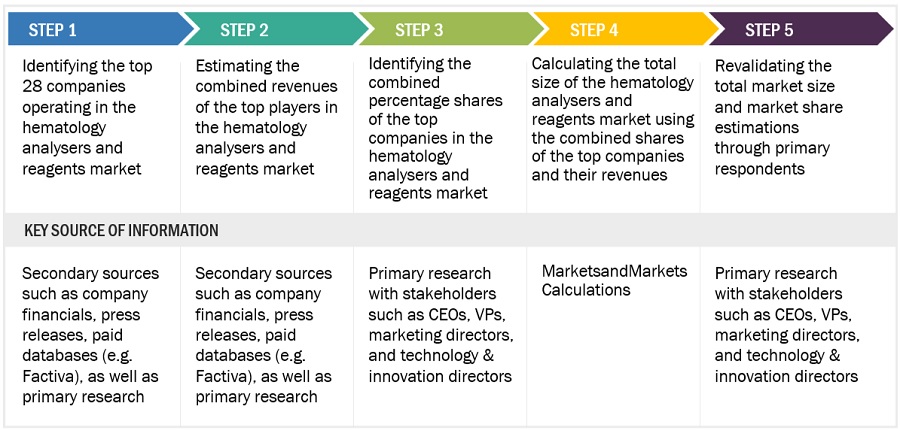
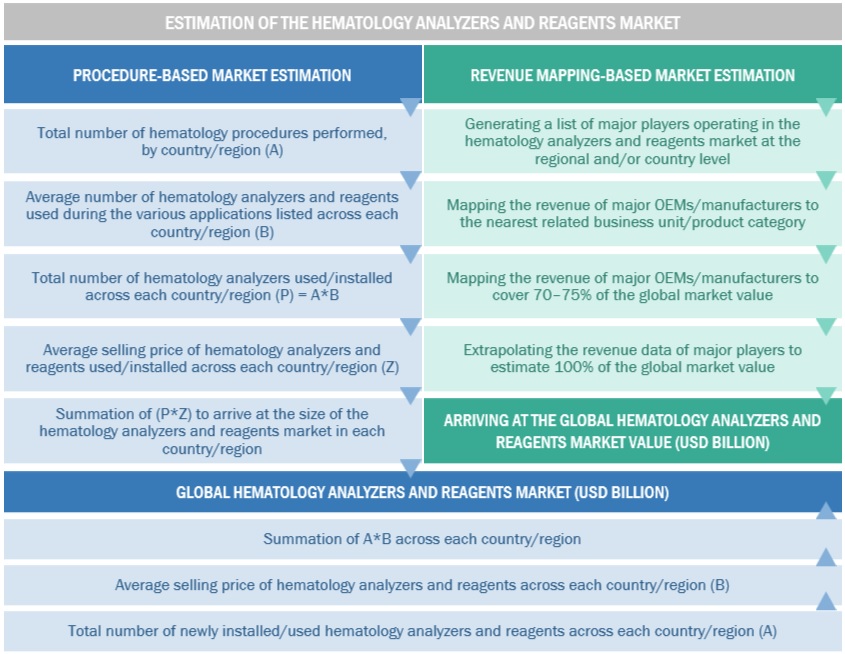
The study involved four major activities in estimating the current size of the global hematology analyzers and reagents market. Exhaustive secondary research was conducted to collect information on the market and its different subsegments. The next step was to validate these findings, assumptions, and sizing estimated with industry experts across the value chain through primary research. Both top-down and bottom-up approaches were employed to estimate the total market size. After that, market breakdown and data triangulation procedures were used to estimate the size of the segments and subsegments.

Secondary Research

In the secondary research process, various secondary sources such as annual reports, press releases & investor presentations of companies, white papers, certified publications, articles by recognized authors, gold-standard & silver-standard websites, regulatory bodies, and databases (such as D&B Hoovers, Bloomberg Businessweek, and Factiva) were referred to in order to identify and collect information for this study.

Primary Research

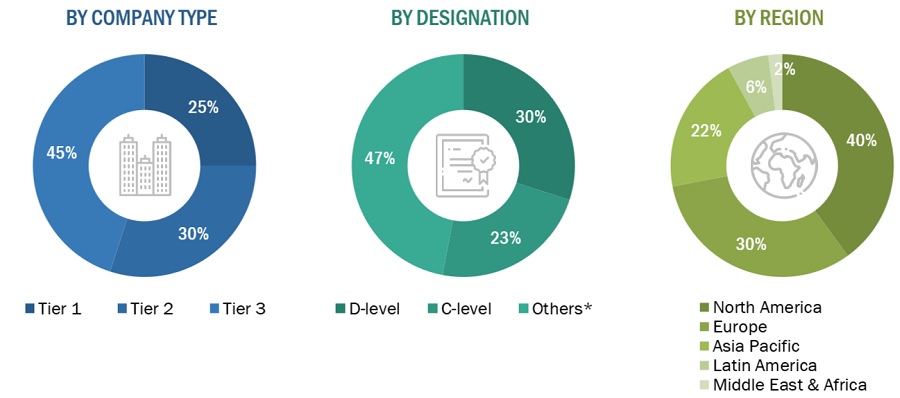
The hematology analyzers and reagents market comprises several stakeholders such as original equipment manufacturers (OEMs), product distributors and channel partners, hospitals, commercial laboratories, surgical centers, diagnostic laboratories, contract manufacturers and third-party suppliers, research laboratories and academic institutes, clinical research organizations (CROs), government and non-governmental regulatory authorities, and market research and consulting firms. Various primary sources from both the supply and demand sides of the market were interviewed to obtain qualitative and quantitative information. The following is a breakdown of the primary respondents:

Hematology Analyzers and Reagents Market

To know about the assumptions considered for the study, download the pdf brochure

Market Size Estimation

A detailed market estimation approach was followed to estimate and validate the value of the hematology analyzers and reagents market and other dependent submarkets, as mentioned below:

  • Key players in the global hematology analyzers and reagents market were identified through secondary research, and their global market shares were determined through primary and secondary research.
  • The research methodology included the study of the annual and quarterly financial reports & regulatory filings of significant market players as well as interviews with industry experts for detailed market insights.
  • All percentage shares, splits, and breakdowns for the global hematology analyzers and reagents market were determined using secondary sources and verified through primary sources.
  • All the key macroindicators affecting the revenue growth of the market segments and subsegments have been accounted for, viewed in extensive detail, verified through primary research, and analyzed to get the validated and verified quantitative and qualitative data.
  • The gathered market data was consolidated and added to detailed inputs, analyzed, and presented in this report.

Data Triangulation

After arriving at the overall size of the global hematology analyzers and reagents market through the methodology mentioned above, this market was split into several segments and subsegments. The data triangulation and market breakdown procedures were employed, wherever applicable, to complete the overall market engineering process and arrive at the exact market value data for critical segments and subsegments. The extrapolated market data was triangulated by studying various macroindicators and regional trends from both the demand- and supply-side participants.

Report Objectives

  • To define, describe, and forecast the hematology analyzers and reagents market based on products & service, usage type, price range, application, end user, and region
  • To provide detailed information on the major factors influencing market growth (such as drivers, restraints, opportunities, and industry-specific challenges)
  • To strategically analyze the micromarkets with respect to individual growth trends, prospects, and their contributions to the overall hematology analyzers and reagents market
  • To analyze market opportunities for stakeholders and provide details of the competitive landscape for key players
  • To forecast the market value of various segments and subsegments for five regions—North America, Europe, the Asia Pacific, Latin America, and the Middle East & Africa
  • To profile the key players in the hematology analyzers and reagents market and comprehensively analyze their global revenue shares and core competencies
  • To track and analyze competitive market-specific developments such as product launches/approvals and enhancements; partnerships, collaborations, and agreements; expansions; and acquisitions

Available Customizations

With the given market data, MarketsandMarkets offers customizations as per your company’s specific needs. The following customization options are available for the hematology analyzers and reagents market report:

Product Analysis

  • Product matrix, which gives a detailed comparison of the product portfolios of the top five companies in the hematology analyzers and reagents market

Company Information

  • Detailed analysis and profiling of additional market players (Up to 5)
Custom Market Research Services

We will customize the research for you, in case the report listed above does not meet with your exact requirements. Our custom research will comprehensively cover the business information you require to help you arrive at strategic and profitable business decisions.

Request Customization

Instant Answers with GPT - Ask Now!

Ask real questions. Get complete answers !
Report Code
MD 2479
Published ON
May, 2020
Choose License Type
BUY NOW
  • SHARE
X
Request Customization
Speak to Analyst
Speak to Analyst
OR FACE-TO-FACE MEETING
PERSONALIZE THIS RESEARCH
  • Triangulate with your Own Data
  • Get Data as per your Format and Definition
  • Gain a Deeper Dive on a Specific Application, Geography, Customer or Competitor
  • Any level of Personalization
REQUEST A FREE CUSTOMIZATION
LET US HELP YOU!
  • What are the Known and Unknown Adjacencies Impacting the Hematology Analyzers and Reagents Market
  • What will your New Revenue Sources be?
  • Who will be your Top Customer; what will make them switch?
  • Defend your Market Share or Win Competitors
  • Get a Scorecard for Target Partners
CUSTOMIZED WORKSHOP REQUEST
+1-888-600-6441
  • Call Us
  • +1-888-600-6441 (Corporate office hours)
  • +1-888-600-6441 (US/Can toll free)
  • +44-800-368-9399 (UK office hours)
CONNECT WITH US
ABOUT TRUST ONLINE
©2024 MarketsandMarkets Research Private Ltd. All rights reserved
DMCA.com Protection Status Website Feedback