In Vitro Toxicology Testing Market by Product (Assays (Western Blot, Tissue Culture), Equipment, Consumables, Software), Toxicity Endpoints (ADME, Skin Irritation, Cytotoxicity), Technology, Method, Industry (Pharma, Biotech) & Region - Global Forecast to 2027
Updated on : May 24, 2023
The global in vitro toxicology testing market in terms of revenue was estimated to be worth $11.2 billion in 2022 and is poised to reach $18.6 billion by 2027, growing at a CAGR of 10.8% from 2022 to 2027. The new research study consists of an industry trend analysis of the market. The new research study consists of industry trends, pricing analysis, patent analysis, conference and webinar materials, key stakeholders, and buying behaviour in the market. Technological advancements, opposition to animal testing, and increased R&D expenditure to detect toxicity early in the drug development process drive market growth. However, the failure to establish the intricacies of in vivo conditions through in vitro, the lack of in vitro models to study complex endpoints, and the dearth of skilled professionals are the factors restraining the growth of this market.
To know about the assumptions considered for the study, Request for Free Sample Report
In Vitro Toxicology Testing Market Dynamics
Driver: Growth of toxicology testing closely related to R&D spend of pharma companies
In the later stages of drug development, where a lot of money is on the line, there is always a high risk of failure. Approximately 30% of costly, late-stage drug development failures and market withdrawals are due to toxicity, which could lead to a high attrition rate in the final stages of the pharmaceutical drug discovery process. According to one estimate, only 250 out of every 10,000 compounds synthesized during the discovery phase will advance to the preclinical stage, leading to the development of one FDA-approved drug (Source: NCBI, the National Center for Biotechnology Information). It is crucial to identify and prioritize initiatives to move the attrition of failing molecules to an earlier stage in drug development in order to reduce the risk of the same. The global pharmaceutical industry spent USD 165 billion on R&D in 2017, according to the IFPMA (2019). The top two industries for R&D spending are the pharmaceutical and biotechnology sectors, with the EU taking the lead in this category, followed by the US, Japan, and China. Before the drug enters the more costly preclinical and clinical stages, an increase in R&D investments in the early stages is anticipated to drive the use of in vitro toxicity methods.
Restraint: Lack of in vitro models a critical restraining factor that is holding back growth of market
Due to the fact that human proteins and antibodies make up half of newly developed drugs, autoimmune disease and immune stimulation are significant endpoints. At the moment, only animal models can be used to test these therapeutic molecules. The memory response triggered inside a body after a secondary infection cannot be evaluated using in vitro testing methods. The recovery response of a body in relation to acute versus long-term immunosuppression cannot be assessed by in vitro methods. Additionally, it is unable to assess the toxic effects on lymphoid architecture, including lymph nodes, which may result in faulty cellular interactions required for the induction of an immune response. Contrary to T-dependent antibody SRBC (sheep red blood cells) in animals, there are currently no effective methods for producing antibodies in vitro using human cells. Guidelines still rely on animal tests to identify autoimmune disease and immune stimulation because there aren't any in vitro models available.
For instance, one of the regulatory toxicology fields that uses the most animal testing is developmental toxicity. Despite the fact that there are in vitro techniques for testing developmental toxicity, none of them identify the potential negative effects required to ensure safety. Most regulatory bodies and international organizations advise in vivo tests in addition to in vitro tests for genotoxicity. The complexity of cellular and mechanistic processes, which have not yet been fully identified, makes it challenging to design an in vitro test for neurotoxicity testing. Although there are in vitro tests for neurotoxicity, none of them have been approved by regulatory bodies. Therefore, one of the key things that is anticipated to limit the market's growth is the lack of validated in vitro models to study the intricate mechanisms and assess the toxicity potential of medications.
Opportunity: Increase in toxicology databases open up for companies
Predictive toxicology and structure-based approaches have been heavily influenced by the need to accelerate the toxicological evaluation of chemicals, use fewer animals, and employ less expensive tools. The field needs access to the most comprehensive body of prior toxicology findings, which must also be comparable and interoperable, in order to improve the efficacy of predictive toxicology methods. Databases with details on chemical safety profiles, modes of action, genetic effects, lethal dose information, various formulations, and toxicogenomic data will support the effective application of alternative toxicology testing techniques. Additionally, by reducing the need for repeated toxicity tests on the same chemicals for safety evaluation, these databases will lessen the need to conduct testing on animals. Understanding the various facets of toxic substances and their effects on a living system will be made easier by contributing and sharing data on a common platform. As a result, the creation of open, accessible, and machine-readable toxicology datasets built on standardized and regulated vocabularies will support data management, model development, integrated analysis, validation, and reporting, including regulatory reporting and alternative testing submission requirements, and will result in new scientific advancements in mechanistically based predictive toxicology. This will help the market expand.
Challenge: Skilled professionals impacting growth of the market
The development, validation, operation, and troubleshooting of methods all require highly qualified personnel. It requires skilled professionals, including technicians and researchers, to set up and run tests and experiments, make observations, obtain results, and analyze data. Experiments must be performed using labor-intensive techniques. Lack of understanding of the underlying scientific principles may incur several direct and indirect costs, adding to the workload and time demands placed on researchers and service providers.
The consumables segment is expected to account for the largest share of the in vitro toxicology testing market
Due to the frequent use of media and reagents in in vitro toxicology studies and the rising demand for high-quality reagents, consumables segment now account for the largest revenue share of the global market.
The organ toxicity segment is expected to grow at a high CAGR in the in vitro toxicology testing market during the forecast period
The market for toxicity endpoints and tests includes skin irritation, genotoxicity, cytotoxicity, ocular toxicity, organ toxicity, phototoxicity, dermal toxicity, corrosion and sensitization, and other endpoints and tests. The segment with the highest anticipated CAGR during the forecast period is organ toxicity. During the early stages of drug development, the majority of companies opt for organ-specific toxicity testing. As a result, there are higher chances that the regulatory approval process will favorably screen better candidates.
The cell culture technologies segment is expected to account for the largest share of the in vitro toxicology testing market
The market's largest percentage was held by the cell culture technologies segment. The most popular method for toxicity testing is cell culture. One of the main driving forces behind segmental growth is the capacity of cell culture to express the same genes and proteins as their in vivo counterparts.
To know about the assumptions considered for the study, download the pdf brochure
Asia Pacific is expected to grow at the highest rate in the in vitro toxicology testing market
The market in Asia Pacific is anticipated to expand at the highest CAGR during the forecast period. This is because in vitro toxicology testing is becoming more popular in the Asia Pacific due to the opposition to animal testing that has led to the use of alternative methods, the rise of CROs, rising consumer concern over product safety, and an expanding pharmaceutical drug pipeline.
In addition, a number of APAC nations are emerging as lucrative hubs for drug development and clinical research due to their sizable patient pools, cost advantages, high participant retention rates in clinical trials, and continually evolving regulatory frameworks.
The prominent players in the in vitro toxicology testing market include Thermo Fisher Scientific, Inc. (US), Laboratory Corporation of America Holdings (US), Bio-Rad Laboratories, Inc. (US), General Electric Company (US), Eurofins Scientific (Luxembourg), Merck KGaA (Germany), Charles River Laboratories International, Inc. (US), Catalent, Inc. (US), Evotec (UK), SGS S.A. (Switzerland), QIAGEN (Germany), Promega Corporation (US), Gentronix Limited (UK), BioIVT (US), and MB Research Laboratories (US).
In Vitro Toxicology Testing Market Report Scope
Report Metric |
Details |
Market Revenue in 2022 |
$11.2 billion |
Projected Revenue by 2027 |
$18.6 billion |
Revenue Rate |
Poised to grow at a CAGR of 10.8% |
Market Driver |
Growth of toxicology testing closely related to R&D spend of pharma companies |
Market Opportunity |
Increase in toxicology databases open up for companies |
This report categorizes the in vitro toxicology testing market to forecast revenue and analyze trends in each of the following submarkets:
By Product & Service
- Covid Impact,By Product & Service
- Consumables
-
Assays
- Bacterial Toxicity Assays
- Enzyme Toxicity Assays
- Cell-based Elisa & Western Blots
- Receptor-binding Assays
- Tissue Culture Assays
- Other Assays
- Equipment
- Software
- Services
By Method
- Cellular Assays
- Biochemical Assays
- In Silico Models
- Ex Vivo Models
By Toxicity Endpoint & Test
- ADME
- Skin Irritation, Corrosion, & Sensitization
- Genotoxicity Testing
- Cytotoxicity Testing
- Ocular Toxicity
- Organ Toxicity
- Phototoxicity Testing
- Dermal Toxicity
- Other Toxicity Endpoints & Tests
By Industry
- Covid Impact,By Industry
- Pharmaceuticals & Biopharmaceuticals
- Cosmetic & Household Products
- Food
- Chemicals
By Technology
- Cell Culture Technologies
- High-throughput Technologies
- Toxicogenomics
By Region
- Covid Impact,By Region
-
North America
- US
- Canada
-
Europe
- Germany
- UK
- France
- Italy
- Spain
- Rest of Europe
-
Asia Pacific
- China
- India
- Japan
- Rest of APAC
- Latin America
- Middle East & Africa
Recent Developments:
- In March 2022, Laboratory Corporation of America Holdings acquired AtlantiCare diagnostic clinical laboratory services.
- In September 2021, Laboratory Corporation of America Holdings Acquired Myriad Autoimmune’s Vectra Testing Business, autoimmune business unit, including the Vectra rheumatoid arthritis (RA) assay.
- In August 2020, Merck KGaA acquired BSSN Software, a German laboratory informatics company, for ease of data integration, collaboration, analysis, and long-term archiving in laboratories.
- In April 2019, Charles River Laboratories acquired Citoxlab, a non-clinical CRO, for USD 494 million (EUR 448 million).
Frequently Asked Questions (FAQ):
How big is the global in vitro toxicology testing market?
Global in vitro toxicology testing market revenue was estimated at $11.2 billion in 2022 and is projected to reach $18.6 billion by 2027, with a robust growth rate of 10.8% CAGR from 2022 to 2027.
Which major factors are influencing global growth of in vitro toxicology testing market?
Technological advancements, opposition to animal testing, and increased R&D expenditure to detect toxicity early in the drug development process drive market growth. However, the failure to establish the intricacies of in vivo conditions through in vitro, the lack of in vitro models to study complex endpoints, and the dearth of skilled professionals are the factors restraining the growth of this market.
To speak to our analyst for a discussion on the above findings, click Speak to Analyst
TABLE OF CONTENTS
1 INTRODUCTION (Page No. - 44)
1.1 STUDY OBJECTIVES
1.2 MARKET DEFINITION
1.2.1 INCLUSIONS AND EXCLUSIONS
1.2.2 MARKETS COVERED
FIGURE 1 IN VITRO TOXICOLOGY TESTING MARKET
FIGURE 2 IN VITRO TOXICOLOGY TESTING MARKET: GEOGRAPHIC SCOPE
1.2.3 YEARS CONSIDERED FOR STUDY
1.3 CURRENCY
1.4 STAKEHOLDERS
1.5 LIMITATIONS
1.6 SUMMARY OF CHANGES
2 RESEARCH METHODOLOGY (Page No. - 49)
2.1 RESEARCH APPROACH
FIGURE 3 RESEARCH DESIGN
2.1.1 SECONDARY RESEARCH
2.1.1.1 Key data from secondary sources
2.1.2 PRIMARY RESEARCH
2.1.2.1 Key data from primary sources
2.1.2.2 Breakdown of primaries
FIGURE 4 BREAKDOWN OF PRIMARY INTERVIEWS: BY COMPANY TYPE, DESIGNATION, AND REGION
2.2 MARKET SIZE ESTIMATION & VALIDATION APPROACH
FIGURE 5 MARKET SIZE APPROACH
FIGURE 6 BOTTOM-UP APPROACH
2.3 DATA TRIANGULATION APPROACH
FIGURE 7 DATA TRIANGULATION METHODOLOGY
2.4 MARKET SHARE ESTIMATION
2.5 ASSUMPTIONS FOR STUDY
3 EXECUTIVE SUMMARY (Page No. - 57)
FIGURE 8 IN VITRO TOXICITY TESTING MARKET, BY PRODUCT & SERVICE, 2022 VS. 2027 (USD MILLION)
FIGURE 9 GLOBAL MARKET, BY TOXICITY ENDPOINT & TEST, 2022 VS. 2027 (USD MILLION)
FIGURE 10 GLOBAL MARKET, BY TECHNOLOGY, 2022 VS. 2027 (USD MILLION)
FIGURE 11 IN VITRO TOXICOLOGY TESTING MARKET, BY INDUSTRY, 2022 VS. 2027 (USD MILLION)
FIGURE 12 GLOBAL MARKET, BY METHOD, 2022 VS. 2027 (USD MILLION)
FIGURE 13 GEOGRAPHIC ANALYSIS: GLOBAL MARKET
4 PREMIUM INSIGHTS (Page No. - 62)
4.1 IN VITRO TOXICITY TESTING MARKET OVERVIEW
FIGURE 14 OPPOSITION TO ANIMAL TESTING IS MAJOR FACTOR DRIVING MARKET GROWTH
4.2 ASIA PACIFIC: MARKET, BY METHOD
FIGURE 15 CELLULAR ASSAYS HELD LARGEST SHARE OF GLOBAL MARKET IN ASIA PACIFIC IN 2021
4.3 GLOBAL MARKET: GEOGRAPHIC GROWTH OPPORTUNITIES
FIGURE 16 CHINA IS LIKELY TO BE FASTEST-GROWING MARKET IN GLOBAL MARKET DURING FORECAST PERIOD
4.4 GLOBAL MARKET, BY REGION
FIGURE 17 EUROPE WILL CONTINUE TO DOMINATE GLOBAL MARKET IN 2027
4.5 IN VITRO TOXICOLOGY TESTING MARKET: DEVELOPED VS. DEVELOPING MARKETS
FIGURE 18 DEVELOPING MARKETS TO REGISTER HIGHER CAGR THAN DEVELOPED MARKETS THROUGHOUT FORECAST PERIOD
5 MARKET OVERVIEW (Page No. - 66)
5.1 INTRODUCTION
5.2 MARKET DYNAMICS
FIGURE 19 IN VITRO TOXICITY TESTING MARKET: DRIVERS, RESTRAINTS, OPPORTUNITIES, AND CHALLENGES
5.2.1 MARKET DRIVERS
5.2.1.1 Public opposition to animal testing
5.2.1.2 Technological advancements in toxicology
5.2.1.3 R&D on early-stage toxicity detection
5.2.2 MARKET RESTRAINTS
5.2.2.1 Reluctance of some regulatory authorities to adopt alternative toxicology testing methods
5.2.2.2 Failure to establish intricacies of in-vivo conditions
5.2.2.3 Lack of in vitro models to study complex endpoints
5.2.3 MARKET OPPORTUNITIES
5.2.3.1 Growing focus on drug discovery and personalized medicine using in vitro methods
5.2.3.2 Increasing number of toxicology databases
5.2.4 MARKET CHALLENGES
5.2.4.1 Dearth of skilled professionals in toxicity testing
6 INDUSTRY INSIGHTS (Page No. - 72)
6.1 INTRODUCTION
6.2 INDUSTRY TRENDS
6.2.1 INCREASING FOCUS ON PREDICTIVE TOXICOLOGY
6.3 SUPPLY CHAIN ANALYSIS
FIGURE 20 SUPPLY CHAIN ANALYSIS: GLOBAL MARKET
6.4 REGULATORY COMMITTEE ACTIVITIES
6.4.1 MAJOR STAKEHOLDERS
6.4.2 KEY INFLUENCERS
6.5 COVID-19 IMPACT ON IN VITRO TOXICOLOGY MARKET
FIGURE 21 IMPACT OF COVID-19 ON GLOBAL MARKET
6.6 PORTER’S FIVE FORCES ANALYSIS
TABLE 1 PORTER’S FIVE FORCES ANALYSIS
6.6.1 THREAT OF NEW ENTRANTS
6.6.2 THREAT OF SUBSTITUTES
6.6.3 BARGAINING POWER OF SUPPLIERS
6.6.4 DEGREE OF COMPETITIVE RIVALRY
6.7 TECHNOLOGY ANALYSIS
7 IN VITRO TOXICOLOGY TESTING MARKET, BY PRODUCT & SERVICE (Page No. - 79)
7.1 INTRODUCTION
7.2 COVID-19 IMPACT, BY PRODUCT & SERVICE
FIGURE 22 CONSUMABLES TO CAPTURE MAJORITY OF MARKET SHARE IN 2022
TABLE 2 GLOBAL MARKET, BY PRODUCT & SERVICE, 2019–2021 (USD MILLION)
TABLE 3 GLOBAL MARKET, BY PRODUCT & SERVICE, 2022–2027 (USD MILLION)
7.3 CONSUMABLES
7.3.1 CONSUMABLES TO ACCOUNT FOR LARGER MARKET SHARE THAN OTHER PRODUCTS IN 2022
TABLE 4 IN VITRO TOXICOLOGY TESTING CONSUMABLES MARKET, BY GEOGRAPHY, 2019–2021 (USD MILLION)
TABLE 5 IN VITRO TOXICOLOGY TESTING CONSUMABLES MARKET, BY GEOGRAPHY, 2022–2027 (USD MILLION)
7.4 ASSAYS
TABLE 6 ASSAYS: IN-VITRO TOXICOLOGY TESTING MARKET, BY TYPE, 2019–2021 (USD MILLION)
TABLE 7 ASSAYS: MARKET, BY TYPE, 2022–2027 (USD MILLION)
TABLE 8 ASSAYS: MARKET, BY GEOGRAPHY, 2019–2021 (USD MILLION)
TABLE 9 ASSAYS: MARKET, BY GEOGRAPHY, 2022–2027 (USD MILLION)
7.4.1 BACTERIAL TOXICITY ASSAYS
7.4.1.1 Bacterial assays to capture largest market share in coming years owing to their increasing adoption across several industries
TABLE 10 BACTERIAL TOXICITY ASSAYS: MARKET, BY GEOGRAPHY, 2019–2021 (USD MILLION)
TABLE 11 BACTERIAL TOXICITY ASSAYS: MARKET, BY GEOGRAPHY, 2022–2027 (USD MILLION)
7.4.2 ENZYME TOXICITY ASSAYS
7.4.2.1 Enzyme toxicity assays are increasingly used in endocrine-disrupting studies—major factor driving market growth
TABLE 12 ENZYME TOXICITY ASSAYS: IN-VITRO TOXICOLOGY TESTING MARKET, BY GEOGRAPHY, 2019–2021 (USD MILLION)
TABLE 13 ENZYME TOXICITY ASSAYS: MARKET, BY GEOGRAPHY, 2022–2027 (USD MILLION)
7.4.3 CELL-BASED ELISA & WESTERN BLOTS
7.4.3.1 Cell-based assays are cost-effective, thereby witnessing increasing adoption in drug discovery
TABLE 14 CELL-BASED ELISA & WESTERN BLOTS: MARKET, BY GEOGRAPHY, 2019–2021 (USD MILLION)
TABLE 15 CELL-BASED ELISA & WESTERN BLOTS: MARKET, BY GEOGRAPHY, 2022–2027 (USD MILLION)
7.4.4 RECEPTOR-BINDING ASSAYS
7.4.4.1 Receptor-binding assays are suitable for high-throughput formats, thereby exhibiting accelerated demand
TABLE 16 RECEPTOR-BINDING ASSAYS: MARKET, BY GEOGRAPHY, 2019–2021 (USD MILLION)
TABLE 17 RECEPTOR-BINDING ASSAYS: MARKET, BY GEOGRAPHY, 2022–2027 (USD MILLION)
7.4.5 TISSUE CULTURE ASSAYS
7.4.5.1 Tissue culture assays can mimic in-vivo tissue architecture, thereby attracting researchers
TABLE 18 TISSUE CULTURE ASSAYS: IN-VITRO TOXICOLOGY TESTING MARKET, BY GEOGRAPHY, 2019–2021 (USD MILLION)
TABLE 19 TISSUE CULTURE ASSAYS: MARKET, BY GEOGRAPHY, 2022–2027 (USD MILLION)
7.4.6 OTHER ASSAYS
TABLE 20 OTHER ASSAYS: MARKET, BY GEOGRAPHY, 2019–2021 (USD MILLION)
TABLE 21 OTHER ASSAYS: MARKET, BY GEOGRAPHY, 2022–2027 (USD MILLION)
7.5 EQUIPMENT
7.5.1 FULLY AUTOMATED IN VITRO TOXICOLOGY EQUIPMENT ARE INCREASINGLY ADOPTED IN RESEARCH
TABLE 22 EQUIPMENT: MARKET, BY GEOGRAPHY, 2019–2021 (USD MILLION)
TABLE 23 EQUIPMENT: MARKET, BY GEOGRAPHY, 2022–2027 (USD MILLION)
7.6 SOFTWARE
7.6.1 SOFTWARE SOLUTIONS ARE VITAL IN REDUCING ANALYSIS TIME AND MANAGING LARGE VOLUMES OF DATA GENERATED DURING OPERATIONS
TABLE 24 SOFTWARE: IN-VITRO TOXICOLOGY TESTING MARKET, BY GEOGRAPHY, 2019–2021 (USD MILLION)
TABLE 25 SOFTWARE: MARKET, BY GEOGRAPHY, 2022–2027 (USD MILLION)
7.7 SERVICES
7.7.1 LACK OF INFRASTRUCTURE AND EXPERTISE HAVE DRIVEN RELIANCE ON SERVICE PROVIDERS
TABLE 26 SERVICES: MARKET, BY GEOGRAPHY, 2019–2021 (USD MILLION)
TABLE 27 SERVICES: MARKET, BY GEOGRAPHY, 2022–2027 (USD MILLION)
8 IN VITRO TOXICOLOGY TESTING MARKET, BY TOXICITY ENDPOINT & TEST (Page No. - 103)
8.1 INTRODUCTION
FIGURE 23 ORGAN TOXICITY TESTING TO REGISTER HIGHEST CAGR DURING FORECAST PERIOD
TABLE 28 GLOBAL MARKET, BY TOXICITY ENDPOINT & TEST, 2019–2021 (USD MILLION)
TABLE 29 IN VITRO TOXICOLOGY TESTING MARKET, BY TOXICITY ENDPOINT & TEST, 2022–2027 (USD MILLION)
8.2 ADME (ABSORPTION, DISTRIBUTION, METABOLISM, & EXCRETION)
8.2.1 ADME TESTING TO COMMAND GLOBAL MARKET DURING FORECAST PERIOD
TABLE 30 ADME: MARKET, BY GEOGRAPHY, 2019–2021 (USD MILLION)
TABLE 31 ADME: MARKET, BY GEOGRAPHY, 2022–2027 (USD MILLION)
8.3 SKIN IRRITATION, CORROSION, & SENSITIZATION
8.3.1 SKIN IRRITATION, CORROSION, & SENSITIZATION ARE MAJOR ENDPOINTS STUDIED IN COSMETICS INDUSTRY
TABLE 32 SKIN IRRITATION, CORROSION, & SENSITIZATION: IN-VITRO TOXICOLOGY TESTING MARKET, BY GEOGRAPHY, 2019–2021 (USD MILLION)
TABLE 33 SKIN IRRITATION, CORROSION, & SENSITIZATION: MARKET, BY GEOGRAPHY, 2022–2027 (USD MILLION)
8.4 GENOTOXICITY
8.4.1 REGULATORY AUTHORITIES REVIEW AND VALIDATE HIGHER NUMBER OF GENOTOXICITY TESTS THAN ANY OTHER ENDPOINT, THEREBY PROPELLING MARKET GROWTH
TABLE 34 GENOTOXICITY: IN VITRO TOXICOLOGY TESTING, BY GEOGRAPHY, 2019–2021 (USD MILLION)
TABLE 35 GENOTOXICITY: IN VITRO TOXICOLOGY TESTING, BY GEOGRAPHY, 2022–2027 (USD MILLION)
8.5 CYTOTOXICITY
8.5.1 RISING NEED FOR BIOSAFETY LARGELY CONTRIBUTES TO GROWTH OF CYTOTOXICITY TESTING MARKET
TABLE 36 CYTOTOXICITY: IN-VITRO TOXICOLOGY TESTING MARKET, BY GEOGRAPHY, 2019–2021 (USD MILLION)
TABLE 37 CYTOTOXICITY: MARKET, BY GEOGRAPHY, 2022–2027 (USD MILLION)
8.6 OCULAR TOXICITY TESTING
8.6.1 IN VITRO AND EX-VIVO METHODS ARE GAINING HIGH RECOGNITION FOR OCULAR TOXICITY TESTING
TABLE 38 OCULAR TOXICITY: MARKET, BY GEOGRAPHY, 2019–2021 (USD MILLION)
TABLE 39 OCULAR TOXICITY: MARKET, BY GEOGRAPHY, 2022–2027 (USD MILLION)
8.7 ORGAN TOXICITY
8.7.1 HIGH-CONTENT SCREENING AND CELL-BASED ASSAYS ARE USED TO DETECT ORGAN-SPECIFIC TOXICITY
TABLE 40 ORGAN TOXICITY: MARKET, BY GEOGRAPHY, 2019–2021 (USD MILLION)
TABLE 41 ORGAN TOXICITY: TE MARKET, BY GEOGRAPHY, 2022–2027 (USD MILLION)
8.8 PHOTOTOXICITY
8.8.1 VALIDATED NON-ANIMAL METHODS ARE USED TO EVALUATE PHOTO SAFETY OF COSMETICS, PHARMACEUTICALS, & CHEMICALS
TABLE 42 PHOTOTOXICITY: MARKET, BY GEOGRAPHY, 2019–2021 (USD MILLION)
TABLE 43 PHOTOTOXICITY: MARKET, BY GEOGRAPHY, 2022–2027 (USD MILLION)
8.9 DERMAL TOXICITY
8.9.1 IN VITRO METHODS FOR DERMAL TOXICITY TESTING ARE EXPECTED TO GAIN RECOGNITION IN COMING YEARS
TABLE 44 DERMAL TOXICITY: MARKET, BY GEOGRAPHY, 2019–2021 (USD MILLION)
TABLE 45 DERMAL TOXICITY: MARKET, BY GEOGRAPHY, 2022–2027 (USD MILLION)
8.10 OTHER ENDPOINTS & TESTS
TABLE 46 OTHER ENDPOINTS & TESTS: MARKET, BY GEOGRAPHY, 2019–2021 (USD MILLION)
TABLE 47 OTHER ENDPOINTS & TESTS: MARKET, BY GEOGRAPHY, 2022–2027 (USD MILLION)
9 IN VITRO TOXICOLOGY TESTING MARKET, BY TECHNOLOGY (Page No. - 123)
9.1 INTRODUCTION
FIGURE 24 TOXICOGENOMICS SEGMENT TO EXHIBIT HIGHEST CAGR IN MARKET DURING FORECAST PERIOD
TABLE 48 GLOBAL MARKET, BY TECHNOLOGY, 2019–2021 (USD MILLION)
TABLE 49 GLOBAL MARKET, BY TECHNOLOGY, 2022–2027 (USD MILLION)
9.2 CELL CULTURE
9.2.1 CELL- & TISSUE-BASED TECHNOLOGIES ARE WIDELY ADOPTED IN IN VITRO TESTING
TABLE 50 CELL CULTURE: MARKET, BY GEOGRAPHY, 2019–2021 (USD MILLION)
TABLE 51 CELL CULTURE: MARKET, BY GEOGRAPHY, 2022–2027 (USD MILLION)
9.3 HIGH-THROUGHPUT
9.3.1 INCREASING USE OF HIGH-CONTENT IMAGING TECHNOLOGIES IN TOXICITY TESTING BOOSTS MARKET GROWTH
TABLE 52 HIGH-THROUGHPUT: MARKET, BY GEOGRAPHY, 2019–2021 (USD MILLION)
TABLE 53 HIGH-THROUGHPUT: MARKET, BY GEOGRAPHY, 2022–2027 (USD MILLION)
9.4 TOXICOGENOMICS
9.4.1 IMPROVEMENTS IN PROTEOMIC TECHNOLOGIES ENHANCE STUDY OF GENES & PROTEIN ACTIVITIES DURING TOXICITY ANALYSIS
TABLE 54 TOXICOGENOMICS: MARKET, BY GEOGRAPHY, 2019–2021 (USD MILLION)
TABLE 55 TOXICOGENOMICS: MARKET, BY GEOGRAPHY, 2022–2027 (USD MILLION)
10 IN-VITRO TOXICOLOGY TESTING MARKET, BY INDUSTRY (Page No. - 131)
10.1 INTRODUCTION
FIGURE 25 PHARMACEUTICALS & BIOPHARMACEUTICALS INDUSTRY TO HOLD LARGEST MARKET SHARE THROUGHOUT FORECAST PERIOD
TABLE 56 GLOBAL MARKET, BY INDUSTRY, 2019–2021 (USD MILLION)
TABLE 57 IN VITRO TOXICOLOGY TESTING MARKET, BY INDUSTRY, 2022–2027 (USD MILLION)
10.2 COVID-19 IMPACT, BY INDUSTRY
10.3 PHARMACEUTICALS & BIOPHARMACEUTICALS
10.3.1 DRUG ATTRITION RATE LEADS TO HIGH ADOPTION OF IN VITRO TESTING ASSAYS IN EARLY STAGES OF DRUG DEVELOPMENT
TABLE 58 PHARMACEUTICALS & BIOPHARMACEUTICALS: GLOBAL MARKET, BY GEOGRAPHY, 2019–2021 (USD MILLION)
TABLE 59 PHARMACEUTICALS & BIOPHARMACEUTICALS: GLOBAL MARKET, BY GEOGRAPHY, 2022–2027 (USD MILLION)
10.4 COSMETICS & HOUSEHOLD PRODUCTS
10.4.1 BAN ON ANIMAL TESTING LEADING TO ADOPTION OF IN VITRO ASSAYS FOR SAFETY TESTING
TABLE 60 COSMETICS & HOUSEHOLD PRODUCTS: GLOBAL MARKET, BY GEOGRAPHY, 2019–2021 (USD MILLION)
TABLE 61 COSMETICS & HOUSEHOLD PRODUCTS: GLOBAL MARKET, BY GEOGRAPHY, 2022–2027 (USD MILLION)
10.5 FOOD
10.5.1 INCREASING FOCUS ON FOOD SAFETY DRIVES REQUIREMENT FOR IN VITRO TOXICOLOGY TESTING PRODUCTS
TABLE 62 TYPES OF TOXICOLOGY TESTS IN FOOD
TABLE 63 FOOD: MARKET, BY GEOGRAPHY, 2019–2021 (USD MILLION)
TABLE 64 FOOD: MARKET, BY GEOGRAPHY, 2022–2027 (USD MILLION)
10.6 CHEMICALS
10.6.1 INCREASING FOCUS ON ORGANOID-BASED IN VITRO APPROACHES FOR CHEMICALS TESTING PROPELS MARKET GROWTH
TABLE 65 CHEMICALS: MARKET, BY GEOGRAPHY, 2019–2021 (USD MILLION)
TABLE 66 CHEMICALS: MARKET, BY GEOGRAPHY, 2022–2027 (USD MILLION)
11 IN VITRO TOXICOLOGY TESTING MARKET, BY METHOD (Page No. - 144)
11.1 INTRODUCTION
FIGURE 26 IN-SILICO MODELS TO RECORD HIGHEST CAGR IN MARKET DURING FORECAST PERIOD
TABLE 67 GLOBAL MARKET, BY METHOD, 2019–2021 (USD MILLION)
TABLE 68 GLOBAL MARKET, BY METHOD, 2022–2027 (USD MILLION)
11.2 CELLULAR ASSAYS
11.2.1 DEVELOPMENT OF MULTI-PARAMETER ASSAYS WILL PROVIDE SIGNIFICANT GROWTH OPPORTUNITIES TO MARKET PLAYERS
TABLE 69 CELLULAR ASSAYS: MARKET, BY GEOGRAPHY, 2019–2021 (USD MILLION)
TABLE 70 CELLULAR ASSAYS: MARKET, BY GEOGRAPHY, 2022–2027 (USD MILLION)
11.3 BIOCHEMICAL ASSAYS
11.3.1 BIOCHEMICAL ASSAYS ARE ADOPTED AT HIGHER RATE IN PHARMACEUTICALS INDUSTRY THAN CHEMICALS AND FOOD INDUSTRIES
TABLE 71 BIOCHEMICAL ASSAYS: MARKET, BY GEOGRAPHY, 2019–2021 (USD MILLION)
TABLE 72 BIOCHEMICAL ASSAYS: MARKET, BY GEOGRAPHY, 2022–2027 (USD MILLION)
11.4 IN-SILICO MODELS
11.4.1 IN-SILICO MODELS ARE EXPECTED TO WITNESS HIGHEST CAGR FROM 2022 TO 2027
TABLE 73 IN-SILICO MODELS: MARKET, BY GEOGRAPHY, 2019–2021 (USD MILLION)
TABLE 74 IN-SILICO MODELS: MARKET, BY GEOGRAPHY, 2022–2027 (USD MILLION)
11.5 EX-VIVO MODELS
11.5.1 EX-VIVO MODELS ARE WIDELY USED IN SKIN AND EYE TOXICOLOGY TESTING IN COSMETICS INDUSTRY
TABLE 75 EX-VIVO MODELS: IN-VITRO TOXICOLOGY TESTING MARKET, BY GEOGRAPHY, 2019–2021 (USD MILLION)
TABLE 76 EX-VIVO MODELS: MARKET, BY GEOGRAPHY, 2022–2027 (USD MILLION)
12 IN VITRO TOXICOLOGY TESTING MARKET, BY GEOGRAPHIC ANALYSIS (Page No. - 155)
12.1 INTRODUCTION
12.2 COVID-19 IMPACT, BY REGION
FIGURE 27 GLOBAL MARKET: GEOGRAPHIC SNAPSHOT
TABLE 77 GLOBAL MARKET, BY REGION, 2019–2021 (USD MILLION)
TABLE 78 GLOBAL MARKET, BY REGION, 2022–2027 (USD MILLION)
12.3 EUROPE
FIGURE 28 EUROPE: IN VITRO TOXICOLOGY TESTING MARKET SNAPSHOT
TABLE 79 EUROPE: MARKET, BY COUNTRY, 2019–2021 (USD MILLION)
TABLE 80 EUROPE: MARKET, BY COUNTRY, 2022–2027 (USD MILLION)
TABLE 81 EUROPE: MARKET, BY PRODUCT & SERVICE, 2019–2021 (USD MILLION)
TABLE 82 EUROPE: MARKET, BY PRODUCT & SERVICE, 2022–2027 (USD MILLION)
TABLE 83 EUROPE: IN VITRO TOXICOLOGY TESTING ASSAYS MARKET, BY TYPE, 2019–2021 (USD MILLION)
TABLE 84 EUROPE: IN VITRO TOXICOLOGY TESTING ASSAYS MARKET, BY TYPE, 2022–2027 (USD MILLION)
TABLE 85 EUROPE: MARKET, BY TOXICOLOGY ENDPOINT & TEST, 2019–2021 (USD MILLION)
TABLE 86 EUROPE: MARKET, BY TOXICOLOGY ENDPOINT & TEST, 2022–2027 (USD MILLION)
TABLE 87 EUROPE: MARKET, BY TECHNOLOGY, 2019–2021 (USD MILLION)
TABLE 88 EUROPE: MARKET, BY TECHNOLOGY, 2022–2027 (USD MILLION)
TABLE 89 EUROPE: MARKET, BY INDUSTRY, 2019–2021 (USD MILLION)
TABLE 90 EUROPE: MARKET, BY INDUSTRY, 2022–2027 (USD MILLION)
TABLE 91 EUROPE: MARKET, BY METHOD, 2019–2021 (USD MILLION)
TABLE 92 EUROPE: MARKET, BY METHOD, 2022–2027 (USD MILLION)
12.3.1 GERMANY
12.3.1.1 Germany holds the largest share of the European market
TABLE 93 GERMANY: IN VITRO TOXICOLOGY TESTING MARKET, BY PRODUCT & SERVICE, 2019–2021 (USD MILLION)
TABLE 94 GERMANY: MARKET, BY PRODUCT & SERVICE, 2022–2027 (USD MILLION)
TABLE 95 GERMANY: IN VITRO TOXICOLOGY TESTING ASSAYS MARKET, BY TYPE, 2019–2021 (USD MILLION)
TABLE 96 GERMANY: IN VITRO TOXICOLOGY TESTING ASSAYS MARKET, BY TYPE, 2022–2027 (USD MILLION)
TABLE 97 GERMANY: MARKET, BY TOXICOLOGY ENDPOINT & TEST, 2019–2021 (USD MILLION)
TABLE 98 GERMANY: MARKET, BY TOXICOLOGY ENDPOINT & TEST, 2022–2027 (USD MILLION)
TABLE 99 GERMANY: MARKET, BY TECHNOLOGY, 2019–2021 (USD MILLION)
TABLE 100 GERMANY: MARKET, BY TECHNOLOGY, 2022–2027 (USD MILLION)
TABLE 101 GERMANY: MARKET, BY INDUSTRY, 2019–2021 (USD MILLION)
TABLE 102 GERMANY: MARKET, BY INDUSTRY, 2022–2027 (USD MILLION)
TABLE 103 GERMANY: MARKET, BY METHOD, 2019–2021 (USD MILLION)
TABLE 104 GERMANY: MARKET, BY METHOD, 2022–2027 (USD MILLION)
12.3.2 UK
12.3.2.1 Rising awareness, growing R&D, and increasing collaborations for In Vitro Toxicology Testing Market are key indicators of market growth in UK
TABLE 105 UK: MARKET, BY PRODUCT & SERVICE, 2019–2021 (USD MILLION)
TABLE 106 UK: MARKET, BY PRODUCT & SERVICE, 2022–2027 (USD MILLION)
TABLE 107 UK: IN VITRO TOXICOLOGY TESTING ASSAYS MARKET, BY TYPE, 2019–2021 (USD MILLION)
TABLE 108 UK: IN VITRO TOXICOLOGY TESTING ASSAYS MARKET, BY TYPE, 2022-2027 (USD MILLION)
TABLE 109 UK: MARKET, BY TOXICOLOGY ENDPOINT & TEST, 2019–2021 (USD MILLION)
TABLE 110 UK: MARKET, BY TOXICOLOGY ENDPOINT & TEST, 2022–2027 (USD MILLION)
TABLE 111 UK: MARKET, BY TECHNOLOGY, 2019–2021 (USD MILLION)
TABLE 112 UK: MARKET, BY TECHNOLOGY, 2022–2027 (USD MILLION)
TABLE 113 UK: MARKET, BY INDUSTRY, 2019–2021 (USD MILLION)
TABLE 114 UK: MARKET, BY INDUSTRY, 2022–2027 (USD MILLION)
TABLE 115 UK: MARKET, BY METHOD, 2019–2021 (USD MILLION)
TABLE 116 UK: IN VITRO TOXICOLOGY TESTING, BY METHOD, 2022–2027 (USD MILLION)
12.3.3 FRANCE
12.3.3.1 Proteomics research initiatives supported by government aid market growth in France
TABLE 117 FRANCE: MARKET, BY PRODUCT & SERVICE, 2019–2021 (USD MILLION)
TABLE 118 FRANCE: MARKET, BY PRODUCT & SERVICE, 2022–2027 (USD MILLION)
TABLE 119 FRANCE: IN VITRO TOXICOLOGY TESTING ASSAYS MARKET, BY TYPE, 2019–2021 (USD MILLION)
TABLE 120 FRANCE: IN VITRO TOXICOLOGY TESTING ASSAYS MARKET, BY TYPE, 2022–2027 (USD MILLION)
TABLE 121 FRANCE: MARKET, BY TOXICOLOGY ENDPOINT & TEST, 2019–2021 (USD MILLION)
TABLE 122 FRANCE: MARKET, BY TOXICOLOGY ENDPOINT & TEST, 2022–2027 (USD MILLION)
TABLE 123 FRANCE: MARKET, BY TECHNOLOGY, 2019–2021 (USD MILLION)
TABLE 124 FRANCE: MARKET, BY TECHNOLOGY, 2022–2027 (USD MILLION)
TABLE 125 FRANCE: MARKET, BY INDUSTRY, 2019–2021 (USD MILLION)
TABLE 126 FRANCE: MARKET, BY INDUSTRY, 2022–2027 (USD MILLION)
TABLE 127 FRANCE: MARKET, BY METHOD, 2019–2021 (USD MILLION)
TABLE 128 FRANCE: IN VITRO TOXICOLOGY TESTING MARKET, BY METHOD, 2022–2027 (USD MILLION)
12.3.4 ITALY
12.3.4.1 Italian market growth is mainly driven by increased volume of life sciences research
TABLE 129 ITALY: IN VITRO TOXICITY TESTING MARKET, BY PRODUCT & SERVICE, 2019–2021 (USD MILLION)
TABLE 130 ITALY: MARKET, BY PRODUCT & SERVICE, 2022–2027 (USD MILLION)
TABLE 131 ITALY: IN VITRO TOXICOLOGY TESTING ASSAYS MARKET, BY TYPE, 2019–2021 (USD MILLION)
TABLE 132 ITALY: IN VITRO TOXICOLOGY TESTING ASSAYS MARKET, BY TYPE, 2022–2027 (USD MILLION)
TABLE 133 ITALY: MARKET, BY TOXICOLOGY ENDPOINT & TEST, 2019–2021 (USD MILLION)
TABLE 134 ITALY: MARKET, BY TOXICOLOGY ENDPOINT & TEST, 2022–2027 (USD MILLION)
TABLE 135 ITALY: MARKET, BY TECHNOLOGY, 2019–2021 (USD MILLION)
TABLE 136 ITALY: MARKET, BY TECHNOLOGY, 2022–2027 (USD MILLION)
TABLE 137 ITALY: MARKET, BY INDUSTRY, 2019–2021 (USD MILLION)
TABLE 138 ITALY: MARKET, BY INDUSTRY, 2022–2027 (USD MILLION)
TABLE 139 ITALY: MARKET, BY METHOD, 2019–2021 (USD MILLION)
TABLE 140 ITALY: IN VITRO TOXICOLOGY TESTING MARKET, BY METHOD, 2022–2027 (USD MILLION)
12.3.5 SPAIN
12.3.5.1 Spain’s growing Chemicals industry stimulates in-vitro toxicology testing market growth
TABLE 141 SPAIN: MARKET, BY PRODUCT & SERVICE, 2019–2021 (USD MILLION)
TABLE 142 SPAIN: MARKET, BY PRODUCT & SERVICE, 2022–2027 (USD MILLION)
TABLE 143 SPAIN: IN VITRO TOXICOLOGY TESTING ASSAYS MARKET, BY TYPE, 2019–2021 (USD MILLION)
TABLE 144 SPAIN: IN VITRO TOXICOLOGY TESTING ASSAYS MARKET, BY TYPE, 2022–2027 (USD MILLION)
TABLE 145 SPAIN: MARKET, BY TOXICOLOGY ENDPOINT & TEST, 2019–2021 (USD MILLION)
TABLE 146 SPAIN: MARKET, BY TOXICOLOGY ENDPOINT & TEST, 2022–2027 (USD MILLION)
TABLE 147 SPAIN: MARKET, BY TECHNOLOGY, 2019–2021 (USD MILLION)
TABLE 148 SPAIN: MARKET, BY TECHNOLOGY, 2022–2027 (USD MILLION)
TABLE 149 SPAIN: MARKET, BY INDUSTRY, 2019–2021 (USD MILLION)
TABLE 150 SPAIN: MARKET, BY INDUSTRY, 2022–2027 (USD MILLION)
TABLE 151 SPAIN: MARKET, BY METHOD, 2019–2021 (USD MILLION)
TABLE 152 SPAIN: IN VITRO TOXICOLOGY TESTING MARKET, BY METHOD, 2022–2027 (USD MILLION)
12.3.6 REST OF EUROPE
TABLE 153 REST OF EUROPE: MARKET, BY PRODUCT & SERVICE, 2019–2021 (USD MILLION)
TABLE 154 REST OF EUROPE: MARKET, BY PRODUCT & SERVICE, 2022–2027 (USD MILLION)
TABLE 155 REST OF EUROPE: IN VITRO TOXICOLOGY TESTING ASSAYS MARKET, BY TYPE, 2019–2021 (USD MILLION)
TABLE 156 REST OF EUROPE: IN VITRO TOXICOLOGY TESTING ASSAYS MARKET, BY TYPE, 2022–2027 (USD MILLION)
TABLE 157 REST OF EUROPE: MARKET, BY TOXICOLOGY ENDPOINT & TEST, 2019–2021 (USD MILLION)
TABLE 158 REST OF EUROPE: MARKET, BY TOXICOLOGY ENDPOINT & TEST, 2022–2027 (USD MILLION)
TABLE 159 REST OF EUROPE: MARKET, BY TECHNOLOGY, 2019–2021 (USD MILLION)
TABLE 160 REST OF EUROPE: MARKET, BY TECHNOLOGY, 2022–2027 (USD MILLION)
TABLE 161 REST OF EUROPE: MARKET, BY INDUSTRY, 2019–2021 (USD MILLION)
TABLE 162 REST OF EUROPE: MARKET, BY INDUSTRY, 2022–2027 (USD MILLION)
TABLE 163 REST OF EUROPE: MARKET, BY METHOD, 2019–2021 (USD MILLION)
TABLE 164 REST OF EUROPE: IN VITRO TOXICOLOGY TESTING MARKET, BY METHOD, 2022–2027 (USD MILLION)
12.4 NORTH AMERICA
FIGURE 29 NORTH AMERICA: MARKET SNAPSHOT
TABLE 165 NORTH AMERICA: MARKET, BY COUNTRY, 2019–2021 (USD MILLION)
TABLE 166 NORTH AMERICA: MARKET, BY COUNTRY, 2022–2027 (USD MILLION)
TABLE 167 NORTH AMERICA: MARKET, BY PRODUCT & SERVICE, 2019–2021 (USD MILLION)
TABLE 168 NORTH AMERICA: MARKET, BY PRODUCT & SERVICE, 2022–2027 (USD MILLION)
TABLE 169 NORTH AMERICA: IN VITRO TOXICOLOGY TESTING ASSAYS MARKET, BY TYPE, 2019–2021 (USD MILLION)
TABLE 170 NORTH AMERICA: IN VITRO TOXICOLOGY TESTING ASSAYS MARKET, BY TYPE, 2022–2027 (USD MILLION)
TABLE 171 NORTH AMERICA: MARKET, BY TOXICOLOGY ENDPOINT & TEST, 2019–2021 (USD MILLION)
TABLE 172 NORTH AMERICA: MARKET, BY TOXICOLOGY ENDPOINT & TEST, 2022–2027 (USD MILLION)
TABLE 173 NORTH AMERICA: MARKET, BY TECHNOLOGY, 2019–2021 (USD MILLION)
TABLE 174 NORTH AMERICA: MARKET, BY TECHNOLOGY, 2022–2027 (USD MILLION)
TABLE 175 NORTH AMERICA: MARKET, BY INDUSTRY, 2019–2021 (USD MILLION)
TABLE 176 NORTH AMERICA: MARKET, BY INDUSTRY, 2022–2027 (USD MILLION)
TABLE 177 NORTH AMERICA: MARKET, BY METHOD, 2019–2021 (USD MILLION)
TABLE 178 NORTH AMERICA: IN VITRO TOXICOLOGY TESTING MARKET, BY METHOD, 2022–2027 (USD MILLION)
12.4.1 US
12.4.1.1 US dominates North American market due to growing focus on biomarker discovery and research in structure-based drug design
TABLE 179 US: IN VITRO TOXICITY TESTING MARKET, BY PRODUCT & SERVICE, 2019–2021 (USD MILLION)
TABLE 180 US: MARKET, BY PRODUCT & SERVICE, 2022–2027 (USD MILLION)
TABLE 181 US: IN VITRO TOXICOLOGY TESTING ASSAYS MARKET, BY TYPE, 2019–2021 (USD MILLION)
TABLE 182 US: IN VITRO TOXICOLOGY TESTING ASSAYS MARKET, BY TYPE, 2022–2027 (USD MILLION)
TABLE 183 US: MARKET, BY TOXICOLOGY ENDPOINT & TEST, 2019–2021 (USD MILLION)
TABLE 184 US: MARKET, BY TOXICOLOGY ENDPOINT & TEST, 2022–2027 (USD MILLION)
TABLE 185 US: MARKET, BY TECHNOLOGY, 2019–2021 (USD MILLION)
TABLE 186 US: MARKET, BY TECHNOLOGY, 2022–2027 (USD MILLION)
TABLE 187 US: MARKET, BY INDUSTRY, 2019–2021 (USD MILLION)
TABLE 188 US: MARKET, BY INDUSTRY, 2022–2027 (USD MILLION)
TABLE 189 US: MARKET, BY METHOD, 2019–2021 (USD MILLION)
TABLE 190 US: MARKET, BY METHOD, 2022–2027 (USD MILLION)
12.4.2 CANADA
12.4.2.1 Strong support to carry out R&D in pharmaceutical and proteomics fields fosters market growth in Canada
TABLE 191 CANADA: MARKET, BY PRODUCT & SERVICE, 2019–2021 (USD MILLION)
TABLE 192 CANADA: MARKET, BY PRODUCT & SERVICE, 2022–2027 (USD MILLION)
TABLE 193 CANADA: IN VITRO TOXICOLOGY TESTING ASSAYS MARKET, BY TYPE, 2019–2021 (USD MILLION)
TABLE 194 CANADA: IN VITRO TOXICOLOGY TESTING ASSAYS MARKET, BY TYPE, 2022–2027 (USD MILLION)
TABLE 195 CANADA: MARKET, BY TOXICOLOGY ENDPOINT & TEST, 2019–2021 (USD MILLION)
TABLE 196 CANADA: MARKET, BY TOXICOLOGY ENDPOINT & TEST, 2022–2027 (USD MILLION)
TABLE 197 CANADA: MARKET, BY TECHNOLOGY, 2019–2021 (USD MILLION)
TABLE 198 CANADA: MARKET, BY TECHNOLOGY, 2022–2027 (USD MILLION)
TABLE 199 CANADA: MARKET, BY INDUSTRY, 2019–2021 (USD MILLION)
TABLE 200 CANADA: MARKET, BY INDUSTRY, 2022–2027 (USD MILLION)
TABLE 201 CANADA: MARKET, BY METHOD, 2019–2021 (USD MILLION)
TABLE 202 CANADA: MARKET, BY METHOD, 2022–2027 (USD MILLION)
12.5 ASIA PACIFIC
FIGURE 30 ASIA PACIFIC: IN-VITRO TOXICOLOGY TESTING MARKET SNAPSHOT
TABLE 203 ASIA PACIFIC:MARKET, BY COUNTRY, 2019–2021 (USD MILLION)
TABLE 204 ASIA PACIFIC: MARKET, BY COUNTRY, 2022–2027 (USD MILLION)
TABLE 205 ASIA PACIFIC: MARKET, BY PRODUCT & SERVICE, 2019–2021 (USD MILLION)
TABLE 206 ASIA PACIFIC: MARKET, BY PRODUCT & SERVICE, 2022–2027 (USD MILLION)
TABLE 207 ASIA PACIFIC: IN VITRO TOXICOLOGY TESTING ASSAYS MARKET, BY TYPE, 2019–2021 (USD MILLION)
TABLE 208 ASIA PACIFIC: IN VITRO TOXICOLOGY TESTING ASSAYS MARKET, BY TYPE, 2022–2027 (USD MILLION)
TABLE 209 ASIA PACIFIC: MARKET, BY TOXICOLOGY ENDPOINT & TEST, 2019–2021 (USD MILLION)
TABLE 210 ASIA PACIFIC: MARKET, BY TOXICOLOGY ENDPOINT & TEST, 2022–2027 (USD MILLION)
TABLE 211 ASIA PACIFIC: MARKET, BY TECHNOLOGY, 2019–2021 (USD MILLION)
TABLE 212 ASIA PACIFIC: MARKET, BY TECHNOLOGY, 2022–2027 (USD MILLION)
TABLE 213 ASIA PACIFIC: MARKET, BY INDUSTRY, 2019–2021 (USD MILLION)
TABLE 214 ASIA PACIFIC: MARKET, BY INDUSTRY, 2022–2027 (USD MILLION)
TABLE 215 ASIA PACIFIC: MARKET, BY METHOD, 2019–2021 (USD MILLION)
TABLE 216 ASIA PACIFIC: IN VITRO TOXICOLOGY TESTING MARKET, BY METHOD, 2022–2027 (USD MILLION)
12.5.1 CHINA
12.5.1.1 Increasing international pressure to ban animal testing methods will propel market growth in coming years
TABLE 217 CHINA: MARKET, BY PRODUCT & SERVICE, 2019–2021 (USD MILLION)
TABLE 218 CHINA: MARKET, BY PRODUCT & SERVICE, 2022–2027 (USD MILLION)
TABLE 219 CHINA: IN VITRO TOXICOLOGY TESTING ASSAYS MARKET, BY TYPE, 2019–2021 (USD MILLION)
TABLE 220 CHINA: IN VITRO TOXICOLOGY TESTING ASSAYS MARKET, BY TYPE, 2022–2027 (USD MILLION)
TABLE 221 CHINA: MARKET, BY TOXICOLOGY ENDPOINT & TEST, 2019–2021 (USD MILLION)
TABLE 222 CHINA: MARKET, BY TOXICOLOGY ENDPOINT & TEST, 2022–2027 (USD MILLION)
TABLE 223 CHINA: MARKET, BY TECHNOLOGY, 2019–2021 (USD MILLION)
TABLE 224 CHINA: MARKET, BY TECHNOLOGY, 2022–2027 (USD MILLION)
TABLE 225 CHINA: MARKET, BY INDUSTRY, 2019–2021 (USD MILLION)
TABLE 226 CHINA: MARKET, BY INDUSTRY, 2022–2027 (USD MILLION)
TABLE 227 CHINA: MARKET, BY METHOD, 2019–2021 (USD MILLION)
TABLE 228 CHINA: MARKET, BY METHOD, 2022–2027 (USD MILLION)
12.5.2 JAPAN
12.5.2.1 Use of artificial skin patches and plates of cultured human cells has increased demand for in vitro toxicology testing products in Japan
TABLE 229 JAPAN: IN VITRO TOXICITY TESTING MARKET, BY PRODUCT & SERVICE, 2019–2021 (USD MILLION)
TABLE 230 JAPAN: MARKET, BY PRODUCT & SERVICE, 2022–2027 (USD MILLION)
TABLE 231 JAPAN: IN VITRO TOXICOLOGY TESTING ASSAYS MARKET, BY TYPE, 2019–2021 (USD MILLION)
TABLE 232 JAPAN: IN VITRO TOXICOLOGY TESTING ASSAYS MARKET, BY TYPE, 2022–2027 (USD MILLION)
TABLE 233 JAPAN: MARKET, BY TOXICOLOGY ENDPOINT & TEST, 2019–2021 (USD MILLION)
TABLE 234 JAPAN: MARKET, BY TOXICOLOGY ENDPOINT & TEST, 2022–2027 (USD MILLION)
TABLE 235 JAPAN: MARKET, BY TECHNOLOGY, 2019–2021 (USD MILLION)
TABLE 236 JAPAN: MARKET, BY TECHNOLOGY, 2022–2027 (USD MILLION)
TABLE 237 JAPAN: MARKET, BY INDUSTRY, 2019–2021 (USD MILLION)
TABLE 238 JAPAN: MARKET, BY INDUSTRY, 2022–2027 (USD MILLION)
TABLE 239 JAPAN: MARKET, BY METHOD, 2019–2021 (USD MILLION)
TABLE 240 JAPAN: MARKET, BY METHOD, 2022–2027 (USD MILLION)
12.5.3 INDIA
12.5.3.1 Growing focus of universities on avoiding use of animals to test cosmetic products is likely to propel market growth
TABLE 241 INDIA: MARKET, BY PRODUCT & SERVICE, 2019–2021 (USD MILLION)
TABLE 242 INDIA: MARKET, BY PRODUCT & SERVICE, 2022–2027 (USD MILLION)
TABLE 243 INDIA: IN VITRO TOXICOLOGY TESTING ASSAYS MARKET, BY TYPE, 2019–2021 (USD MILLION)
TABLE 244 INDIA: IN VITRO TOXICOLOGY TESTING ASSAYS MARKET, BY TYPE, 2022–2027 (USD MILLION)
TABLE 245 INDIA: MARKET, BY TOXICOLOGY ENDPOINT & TEST, 2019–2021 (USD MILLION)
TABLE 246 INDIA: MARKET, BY TOXICOLOGY ENDPOINT & TEST, 2022–2027 (USD MILLION)
TABLE 247 INDIA: MARKET, BY TECHNOLOGY, 2019–2021 (USD MILLION)
TABLE 248 INDIA: MARKET, BY TECHNOLOGY, 2022–2027 (USD MILLION)
TABLE 249 INDIA: MARKET, BY INDUSTRY, 2019–2021 (USD MILLION)
TABLE 250 INDIA: MARKET, BY INDUSTRY, 2022–2027 (USD MILLION)
TABLE 251 INDIA: IN VITRO TOXICOLOGY TESTING MARKET, BY METHOD, 2019–2021 (USD MILLION)
TABLE 252 INDIA: IN VITRO TOXICOLOGY TESTING MARKET, BY METHOD, 2022–2027 (USD MILLION)
12.5.4 REST OF ASIA PACIFIC
TABLE 253 REST OF ASIA PACIFIC: IN VITRO TOXICITY TESTING MARKET, BY PRODUCT & SERVICE, 2019–2021 (USD MILLION)
TABLE 254 REST OF ASIA PACIFIC: MARKET, BY PRODUCT & SERVICE, 2022–2027 (USD MILLION)
TABLE 255 REST OF ASIA PACIFIC: IN VITRO TOXICOLOGY TESTING ASSAYS MARKET, BY TYPE, 2019–2021 (USD MILLION)
TABLE 256 REST OF ASIA PACIFIC: IN VITRO TOXICOLOGY TESTING ASSAYS MARKET, BY TYPE, 2022–2027 (USD MILLION)
TABLE 257 REST OF ASIA PACIFIC: MARKET, BY TOXICOLOGY ENDPOINT & TEST, 2019–2021 (USD MILLION)
TABLE 258 REST OF ASIA PACIFIC: MARKET, BY TOXICOLOGY ENDPOINT & TEST, 2022–2027 (USD MILLION)
TABLE 259 REST OF ASIA PACIFIC: MARKET, BY TECHNOLOGY, 2019–2021 (USD MILLION)
TABLE 260 REST OF ASIA PACIFIC: MARKET, BY TECHNOLOGY, 2022–2027 (USD MILLION)
TABLE 261 REST OF ASIA PACIFIC: MARKET, BY INDUSTRY, 2019–2021 (USD MILLION)
TABLE 262 REST OF ASIA PACIFIC: MARKET, BY INDUSTRY, 2022–2027 (USD MILLION)
TABLE 263 REST OF ASIA PACIFIC: MARKET, BY METHOD, 2019–2021 (USD MILLION)
TABLE 264 REST OF ASIA PACIFIC: MARKET, BY METHOD, 2022–2027 (USD MILLION)
12.6 LATIN AMERICA
12.6.1 LOW COST OF DRUG TRIALS HAVE MADE LATIN AMERICA POPULAR OUTSOURCING MARKET
TABLE 265 LATIN AMERICA: MARKET, BY PRODUCT & SERVICE, 2019–2021 (USD MILLION)
TABLE 266 LATIN AMERICA: MARKET, BY PRODUCT & SERVICE, 2022–2027 (USD MILLION)
TABLE 267 LATIN AMERICA: IN VITRO TOXICOLOGY TESTING ASSAYS MARKET, BY TYPE, 2019–2021 (USD MILLION)
TABLE 268 LATIN AMERICA: IN VITRO TOXICOLOGY TESTING ASSAYS MARKET, BY TYPE, 2022–2027 (USD MILLION)
TABLE 269 LATIN AMERICA: MARKET, BY TOXICOLOGY ENDPOINT & TEST, 2019–2021 (USD MILLION)
TABLE 270 LATIN AMERICA: MARKET, BY TOXICOLOGY ENDPOINT & TEST, 2022–2027 (USD MILLION)
TABLE 271 LATIN AMERICA: MARKET, BY TECHNOLOGY, 2019–2021 (USD MILLION)
TABLE 272 LATIN AMERICA: MARKET, BY TECHNOLOGY, 2022–2027 (USD MILLION)
TABLE 273 LATIN AMERICA: MARKET, BY INDUSTRY, 2019–2021 (USD MILLION)
TABLE 274 LATIN AMERICA: MARKET, BY INDUSTRY, 2022–2027 (USD MILLION)
TABLE 275 LATIN AMERICA: MARKET, BY METHOD, 2019–2021 (USD MILLION)
TABLE 276 LATIN AMERICA: IN VITRO TOXICOLOGY TESTING MARKET, BY METHOD, 2022–2027 (USD MILLION)
12.7 MIDDLE EAST & AFRICA
12.7.1 INCREASING R&D INVESTMENTS AND FOCUS ON DEVELOPMENT OF NEW DRUGS ARE CONTRIBUTING TO MARKET GROWTH
TABLE 277 MIDDLE EAST & AFRICA: IN-VITRO TOXICOLOGY TESTING MARKET, BY PRODUCT & SERVICE, 2019–2021 (USD MILLION)
TABLE 278 MIDDLE EAST & AFRICA: MARKET, BY PRODUCT & SERVICE, 2022–2027 (USD MILLION)
TABLE 279 MIDDLE EAST & AFRICA: IN VITRO TOXICOLOGY TESTING ASSAYS MARKET, BY TYPE, 2019–2021 (USD MILLION)
TABLE 280 MIDDLE EAST & AFRICA: IN VITRO TOXICOLOGY TESTING ASSAYS MARKET, BY TYPE, 2022–2027 (USD MILLION)
TABLE 281 MIDDLE EAST & AFRICA: MARKET, BY TOXICOLOGY ENDPOINT & TEST, 2019–2021 (USD MILLION)
TABLE 282 MIDDLE EAST & AFRICA: MARKET, BY TOXICOLOGY ENDPOINT & TEST, 2022–2027 (USD MILLION)
TABLE 283 MIDDLE EAST & AFRICA: MARKET, BY TECHNOLOGY, 2019–2021 (USD MILLION)
TABLE 284 MIDDLE EAST & AFRICA: MARKET, BY TECHNOLOGY, 2022–2027 (USD MILLION)
TABLE 285 MIDDLE EAST & AFRICA: MARKET, BY INDUSTRY, 2019–2021 (USD MILLION)
TABLE 286 MIDDLE EAST & AFRICA: MARKET, BY INDUSTRY, 2022–2027 (USD MILLION)
TABLE 287 MIDDLE EAST & AFRICA: MARKET, BY METHOD, 2019–2021 (USD MILLION)
TABLE 288 MIDDLE EAST & AFRICA: IN VITRO TOXICOLOGY TESTING MARKET, BY METHOD, 2022–2027 (USD MILLION)
13 COMPETITIVE LANDSCAPE (Page No. - 264)
13.1 OVERVIEW
13.2 KEY PLAYER STRATEGIES/RIGHT TO WIN
FIGURE 31 KEY DEVELOPMENTS IN IN-VITRO TOXICOLOGY TESTING MARKET, 2019–2022
13.3 MARKET SHARE ANALYSIS
FIGURE 32 GLOBAL MARKET SHARE, BY KEY PLAYER, 2021
TABLE 289 GLOBAL MARKET: DEGREE OF COMPETITION
13.4 REVENUE SHARE ANALYSIS OF THE TOP MARKET PLAYERS
13.5 COMPANY EVALUATION QUADRANT
13.5.1 STAR
13.5.2 EMERGING LEADER
13.5.3 PERVASIVE
13.5.4 PARTICIPANT
FIGURE 34 GLOBAL MARKET: COMPANY EVALUATION QUADRANT, 2021
13.6 COMPANY EVALUATION QUADRANT: START-UPS/SMES
13.6.1 PROGRESSIVE COMPANY
13.6.2 STARTING BLOCK
13.6.3 RESPONSIVE COMPANY
13.6.4 DYNAMIC COMPANY
FIGURE 35 IN VITRO TOXICITY MARKET: COMPANY EVALUATION QUADRANT FOR START-UPS/SMES, 2021
13.7 COMPANY FOOTPRINT ANALYSIS
13.7.1 COMPANY PRODUCT FOOTPRINT
TABLE 290 COMPANY PRODUCT FOOTPRINT: IN VITRO TOXICITY TESTING MARKET (2021)
13.8 COMPANY REGIONAL FOOTPRINT
TABLE 291 COMPANY REGIONAL FOOTPRINT: GLOBAL MARKET (2021)
13.9 COMPETITIVE BENCHMARKING OF STARTUP/SME PLAYERS
TABLE 292 GLOBAL MARKET: DETAILED LIST OF KEY STARTUP/SME PLAYERS
TABLE 293 GLOBAL MARKET: COMPETITIVE BENCHMARKING OF STARTUP/SME PLAYERS
13.10 COMPETITIVE SCENARIO
TABLE 294 PRODUCT LAUNCHES
TABLE 295 DEALS
TABLE 296 OTHER DEVELOPMENTS
14 COMPANY PROFILES (Page No. - 278)
14.1 MAJOR PLAYERS
(Business Overview, Products Offered, Recent Developments, and MnM View (Key strengths/Right to Win, Strategic Choices Made, and Weaknesses and Competitive Threats))*
14.1.1 THERMO FISHER SCIENTIFIC, INC.
TABLE 297 THERMO FISHER SCIENTIFIC, INC.: BUSINESS OVERVIEW
FIGURE 36 THERMO FISHER SCIENTIFIC, INC.: COMPANY SNAPSHOT (2021)
14.1.2 MERCK KGAA
TABLE 298 MERCK KGAA: BUSINESS OVERVIEW
FIGURE 37 MERCK KGAA: COMPANY SNAPSHOT (2021)
14.1.3 EUROFINS SCIENTIFIC SE
TABLE 299 EUROFINS SCIENTIFIC SE: BUSINESS OVERVIEW
FIGURE 38 EUROFINS SCIENTIFIC: COMPANY SNAPSHOT (2021)
14.1.4 GENERAL ELECTRIC COMPANY
TABLE 300 GENERAL ELECTRIC COMPANY: BUSINESS OVERVIEW
FIGURE 39 GENERAL ELECTRIC COMPANY: COMPANY SNAPSHOT (2021)
14.1.5 LABORATORY CORPORATION OF AMERICA HOLDINGS
TABLE 301 LABORATORY CORPORATION OF AMERICA HOLDINGS: BUSINESS OVERVIEW
FIGURE 40 LABORATORY CORPORATION OF AMERICA HOLDINGS: COMPANY SNAPSHOT (2021)
14.1.6 CHARLES RIVER LABORATORIES INTERNATIONAL, INC.
TABLE 302 CHARLES RIVER LABORATORIES INTERNATIONAL, INC.: BUSINESS OVERVIEW
FIGURE 41 CHARLES RIVER LABORATORIES INTERNATIONAL, INC.: COMPANY SNAPSHOT (2021)
14.1.7 SGS SA
TABLE 303 SGS SA: BUSINESS OVERVIEW
FIGURE 42 SGS SA: COMPANY SNAPSHOT (2021)
14.1.8 BIO-RAD LABORATORIES, INC.
TABLE 304 BIO-RAD LABORATORIES, INC.: BUSINESS OVERVIEW
FIGURE 43 BIO-RAD LABORATORIES, INC.: COMPANY SNAPSHOT (2021)
14.1.9 QIAGEN
TABLE 305 QIAGEN: BUSINESS OVERVIEW
FIGURE 44 QIAGEN: COMPANY SNAPSHOT (2021)
14.1.10 EVOTEC AG
TABLE 306 EVOTEC AG: BUSINESS OVERVIEW
FIGURE 45 EVOTEC AG: COMPANY SNAPSHOT (2021)
14.1.11 PROMEGA CORPORATION
TABLE 307 PROMEGA CORPORATION.: BUSINESS OVERVIEW
14.1.12 CATALENT, INC.
TABLE 308 CATALENT, INC.: BUSINESS OVERVIEW
FIGURE 46 CATALENT, INC.: COMPANY SNAPSHOT (2021)
14.2 OTHER COMPANIES
14.2.1 GENTRONIX LIMITED
TABLE 309 GENTRONIX LIMITED: COMPANY OVERVIEW
14.2.2 MB RESEARCH LABORATORIES
TABLE 310 MB RESEARCH LABORATORIES: COMPANY OVERVIEW
14.2.3 BIOIVT
TABLE 311 BIOIVT: COMPANY OVERVIEW
14.2.4 CREATIVE BIOLABS
TABLE 312 CREATIVE BIOLABS: COMPANY OVERVIEW
14.2.5 GVK BIOSCIENCES PRIVATE LIMITED
TABLE 313 GVK BIOSCIENCES PRIVATE LIMITED: COMPANY OVERVIEW
14.2.6 SHANGHAI MEDICILON INC.
TABLE 314 SHANGHAI MEDICILON INC.: COMPANY OVERVIEW
14.2.7 CREATIVE BIOARRAY
TABLE 315 CREATIVE BIOARRAY: COMPANY OVERVIEW
14.2.8 INSPHERO
TABLE 316 INSPHERO: COMPANY OVERVIEW
*Details on Business Overview, Products Offered, Recent Developments, and MnM View (Key strengths/Right to Win, Strategic Choices Made, and Weaknesses and Competitive Threats) might not be captured in case of unlisted companies.
15 RELATED MARKETS (Page No. - 345)
15.1 INTRODUCTION
15.2 IN VIVO TOXICITY MARKET
15.2.1 MARKET DEFINITION
15.2.2 LIMITATIONS
15.2.3 MARKET OVERVIEW
FIGURE 47 CONSUMABLES SEGMENT WILL CONTINUE TO DOMINATE THE IN VIVO TOXICOLOGY MARKET DURING THE FORECAST PERIOD
15.3 IN VIVO TOXICOLOGY MARKET, BY PRODUCT
15.3.1 CONSUMABLES
TABLE 317 IN VIVO TOXICITY CONSUMABLES MARKET, BY COUNTRY/REGION, 2015–2022 (USD MILLION)
15.3.2 INSTRUMENTS
TABLE 318 IN VIVO TOXICOLOGY INSTRUMENTS MARKET, BY COUNTRY/REGION, 2015–2022 (USD MILLION)
15.4 IN VIVO TOXICITY MARKET, BY TOXICITY ENDPOINT
15.4.1 IMMUNOTOXICITY
TABLE 319 IN VIVO TOXICOLOGY MARKET FOR IMMUNOTOXICITY, BY COUNTRY/REGION, 2015–2022 (USD MILLION)
15.4.2 SYSTEMIC TOXICITY
TABLE 320 IN VIVO TOXICOLOGY MARKET FOR SYSTEMIC TOXICITY, BY COUNTRY/REGION, 2015–2022 (USD MILLION)
15.4.3 CARCINOGENICITY
TABLE 321 IN VIVO TOXICOLOGY MARKET FOR CARCINOGENICITY, BY COUNTRY/REGION, 2015–2022 (USD MILLION)
15.4.4 GENOTOXICITY
TABLE 322 IN VIVO TOXICOLOGY MARKET FOR GENOTOXICITY, BY COUNTRY/REGION, 2015–2022 (USD MILLION)
15.4.5 DEVELOPMENTAL AND REPRODUCTIVE TOXICITY (DART)
TABLE 323 IN VIVO TOXICOLOGY MARKET FOR DEVELOPMENTAL AND REPRODUCTIVE TOXICITY, BY COUNTRY/REGION, 2015–2022 (USD MILLION)
15.4.6 OTHER TOXICITY ENDPOINTS
TABLE 324 IN VIVO TOXICOLOGY MARKET FOR OTHER TOXICITY ENDPOINTS, BY COUNTRY/REGION, 2015–2022 (USD MILLION)
15.5 IN VIVO TOXICITY MARKET, BY REGION
15.5.1 NORTH AMERICA
TABLE 325 NORTH AMERICA: IN VIVO TOXICOLOGY MARKET, BY TOXICOLOGY ENDPOINT, 2015–2022 (USD MILLION)
15.5.2 EUROPE
TABLE 326 EUROPE: IN VIVO TOXICOLOGY MARKET, BY TOXICOLOGY ENDPOINT, 2015–2022 (USD MILLION)
15.5.3 ASIA PACIFICASIA PACIFIC
TABLE 327 ASIA PACIFIC: IN VIVO TOXICOLOGY MARKET, BY TOXICOLOGY ENDPOINT, 2015–2022 (USD MILLION)
15.5.4 LATIN AMERICA
TABLE 328 LATIN AMERICA: IN VIVO TOXICOLOGY MARKET, BY TOXICOLOGY ENDPOINT, 2015–2022 (USD MILLION)
15.5.5 MIDDLE EAST & AFRICA
TABLE 329 MIDDLE EAST & AFRICA: IN VIVO TOXICOLOGY MARKET, BY TOXICOLOGY ENDPOINT, 2015–2022 (USD MILLION)
16 APPENDIX (Page No. - 360)
16.1 INSIGHTS OF INDUSTRY EXPERTS
16.2 DISCUSSION GUIDE
16.3 KNOWLEDGE STORE: MARKETSANDMARKETS’ SUBSCRIPTION PORTAL
16.4 AVAILABLE CUSTOMIZATIONS
16.5 RELATED REPORTS
16.6 AUTHOR DETAILS
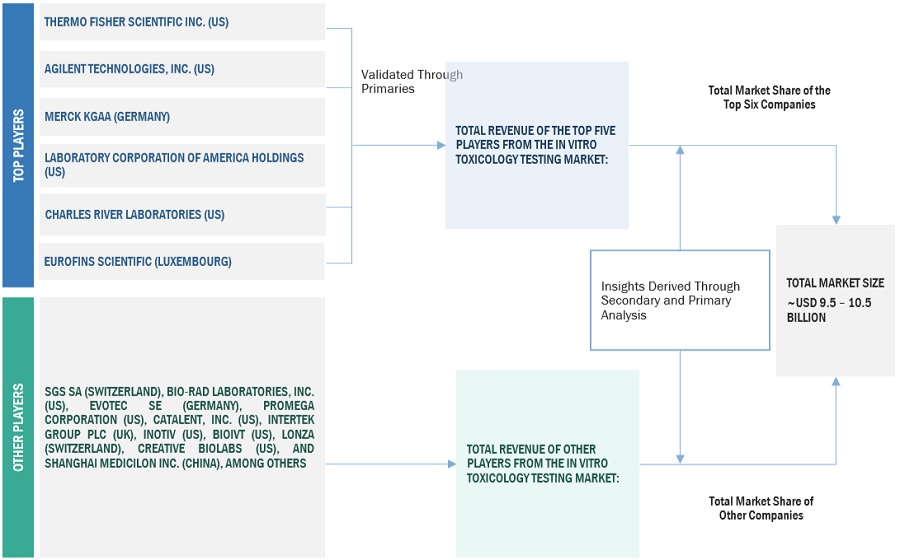
In this report, the global market for in vitro toxicology testing was arrived at after data triangulation from two different approaches as mentioned below. After completion of each approach, a weighted average of the two approaches was taken on the basis of the level of assumptions used in each approach.
Secondary Research
This research study involved the use of widespread secondary sources; directories; databases such as Factiva, Dun & Bradstreet, and Bloomberg Businessweek; white papers; annual reports; and companies’ house documents. Secondary research was used to identify and collect information for this extensive, technical, market-oriented, and commercial study of the global in vitro toxicity testing market. It was also used to obtain important information about the top players, market classification, and segmentation according to industry trends to the bottom-most level, geographic markets, key developments related to market, and technology perspectives.
Primary Research
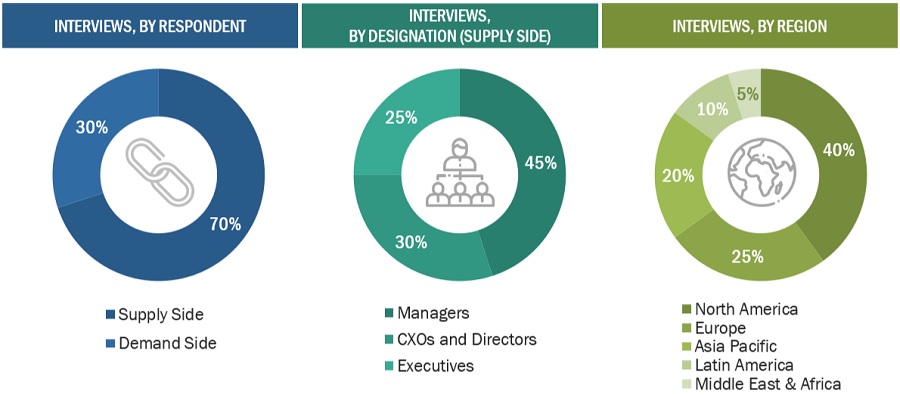
In the primary research process, various sources from both the supply and demand sides were interviewed to obtain qualitative and quantitative information for this report. The primary sources from the supply side include industry experts such as CEOs, vice presidents, marketing directors, technology and innovation directors, and related key executives from various key companies and organizations operating in the in vitro toxicology testing market. Primary sources from the demand side include scientists/researchers from academic & research institutes and government & private laboratories.
Primary research was conducted to validate the market segmentation, identify key players in the market, and gather insights on key industry trends and key market dynamics. A breakdown of the primary respondents is provided below:
To know about the assumptions considered for the study, download the pdf brochure
Market Size Estimation
The market size estimates and forecasts provided in this study are derived through a mix of the bottom-up approach (segmental analysis of major segments) and top-down approach (assessment of utilization/adoption/penetration trends, by product and service segment along with the technology, toxicity endpoint & tests, industry, method, and region).
Data Triangulation
After arriving at the market size, the total in vitro toxicology testing market was divided into several segments and subsegments. To complete the overall market engineering process and arrive at the exact statistics for all segments & subsegments, data triangulation, and market breakdown procedures were employed, wherever applicable.
Objectives of the Study
- To define, describe, segment, and forecast the global in vitro toxicology testing market by product & service, technology, toxicity endpoint & test, industry, method, and region
- To provide detailed information about the factors influencing market growth (such as drivers, restraints, opportunities, and challenges)
- To analyze micromarkets with respect to individual growth trends, prospects, and contributions to the overall in vitro toxicology testing market
- To analyze market opportunities for stakeholders and provide details of the competitive landscape for key players
- To profile key players in the global in vitro toxicology testing market and comprehensively analyze their core competencies and market shares
- To forecast the size of the in vitro toxicology testing market in five main regions along with their respective key countries, namely, North America, Europe, the Asia Pacific, Latin America, and the Middle East & Africa
- To benchmark players within the in vitro toxicology testing market using the "Competitive Leadership Mapping" framework, which analyzes market players on various parameters within the broad categories of business and product strategy
- To track and analyze competitive developments, such as acquisitions, new product launches, expansions, collaborations, and R&D activities of the leading players in the in vitro toxicology testing market
Available Customizations
With the given market data, MarketsandMarkets offers customizations as per the company’s specific needs. The following customization options are available for the report:
Company Information
- Detailed analysis and profiling of additional market players (up to 5)
Geographic Analysis
- Further breakdown of the Rest of Asia Pacific in vitro toxicology testing market into South Korea, Australia, New Zealand, and others
- Further breakdown of the Rest of Europe in vitro toxicology testing market into Switzerland, Belgium, Russia, the Netherlands, and others
Growth opportunities and latent adjacency in In Vitro Toxicology Testing Market
Thanks for this amazing information. keep posting it.
In what way the global In Vitro Toxicology Testing Market is impacted by the COVID19?