The research process for this study included systematic gathering, recording, and analysis of data about customers and companies operating in the industrial sensor market. This process involved the extensive use of secondary sources, directories, and databases (Factiva, Oanda, and OneSource) for identifying and collecting valuable information for the comprehensive, technical, market-oriented, and commercial study of the industrial sensor market. In-depth interviews were conducted with primary respondents, including experts from core and related industries and preferred manufacturers, to obtain and verify critical qualitative and quantitative information as well as to assess growth prospects. Key players in the industrial sensor market were identified through secondary research, and their market rankings were determined through primary and secondary research. This research included studying annual reports of top players and interviewing key industry experts such as CEOs, directors, and marketing executives.
Secondary Research
In the secondary research process, various sources were used to identify and collect information important for this study. These include annual reports, press releases & investor presentations of companies, white papers, technology journals, certified publications, articles by recognized authors, directories, and databases.
Secondary research was mainly used to obtain key information about the industry's supply chain, the total pool of market players, the classification of the market according to industry trends to the bottom-most level, regional markets, and key developments from the market and technology-oriented perspectives.
Primary Research
Primary research was also conducted to identify the segmentation types, key players, competitive landscape, and key market dynamics, such as drivers, restraints, opportunities, challenges, and industry trends, along with key strategies adopted by players operating in the industrial sensor market. Extensive qualitative and quantitative analyses were performed on the complete market engineering process to list key information and insights throughout the report.
Extensive primary research has been conducted after acquiring knowledge about the industrial sensor market scenario through secondary research. Several primary interviews have been conducted with experts from both demand (end users) and supply side (industrial sensor manufacturers/providers) across four major geographic regions: North America, Europe, Asia Pacific, and RoW. Approximately 80% and 20% of the primary interviews were conducted from the supply and demand side, respectively. These primary data have been collected through questionnaires, emails, and telephonic interviews.

To know about the assumptions considered for the study, download the pdf brochure
Market Size Estimation
In the complete market engineering process, both top-down and bottom-up approaches were implemented, along with several data triangulation methods, to estimate and validate the size of the industrial sensor market and various other dependent submarkets. Key players in the market were identified through secondary research, and their market share in the respective regions was determined through primary and secondary research. This entire research methodology included the study of annual and financial reports of the top players, as well as interviews with experts (such as CEOs, VPs, directors, and marketing executives) for key insights (quantitative and qualitative).
All percentage shares, splits, and breakdowns were determined using secondary sources and verified through primary sources. All the possible parameters that affect the markets covered in this research study were accounted for, viewed in detail, verified through primary research, and analyzed to obtain the final quantitative and qualitative data. This data was consolidated and supplemented with detailed inputs and analysis from MarketsandMarkets and presented in this report.
Industrial Sensor Market: Bottom-Up Approach

Industrial Sensor Market: Top-down Approach

Data Triangulation
After arriving at the overall market size from the market size estimation process, as explained above, the total market has been split into several segments and subsegments. To complete the overall market engineering process and arrive at the exact statistics for all segments and subsegments, market breakdown and data triangulation procedures have been employed, wherever applicable. The data have been triangulated by studying various factors and trends from both the demand and supply sides. Along with this, the market has been validated using top-down and bottom-up approaches.
Market Definition
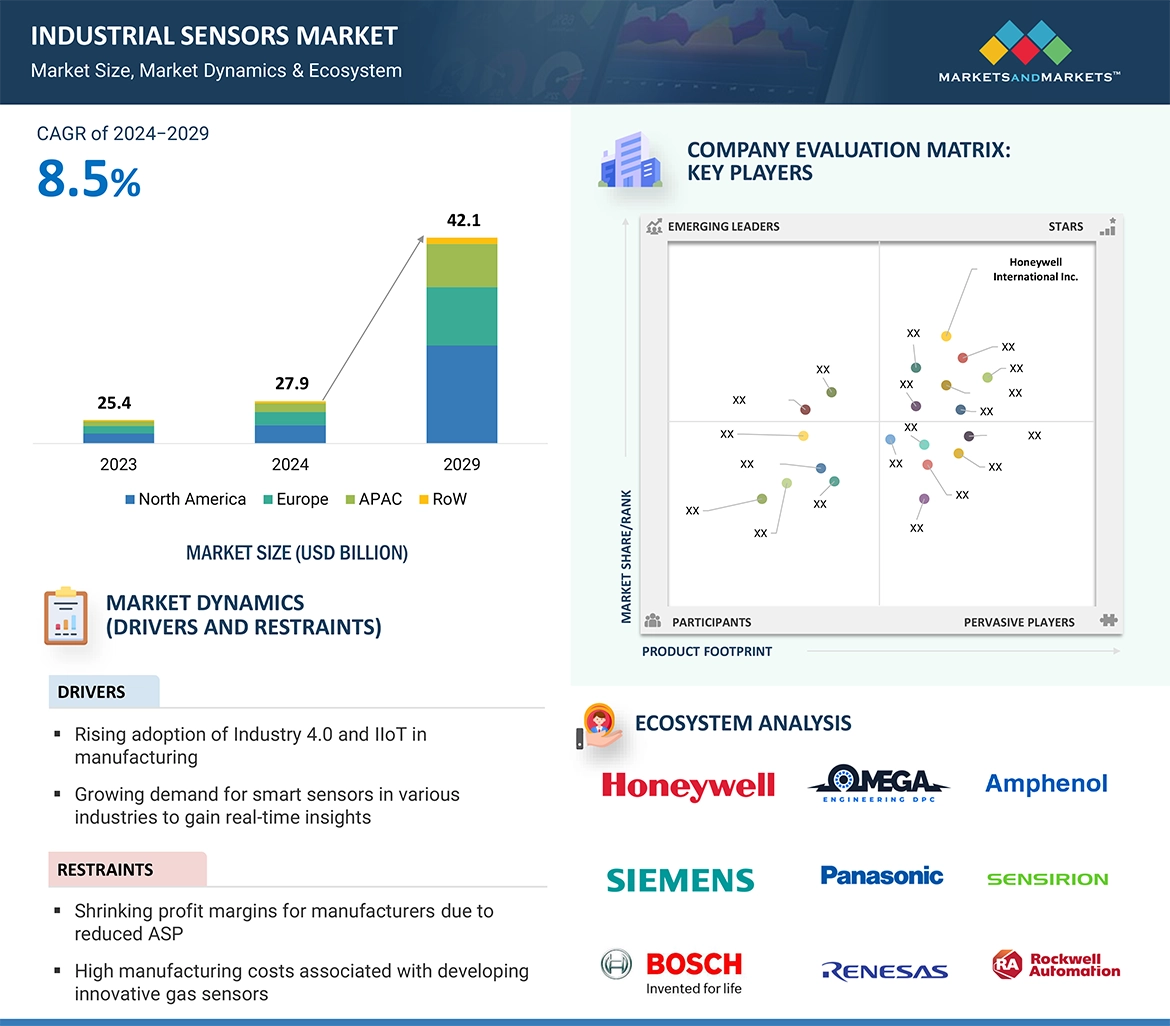
Industrial sensors are tiny devices that detect and measure physical changes in their environment, such as temperature, pressure, movement, and levels of liquids and solids. This information is then sent to computers or other systems, where it is used to control machines, monitor processes, and ensure safety and quality. These are specifically designed for industrial applications in several end-use industries such as manufacturing, oil & gas, chemicals, mining, and energy & power. A sensor is a device that detects and responds to specific inputs, e.g., pressure, position, level, gas, temperature, image humidity, flow, motion, and force, received from the physical environment.
Key Stakeholders
-
Raw material suppliers
-
Component manufacturers and providers
-
Sensor manufacturers and providers
-
Original equipment manufacturers (OEMs)
-
Technology solution providers
-
Application providers
-
System integrators
-
Middleware providers
-
Assembly, testing, and packaging vendors
-
Market research and consulting firms
-
Associations, organizations, forums, and alliances related to the industrial sensors industry
-
Technology investors
-
Governments, regulatory bodies, and financial institutions
-
Venture capitalists, private equity firms, and start-ups
-
End Users
Report Objectives
-
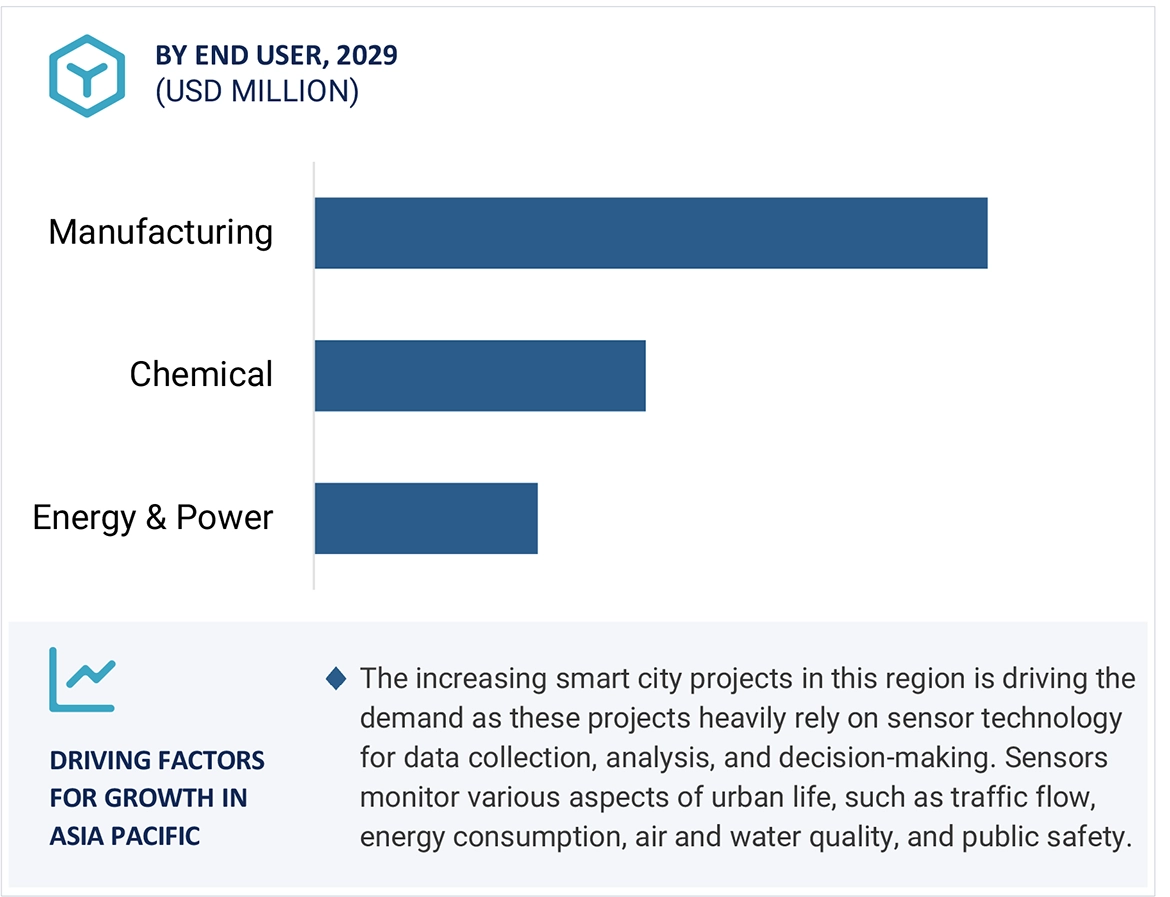
To describe, segment, and forecast the industrial sensor market, in terms of value, based on sensor type, type, and end user.
-
To describe and forecast the market for four key regions: North America, Europe, Asia Pacific, and the Rest of the World (RoW), in terms of value.
-
To provide detailed information regarding drivers, restraints, opportunities, and challenges influencing the growth of the industrial sensor market
-
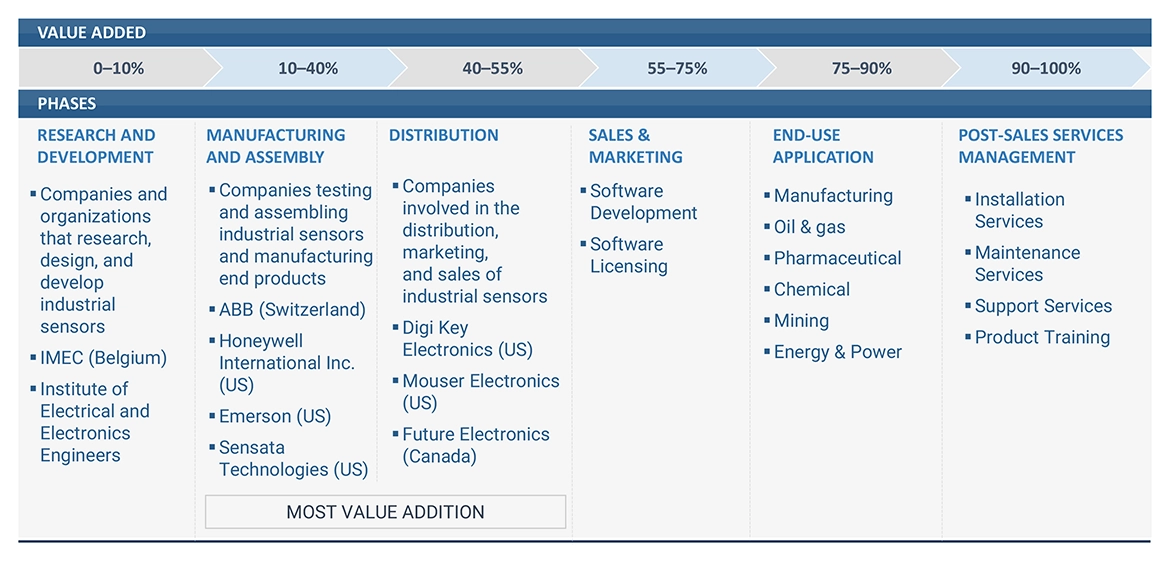
To provide a detailed overview of the supply chain and ecosystem pertaining to the industrial sensor market, along with the average selling prices of components of the industrial sensor market.
-
To strategically analyze the ecosystem, tariffs and regulations, patent landscape, trade landscape, and case studies pertaining to the market under study
-
To strategically analyze micro markets with regard to individual growth trends, prospects, and contributions to the overall market
-
To analyze opportunities in the market for stakeholders and provide a competitive landscape of the market
-
To analyze competitive developments such as product launches and developments, expansions, partnerships, collaborations, and acquisitions in the industrial sensor market
-
To strategically profile the key players in the industrial sensor market and comprehensively analyze their market ranking and core competencies
Available Customizations
With the given market data, MarketsandMarkets offers customizations according to the company’s specific needs. The following customization options are available for the report:
Company Information
-
Detailed analysis and profiling of additional market players (up to 5)


Andre
Jul, 2019
I am interested in the applications of radar systems, especially imaging radar systems for detailed object localization. Have you considered RADAR systems in the scope of your study?.
Alexander
Jun, 2019
As a student I want to identify which industry has the highest demand on sensors especially in combination of IoT-Applications in the overall industrial applications. Also which are the specific sensors that are required for industrial automation. .
Michael
May, 2019
Looking for a report for the purpose of detailing information about competitors (size, SWOT, characteristics), industry (profitability, size, and growth), and market shares in the industrial sensors market. Could you provide me the details of the same?.
Tobias
May, 2019
I�d like to read the report with the code 6767 (Industrial Sensor Market) as a sample. Please contact me if you have further questions..
Jonathan
Mar, 2019
Trying to understand the industrial sensors market to determine if the vertical is worth pursuing more aggressively at a broader fund level / making it a key industry of focus..
Peter
Mar, 2019
Humidity sensors market size and hygrometer market size in Pharma , F&B, semiconductor, pulp and paper and in harsh environments like oil and gas, petrochemical, refineries and fuel cells. .
Jeremy
Mar, 2019
I am currently preparing estimates of commercial opportunity for a wide range of sensor types. I am seeking a report that estimates market size for sensors in relatively narrow selections across various industry verticals. .
Andre
Nov, 2019
I am interested in the applications of radar systems, especially imaging radar systems for detailed object localization. Have you considered RADAR systems in the scope of your study?.
Husseini
Sep, 2019
I would like to collect information about Singapore Industrial Market, for a potential business opportunity in the future. Have you considered IIoT-based sensors in the scope of your report? .
John
Jun, 2019
Looking to review the industrial sensor market report. I need to understand the research methodology which you have followed. .
Mark
Jun, 2019
Primary interest in the growth of hydraulic cylinder position sensors in the mobile market. Of secondary interest would be new markets for our mobile oriented level sensors which would be aligned with industrial applications .
Chris
Apr, 2019
Looking for market data to accomplish a market study for our current products which is aligned with sensors used in industrial applications and to help assess new product market. .
PAVAN
Mar, 2019
My interest in specifically into Mobile Hydraulics and Industrial Automation. Does the industrial sensor market provide it? Also, what is the market scope? Could you provide me with the overview or a particular brochure for the same? .
Kirk
Feb, 2019
Does industrial sensor market report cover elemental analysis? Asset protection? Alternate technologies such as lab based Big Data?.