Interactive Display Market

Interactive Display Market by Product (Interactive Kiosk, Whiteboard, Table, Video Wall, Monitor), Technology (LCD, LED, OLED), Panel Size, Panel Type (Flat, Flexible, Transparent), Vertical (Retail, Corporate) and Geography - Global Forecast to 2029

Report Code: SE 3537 Jan, 2024, by marketsandmarkets.com

[228 Pages Report] The interactive display market is projected to grow from USD 12.5 billion in 2024 to USD 16.9 billion by 2029; it is expected to grow at a CAGR of 6.3% from 2024 to 2029. Interactive displays come with features that significantly improve efficiency and productivity in various contexts. In business settings, these displays facilitate collaborative decision-making, streamline presentations, and enable dynamic data visualization. The widespread adoption of interactive displays can be attributed to their accessibility and affordability, which are influenced by technological advancements and economies of scale.

Interactive Display Market

Interactive Display Market

Interactive Display Market Forecast to 2029

To know about the assumptions considered for the study, Request for Free Sample Report

Interactive Display Market Dynamics

Driver: Widespread use in education sector to promote on-site and remote collaborations

The use of new technologies, such as mobiles, tablets, laptops, projectors, and interactive whiteboards in classrooms, is playing an important role in making the learning process more interactive. Interactive displays are experiencing significant growth, largely fueled by the education sector. Schools and universities are progressively incorporating these displays into classrooms to encourage interactive learning experiences. These displays play a crucial role in enhancing lessons, promoting collaboration, and encouraging active participation among students. The trend toward remote work has fastened the acceptance of interactive displays for virtual collaboration.

Restraint: Reduced demand from retail sector due to increasing trend of online advertising and shopping

Digital advertising has evolved to provide more sophisticated and personalized options for reaching consumers across multiple devices and channels, reflecting the increased time spent online. Consequently, the demand for displays in commercial and retail settings has experienced a significant decline as businesses redirect their advertising focus toward online channels. With the use of smartphones, consumers can effortlessly obtain product information, read reviews, and complete purchases directly on their devices. Consequently, retailers discovered that allocating resources to the development of mobile-friendly online platforms proves more impactful in connecting with and captivating customers than sustaining interactive displays within physical stores. However, the expenses associated with the installation and upkeep of interactive displays present a considerable financial burden for retailers.

Opportunity: Wide applications in streamlining healthcare sector

The integration of interactive displays in the medical and healthcare sector demonstrates the potential to improve patient outcomes, streamline processes, and enhance the overall healthcare experience for both patients and healthcare professionals. Medical professionals, including surgeons, utilize interactive displays for collaborative decision-making and treatment planning. These displays enable the visualization of medical images like MRIs and CT scans, fostering improved comprehension and coordination within healthcare teams. Patients are educated about medical conditions, treatment options, and preventive care through the use of interactive displays. These displays facilitate interactive learning experiences, allowing healthcare providers to communicate complex information in a manner that is more accessible and engaging for patients.

Challenge: High costs associated with display panels, interactive components and other additional software or hardware

Interactive displays frequently integrate advanced touch technologies like capacitive touch, infrared touch, or optical touch, necessitating specialized sensors and components. These elements significantly contribute to the overall cost of the display. Additionally, to deliver clear and high-resolution visuals, interactive displays commonly utilize premium display panels, including LED or OLED. The cost of these panels, particularly for larger sizes or those with features like 4K resolution, can markedly impact the overall expense. These displays are often built for commercial or educational environments, emphasizing durability. Robust build quality, protective glass, and anti-glare coatings are incorporated, further adding to the cost to ensure the display can endure frequent use and potential environmental factors.

Interactive Display Market Ecosystem

The prominent players in the interactive display market are SAMSUNG (South Korea), LG DISPLAY CO., LTD. (South Korea), BOE Technology Group Co., Ltd. (China), Panasonic Corporation (Japan) and SHARP CORPORATION (Japan). These companies have been operating in the market for several years and possess a diversified product portfolio, state-of-the-art technologies, and strong global sales and marketing networks.

Interactive Display Market by Ecosystem

Interactive Kiosks segment to account for the largest share of the interactive display market in 2023

The demand for interactive kiosk is on the rise, as they are being used in retail stores, schools, hotel and trade shows. These kiosk are designed to engage customer and provide an interactive experience.  They serve multiple functions such as wayfinding, queue management, data collection and education. The kiosk comes in different sizes and features including touch screens, high definition displays and optional touch screen options. The demand is mainly driven by their ability to interact and attract customers, provide required information and overall customer experience. As a result, the interactive kiosk is projected to maintain the largest share throughout the forecast period.

32-65 inches panel size to dominate interactive display market during the forecast period

Interactive displays within the 32-65 inch size range are frequently implemented in retail applications to showcase products, offer interactive catalogs, and engage with customers. These displays serve to deliver product details, promotions, and interactive experiences, thereby elevating the overall shopping experience. The increasing adoption of 32-65 inch interactive displays is evident across a multitude of industries, fueled by their versatility and user-friendly characteristics. These displays are being widely utilized in advertising, digital signage, education, retail, entertainment, hospitality, and healthcare sectors.

Education vertical to register the highest share for interactive display market in 2023

The education segment is composed to command the largest market share throughout the forecast period. The surge in demand for interactive displays aligns with the growing prevalence of remote and hybrid learning approaches. These displays enable the creation of virtual classrooms, enabling educators to interact with students irrespective of their geographical location, while students can actively participate in interactive lessons from the comfort of their homes.

The Asia Pacific region is projected to grow at the highest CAGR during the forecast period.

The Asia Pacific region is projected to take the lead in the interactive display market, exhibiting the highest CAGR throughout the forecast period. The higher demand for interactive displays in the Asia-Pacific region can be attributed to a combination of factors, including the growth of the education sector, rapid technology adoption, expanding businesses, government initiatives, cultural attitudes toward technology, urbanization, and the increased affordability of these technologies. The Asia Pacific market benefits from the presence of well-established interactive display players like Panasonic Corporation, BOE Technology Group Co., Ltd., LEYARD and SHARP CORPORATION, contributing significantly to regional market expansion. These factors collectively drive the growth of the interactive display market in the Asia Pacific region.

Interactive Display Market by Region

Interactive Display Market by Region

To know about the assumptions considered for the study, download the pdf brochure

Key Market Players

The major players in the interactive display companies include SAMSUNG (South Korea), LG DISPLAY CO., LTD. (South Korea), BOE Technology Group Co., Ltd. (China), Panasonic Corporation (Japan), LEYARD (China), SHARP CORPORATION (Japan), Elo Touch Solutions, Inc. (US), Crystal Display Systems Ltd (UK), ViewSonic Corporation (US), AUO Corporation (Taiwan). These companies have used organic and inorganic growth strategies, such as product launches, acquisitions, and partnerships to strengthen their position in the market.

Get online access to the report on the World's First Market Intelligence Cloud

  • Easy to Download Historical Data & Forecast Numbers
  • Company Analysis Dashboard for high growth potential opportunities
  • Research Analyst Access for customization & queries
  • Competitor Analysis with Interactive dashboard
  • Latest News, Updates & Trend analysis
Request Sample

Scope of the Report

Report Metric

Details

Market Size Availability for Years

2020–2029

Base Year

2023

Forecast Period

2024–2029

Forecast Units

Value (USD)

Segments Covered

By Product, By Panel Size, By Panel Type, By Technology, By Vertical

Geographies Covered

North America, Europe, Asia Pacific, and RoW

Companies Covered

SAMSUNG (South Korea), LG DISPLAY CO., LTD. (South Korea), BOE Technology Group Co., Ltd. (China), Panasonic Corporation (Japan), LEYARD (China), SHARP CORPORATION (Japan), Elo Touch Solutions, Inc. (US), Crystal Display Systems Ltd (UK), ViewSonic Corporation (US), AUO Corporation (Taiwan), HORIZON DISPLAY INC. (US), GestureTek Inc. (US), ITS, Inc. (US), Baanto International Ltd. (Canada), Intuiface (France), Qisda Corporation (Taiwan), Boxlight (US), Egan Visual (Canada), Hitachi, Ltd. (Japan), Promethean Limited (US), Vestel (Turkey), Barco (Belgium), Firstouch Digital Solutions (India), SMART Technologies ULC (Canada), and Senses Electronics Pvt. Ltd. (India)

Interactive Display Market Highlights

This research report categorizes the Interactive Display Market based on product, panel size, panel type, technology, vertical, and region.

Segment

Subsegment

By Product

  • Introduction
  • Interactive Kiosks
  • Interactive Whiteboards
  • Interactive Tables
  • Interactive Video Walls
  • Interactive Monitors

By Panel Size

  • Introduction
  • 17-32 Inches
  • 32-65 Inches
  • Above 65 Inches

By Panel Type

  • Introduction
  • Flat
  • Flexible
  • Transparent

By Technology

  • Introduction
  • LCD
  • LED
  • OLED
  • Other Technologies

By Vertical

  • Introduction
  • Retail & Hospitality
  • BFSI
  • Industrial
  • Healthcare
  • Corporate & Government
  • Transportation
  • Education
  • Sports & Entertainment
  • Other Verticals

By Region

  • Introduction
  • North America
    • Impact of Recession
    • US
    • Canada
    • Mexico
  • Europe
    • Impact of Recession
    • UK
    • Germany
    • France
    • Rest of the Europe
  • Asia Pacific
    • Impact of Recession
    • China
    • Japan
    • South Korea
    • India
    • Rest of Asia Pacific
  • ROW
    • Impact of Recession
    • Middle East & Africa
      • GCC
      • Rest of MEA
  • South America

Recent Developments

  • In March 2023, SAMSUNG showcases its latest Interactive Display, featuring innovative software solutions designed to improve usability and connectivity in the classroom. The 30,000 educators present at the event have the opportunity to delve into the future of education through hands-on exploration of the cutting-edge Samsung Interactive Display and Samsung Whiteboard App.
  • In January 2023, LG DISPLAY CO., LTD. announced its wide range of OLED displays, the largest of them all is 97-inch OLED display and the smallest is 0.42-inch OLEDoS, and other OLED display laying in between them are 65-inch, 45-inch, 42-inch, 27-inch OLED TV panels.
  • In March 2023, SHARP CORPORATION and E Ink Holdings Inc. collaborated to develop and market ePaper posters using E Ink's technology which can be used as digital signage.
  • In January 2022, Elo Touch Solutions, Inc., a global provider of interactive solutions and commercial-grade Android devices, showed its extensive range of products and services at the RetailNOW Conference in Florida. Elo presented solutions across four key categories: Point-of-Sale, Kiosks, Retail Touchscreen Signage, and Mobile.
  • In June 2021, LEYARD introduces the next generation of large screens with its new TXP Series Huddle Walls, designed for applications in presentations, meetings, conferences, and education. These all-in-one displays are offered in screen sizes ranging from 108 to 162 inches and are available in various resolution formats.

Frequently Asked Questions (FAQs):

To speak to our analyst for a discussion on the above findings, click Speak to Analyst

TABLE OF CONTENTS
 
1 INTRODUCTION (Page No. - 29)
    1.1 STUDY OBJECTIVES 
    1.2 MARKET DEFINITION 
           1.2.1 INCLUSIONS AND EXCLUSIONS
    1.3 STUDY SCOPE 
           1.3.1 MARKETS COVERED
                    FIGURE 1 INTERACTIVE DISPLAY MARKET: SEGMENTATION
           1.3.2 REGIONAL SCOPE
           1.3.3 YEARS CONSIDERED
           1.3.4 CURRENCY CONSIDERED
           1.3.5 UNITS CONSIDERED
    1.4 LIMITATIONS 
    1.5 STAKEHOLDERS 
    1.6 SUMMARY OF CHANGES 
    1.7 RECESSION IMPACT 
 
2 RESEARCH METHODOLOGY (Page No. - 35)
    2.1 RESEARCH DATA 
           FIGURE 2 INTERACTIVE DISPLAY MARKET: RESEARCH DESIGN
           2.1.1 SECONDARY DATA
                    2.1.1.1 List of key secondary sources
                    2.1.1.2 Key data from secondary sources
           2.1.2 PRIMARY DATA
                    2.1.2.1 Primary interviews with experts
                    2.1.2.2 List of key primary interview participants
                    2.1.2.3 Key data from primary sources
                    2.1.2.4 Breakdown of primaries
                    2.1.2.5 Key industry insights
           2.1.3 SECONDARY AND PRIMARY RESEARCH
                    FIGURE 3 INTERACTIVE DISPLAY MARKET: RESEARCH APPROACH
    2.2 MARKET SIZE ESTIMATION 
           FIGURE 4 MARKET SIZE ESTIMATION METHODOLOGY: SUPPLY-SIDE ANALYSIS
                    2.2.1 BOTTOM-UP APPROACH
                             FIGURE 5 MARKET SIZE ESTIMATION METHODOLOGY: BOTTOM-UP APPROACH
                             2.2.1.1 Approach to estimate market size using bottom-up analysis (demand side)
                                        FIGURE 6 MARKET SIZE ESTIMATION METHODOLOGY—APPROACH 1 (SUPPLY SIDE): REVENUE OF MARKET PLAYERS
                                        FIGURE 7 MARKET SIZE ESTIMATION METHODOLOGY—APPROACH 2 (DEMAND SIDE): BOTTOM-UP MARKET SIZE ESTIMATION FOR INTERACTIVE DISPLAYS
           2.2.2 TOP-DOWN APPROACH
                    FIGURE 8 MARKET SIZE ESTIMATION METHODOLOGY: TOP-DOWN APPROACH
                    2.2.2.1 Approach to estimate market size using top-down analysis (supply side)
    2.3 DATA TRIANGULATION 
           FIGURE 9 DATA TRIANGULATION
    2.4 RESEARCH ASSUMPTIONS 
           2.4.1 GROWTH PROJECTIONS AND FORECAST-RELATED ASSUMPTIONS
           TABLE 1 INTERACTIVE DISPLAY MARKET: GROWTH ASSUMPTIONS
    2.5 RESEARCH LIMITATIONS 
    2.6 IMPACT OF RECESSION ON INTERACTIVE DISPLAY MARKET 
 
3 EXECUTIVE SUMMARY (Page No. - 46)
    FIGURE 10 INTERACTIVE DISPLAY MARKET, 2020–2029
    FIGURE 11 INTERACTIVE KIOSKS TO REGISTER HIGHEST CAGR DURING FORECAST PERIOD
    FIGURE 12 17–32 INCHES PANEL SIZE TO HOLD LARGEST MARKET SHARE IN 2029
    FIGURE 13 FLAT PANEL TYPE TO DOMINATE MARKET IN 2029
    FIGURE 14 EDUCATION VERTICAL TO ACCOUNT FOR LARGEST MARKET SHARE IN 2029
    FIGURE 15 NORTH AMERICA HELD LARGEST MARKET SHARE IN 2023
 
4 PREMIUM INSIGHTS (Page No. - 51)
    4.1 ATTRACTIVE OPPORTUNITIES FOR PLAYERS IN INTERACTIVE DISPLAY MARKET 
           FIGURE 16 GROWING DEMAND FOR INTERACTIVE DISPLAYS FROM EDUCATION AND RETAIL & HOSPITALITY VERTICALS TO CREATE LUCRATIVE OPPORTUNITIES FOR MARKET PLAYERS
    4.2 INTERACTIVE DISPLAY MARKET, BY PRODUCT 
           FIGURE 17 INTERACTIVE KIOSKS TO HOLD LARGEST MARKET SHARE IN 2029
    4.3 INTERACTIVE DISPLAY MARKET, BY TECHNOLOGY 
           FIGURE 18 OLED TECHNOLOGY TO EXHIBIT HIGHEST CAGR DURING FORECAST PERIOD
    4.4 INTERACTIVE DISPLAY MARKET, BY PANEL SIZE AND VERTICAL 
           FIGURE 19 17–32 INCHES PANEL SIZE AND EDUCATION VERTICAL HELD LARGEST MARKET SHARES IN 2023
    4.5 INTERACTIVE DISPLAY MARKET, BY REGION 
           FIGURE 20 ASIA PACIFIC TO REGISTER HIGHEST CAGR DURING FORECAST PERIOD
 
5 MARKET OVERVIEW (Page No. - 54)
    5.1 INTRODUCTION 
    5.2 MARKET DYNAMICS 
           FIGURE 21 INTERACTIVE DISPLAY MARKET: DRIVERS, RESTRAINTS, OPPORTUNITIES, AND CHALLENGES
           5.2.1 DRIVERS
                    5.2.1.1 Widespread use in education sector to promote on-site and remote collaborations
                    5.2.1.2 Growing demand from gaming and entertainment sector
                    5.2.1.3 Rising adoption of LED displays for advertising and information dissemination
                    5.2.1.4 Increasing applications in automotive sector
                               FIGURE 22 INTERACTIVE DISPLAY MARKET: IMPACT OF DRIVERS
           5.2.2 RESTRAINTS
                    5.2.2.1 Reduced demand from retail sector due to increasing trend of online advertising and shopping
                               FIGURE 23 INTERACTIVE DISPLAY MARKET: IMPACT OF RESTRAINTS
           5.2.3 OPPORTUNITIES
                    5.2.3.1 Widening application scope in streamlining healthcare sector
                    5.2.3.2 Significant increase in centralized virtual meetings, facilitating seamless collaboration between participants
                    5.2.3.3 Integration of artificial intelligence into interactive whiteboards
                               FIGURE 24 INTERACTIVE DISPLAY MARKET: IMPACT OF OPPORTUNITIES
           5.2.4 CHALLENGES
                    5.2.4.1 High costs associated with display panels, interactive components, and other additional software and hardware
                                FIGURE 25 INTERACTIVE DISPLAY MARKET: IMPACT OF CHALLENGES
    5.3 SUPPLY CHAIN ANALYSIS 
           FIGURE 26 INTERACTIVE DISPLAY MARKET: SUPPLY CHAIN ANALYSIS
    5.4 ECOSYSTEM ANALYSIS 
           FIGURE 27 INTERACTIVE DISPLAY MARKET: KEY PLAYERS IN ECOSYSTEM
           TABLE 2 ROLE OF PLAYERS IN INTERACTIVE DISPLAY ECOSYSTEM
    5.5 PRICING ANALYSIS 
           5.5.1 AVERAGE SELLING PRICE TREND, BY PRODUCT
                    FIGURE 28 AVERAGE SELLING PRICE TREND, BY PRODUCT, 2020–2029
           5.5.2 INDICATIVE PRICING ANALYSIS OF PRODUCTS OFFERED BY KEY PLAYERS, BY DISPLAY SIZE
                    TABLE 3 INDICATIVE PRICING ANALYSIS OF PRODUCTS OFFERED BY KEY PLAYERS, BY DISPLAY SIZE, 2023 (USD)
           5.5.3 INDICATIVE PRICING ANALYSIS OF INTERACTIVE DISPLAY PRODUCTS, BY REGION
                    TABLE 4 INDICATIVE PRICING ANALYSIS OF INTERACTIVE DISPLAY PRODUCTS, BY REGION, 2023 (USD)
    5.6 TRENDS/DISRUPTIONS IMPACTING CUSTOMERS’ BUSINESSES 
           FIGURE 29 TRENDS/DISRUPTIONS IMPACTING CUSTOMERS’ BUSINESSES
    5.7 TECHNOLOGY ANALYSIS 
           5.7.1 FLEXIBLE DISPLAYS
           5.7.2 MICRO-LED DISPLAYS
           5.7.3 PROJECTION TECHNOLOGIES
           5.7.4 IMMERSIVE DISPLAYS
    5.8 PATENT ANALYSIS 
           FIGURE 30 NUMBER OF PATENTS GRANTED PERTAINING TO INTERACTIVE DISPLAYS, 2013–2022
           TABLE 5 LIST OF MAJOR PATENTS RELATED TO INTERACTIVE DISPLAYS, 2020–2023
    5.9 PORTER’S FIVE FORCES ANALYSIS 
           FIGURE 31 INTERACTIVE DISPLAY MARKET: PORTER’S FIVE FORCES ANALYSIS
           TABLE 6 INTERACTIVE DISPLAY MARKET: PORTER’S FIVE FORCES ANALYSIS
           FIGURE 32 IMPACT OF PORTER’S FIVE FORCES ANALYSIS ON INTERACTIVE DISPLAY MARKET, 2022
           5.9.1 THREAT OF NEW ENTRANTS
           5.9.2 THREAT OF SUBSTITUTES
           5.9.3 BARGAINING POWER OF SUPPLIERS
           5.9.4 BARGAINING POWER OF BUYERS
           5.9.5 INTENSITY OF COMPETITIVE RIVALRY
    5.1 KEY STAKEHOLDERS AND BUYING CRITERIA 
           5.10.1 KEY STAKEHOLDERS IN BUYING PROCESS
                    FIGURE 33 INFLUENCE OF STAKEHOLDERS ON BUYING PROCESS FOR TOP THREE VERTICALS
                    TABLE 7 INFLUENCE OF STAKEHOLDERS ON BUYING PROCESS FOR TOP THREE VERTICALS (%)
           5.10.2 BUYING CRITERIA
                    FIGURE 34 KEY BUYING CRITERIA FOR TOP THREE VERTICALS
                    TABLE 8 KEY BUYING CRITERIA FOR TOP THREE VERTICALS
    5.11 TRADE ANALYSIS 
           FIGURE 35 IMPORT DATA FOR HS CODE 8528-COMPLIANT PRODUCTS FOR MAJOR COUNTRIES, 2018–2022 (USD MILLION)
           TABLE 9 IMPORT DATA FOR HS CODE 8528-COMPLIANT PRODUCTS, BY COUNTRY, 2018–2022 (USD MILLION)
           FIGURE 36 EXPORT DATA FOR HS CODE 8528-COMPLIANT PRODUCTS FOR MAJOR COUNTRIES, 2018–2022 (USD MILLION)
           TABLE 10 EXPORT DATA FOR HS CODE 8528-COMPLIANT PRODUCTS, BY COUNTRY, 2018–2022 (USD MILLION)
    5.12 CASE STUDY ANALYSIS 
           5.12.1 CSU ENHANCED LEARNING EXPERIENCE FOR STUDENTS WITH SAMSUNG LCD VIDEO WALL DISPLAY
           5.12.2 NEW JERSEY INSTITUTE OF TECHNOLOGY INSTALLED PANASONIC’S DISPLAY TECHNOLOGIES IN AD HOC TEAMWORK CENTERS AND ACTIVE-LEARNING CLASSROOMS
           5.12.3 VFB STUTTGART IMPLEMENTED INVENTIVE MOBILE TACTICS VEHICLE UTILIZING SHARP TECHNOLOGY ON TRAINING FIELD
    5.13 KEY CONFERENCES AND EVENTS 
                    TABLE 11 INTERACTIVE DISPLAY MARKET: LIST OF KEY CONFERENCES AND EVENTS, 2024
    5.14 TARIFFS, STANDARDS, AND REGULATORY LANDSCAPE 
           5.14.1 TARIFFS
                    TABLE 12 MFN TARIFFS FOR HS CODE 8528-COMPLIANT PRODUCTS EXPORTED BY US, 2022
           5.14.2 STANDARDS
                    5.14.2.1 Global
                    5.14.2.2 Europe
                    5.14.2.3 Asia Pacific
                    5.14.2.4 North America
           5.14.3 REGULATIONS
                    5.14.3.1 North America
                    5.14.3.2 Europe
                    5.14.3.3 Asia Pacific
 
6 INTERACTIVE DISPLAY MARKET, BY PRODUCT (Page No. - 81)
    6.1 INTRODUCTION 
           FIGURE 37 INTERACTIVE DISPLAY MARKET, BY PRODUCT
           FIGURE 38 INTERACTIVE KIOSKS TO DOMINATE MARKET IN 2029
           TABLE 13 INTERACTIVE DISPLAY MARKET, BY PRODUCT, 2020–2023 (USD MILLION)
           TABLE 14 INTERACTIVE DISPLAY MARKET, BY PRODUCT, 2024–2029 (USD MILLION)
           TABLE 15 INTERACTIVE DISPLAY MARKET, BY PRODUCT, 2020–2023 (THOUSAND UNITS)
           TABLE 16 INTERACTIVE DISPLAY MARKET, BY PRODUCT, 2024–2029 (THOUSAND UNITS)
    6.2 INTERACTIVE KIOSKS 
           6.2.1 ADVANTAGES SUCH AS IMMEDIATE INFORMATION RETRIEVAL IN PUBLIC PLACES TO DRIVE MARKET
                    TABLE 17 INTERACTIVE KIOSKS: INTERACTIVE DISPLAY MARKET, BY VERTICAL, 2020–2023 (USD MILLION)
                    TABLE 18 INTERACTIVE KIOSKS: INTERACTIVE DISPLAY MARKET, BY VERTICAL, 2024–2029 (USD MILLION)
                    TABLE 19 INTERACTIVE KIOSKS: INTERACTIVE DISPLAY MARKET, BY PANEL SIZE, 2020–2023 (USD MILLION)
                    TABLE 20 INTERACTIVE KIOSKS: INTERACTIVE DISPLAY MARKET, BY PANEL SIZE, 2024–2029 (USD MILLION)
    6.3 INTERACTIVE WHITEBOARDS 
           6.3.1 INCREASED USER-FRIENDLINESS DUE TO INTEGRATION OF ARTIFICIAL INTELLIGENCE AND CAPACITIVE TECHNOLOGY TO FUEL MARKET GROWTH
                    TABLE 21 INTERACTIVE WHITEBOARDS: INTERACTIVE DISPLAY MARKET, BY VERTICAL, 2020–2023 (USD MILLION)
                    TABLE 22 INTERACTIVE WHITEBOARDS: INTERACTIVE DISPLAY MARKET, BY VERTICAL, 2024–2029 (USD MILLION)
                    TABLE 23 INTERACTIVE WHITEBOARDS: INTERACTIVE DISPLAY MARKET, BY PANEL SIZE, 2020–2023 (USD MILLION)
                    TABLE 24 INTERACTIVE WHITEBOARDS: INTERACTIVE DISPLAY MARKET, BY PANEL SIZE, 2024–2029 (USD MILLION)
    6.4 INTERACTIVE TABLES 
           6.4.1 ABILITY TO PROVIDE PERSONALIZED AND ENGAGING USER EXPERIENCES IN RETAIL & HOSPITALITY VERTICAL TO BOOST MARKET GROWTH
                    TABLE 25 INTERACTIVE TABLES: INTERACTIVE DISPLAY MARKET, BY VERTICAL, 2020–2023 (USD MILLION)
                    TABLE 26 INTERACTIVE TABLES: INTERACTIVE DISPLAY MARKET, BY VERTICAL, 2024–2029 (USD MILLION)
                    TABLE 27 INTERACTIVE TABLES: INTERACTIVE DISPLAY MARKET, BY PANEL SIZE, 2020–2023 (USD MILLION)
                    TABLE 28 INTERACTIVE TABLES: INTERACTIVE DISPLAY MARKET, BY PANEL SIZE, 2024–2029 (USD MILLION)
    6.5 INTERACTIVE VIDEO WALLS 
           6.5.1 INCREASING DEPLOYMENT IN MALLS AND PUBLIC OUTING SPACES TO CONTRIBUTE TO DEMAND
                    TABLE 29 INTERACTIVE VIDEO WALLS: INTERACTIVE DISPLAY MARKET, BY VERTICAL, 2020–2023 (USD MILLION)
                    TABLE 30 INTERACTIVE VIDEO WALLS: INTERACTIVE DISPLAY MARKET, BY VERTICAL, 2024–2029 (USD MILLION)
                    TABLE 31 INTERACTIVE VIDEO WALLS: INTERACTIVE DISPLAY MARKET, BY PANEL SIZE, 2020–2023 (USD MILLION)
                    TABLE 32 INTERACTIVE VIDEO WALLS: INTERACTIVE DISPLAY MARKET, BY PANEL SIZE, 2024–2029 (USD MILLION)
    6.6 INTERACTIVE MONITORS 
           6.6.1 RISING USE OF DIGITAL SIGNAGE TO ALLOW USERS TO ACTIVELY ENGAGE WITH CONTENT TO PROPEL MARKET
                    TABLE 33 INTERACTIVE MONITORS: INTERACTIVE DISPLAY MARKET, BY VERTICAL, 2020–2023 (USD MILLION)
                    TABLE 34 INTERACTIVE MONITORS: INTERACTIVE DISPLAY MARKET, BY VERTICAL, 2024–2029 (USD MILLION)
                    TABLE 35 INTERACTIVE MONITORS: INTERACTIVE DISPLAY MARKET, BY PANEL SIZE, 2020–2023 (USD MILLION)
                    TABLE 36 INTERACTIVE MONITORS: INTERACTIVE DISPLAY MARKET, BY PANEL SIZE, 2024–2029 (USD MILLION)
 
7 INTERACTIVE DISPLAY MARKET, BY PANEL SIZE (Page No. - 93)
    7.1 INTRODUCTION 
           FIGURE 39 INTERACTIVE DISPLAY MARKET, BY PANEL SIZE
           FIGURE 40 17–32 INCH-INTERACTIVE DISPLAYS TO HOLD LARGEST MARKET SHARE IN 2029
           TABLE 37 INTERACTIVE DISPLAY MARKET, BY PANEL SIZE, 2020–2023 (USD MILLION)
           TABLE 38 INTERACTIVE DISPLAY MARKET, BY PANEL SIZE, 2024–2029 (USD MILLION)
    7.2 17–32 INCHES 
           7.2.1 HIGH ADOPTION OF DIGITAL SIGNAGE SYSTEMS IN RETAIL SECTOR TO PROPEL MARKET
                    TABLE 39 17–32 INCHES: INTERACTIVE DISPLAY MARKET, BY PRODUCT, 2020–2023 (USD MILLION)
                    TABLE 40 17–32 INCHES: INTERACTIVE DISPLAY MARKET, BY PRODUCT, 2024–2029 (USD MILLION)
    7.3 32–65 INCHES 
           7.3.1 SUITABILITY IN DIVERSE PROFESSIONAL AND RECREATIONAL APPLICATIONS TO DRIVE MARKET
                    TABLE 41 32–65 INCHES: INTERACTIVE DISPLAY MARKET, BY PRODUCT, 2020–2023 (USD MILLION)
                    TABLE 42 32–65 INCHES: INTERACTIVE DISPLAY MARKET, BY PRODUCT, 2024–2029 (USD MILLION)
    7.4 ABOVE 65 INCHES 
           7.4.1 PROMINENT USE IN TRADE SHOWS AND EXHIBITIONS TO SUPPORT MARKET GROWTH
                    TABLE 43 ABOVE 65 INCHES: INTERACTIVE DISPLAY MARKET, BY PRODUCT, 2020–2023 (USD MILLION)
                    TABLE 44 ABOVE 65 INCHES: INTERACTIVE DISPLAY MARKET, BY PRODUCT, 2024–2029 (USD MILLION)
 
8 INTERACTIVE DISPLAY MARKET, BY PANEL TYPE (Page No. - 99)
    8.1 INTRODUCTION 
           FIGURE 41 INTERACTIVE DISPLAY MARKET, BY PANEL TYPE
           FIGURE 42 FLAT PANEL TYPE TO DOMINATE MARKET IN 2029
           TABLE 45 INTERACTIVE DISPLAY MARKET, BY PANEL TYPE, 2020–2023 (USD MILLION)
           TABLE 46 INTERACTIVE DISPLAY MARKET, BY PANEL TYPE, 2024–2029 (USD MILLION)
    8.2 FLAT 
           8.2.1 NEED FOR THIN AND LIGHTWEIGHT DESIGNS WITH HIGH-RESOLUTION VISUALS TO DRIVE MARKET
    8.3 FLEXIBLE 
           8.3.1 ADAPTABILITY TO DIVERSE ENVIRONMENTS AND COMPATIBILITY WITH LIGHTWEIGHT PORTABLE DEVICES TO FOSTER MARKET GROWTH
    8.4 TRANSPARENT 
           8.4.1 MODERN AESTHETICS AND ENHANCED INTERACTIVITY AND ENGAGEMENT ACROSS INDUSTRIES TO BOOST MARKET GROWTH
 
9 INTERACTIVE DISPLAY MARKET, BY TECHNOLOGY (Page No. - 103)
    9.1 INTRODUCTION 
           FIGURE 43 INTERACTIVE DISPLAY MARKET, BY TECHNOLOGY
           FIGURE 44 LCD TECHNOLOGY TO ACCOUNT FOR LARGEST MARKET SHARE IN 2029
           TABLE 47 INTERACTIVE DISPLAY MARKET, BY TECHNOLOGY, 2020–2023 (USD MILLION)
           TABLE 48 INTERACTIVE DISPLAY MARKET, BY TECHNOLOGY, 2024–2029 (USD MILLION)
    9.2 LCD 
           9.2.1 NEED FOR COST-EFFECTIVE AND HIGH-QUALITY VISUAL EXPERIENCE TO DRIVE MARKET
    9.3 LED 
           9.3.1 LOWER POWER CONSUMPTION COMPARED WITH TRADITIONAL LIGHTING TECHNOLOGIES TO CONTRIBUTE TO DEMAND
    9.4 OLED 
           9.4.1 RAPID RESPONSE TIMES AND CUSTOMIZABLE DESIGN OPTIONS TO PROPEL MARKET
    9.5 OTHER TECHNOLOGIES 
 
10 INTERACTIVE DISPLAY MARKET, BY VERTICAL (Page No. - 107)
     10.1 INTRODUCTION 
           FIGURE 45 INTERACTIVE DISPLAY MARKET, BY VERTICAL
           FIGURE 46 EDUCATION VERTICAL TO DOMINATE MARKET IN 2029
           TABLE 49 INTERACTIVE DISPLAY MARKET, BY VERTICAL, 2020–2023 (USD MILLION)
           TABLE 50 INTERACTIVE DISPLAY MARKET, BY VERTICAL, 2024–2029 (USD MILLION)
     10.2 RETAIL & HOSPITALITY 
             10.2.1 HIGH CUSTOMER ENGAGEMENT DURING SHOPPING AND IN HOSPITALITY SECTOR TO BOOST ADOPTION
                        TABLE 51 RETAIL & HOSPITALITY: INTERACTIVE DISPLAY MARKET, BY PRODUCT, 2020–2023 (USD MILLION)
                        TABLE 52 RETAIL & HOSPITALITY: INTERACTIVE DISPLAY MARKET, BY PRODUCT, 2024–2029 (USD MILLION)
                        TABLE 53 RETAIL & HOSPITALITY: INTERACTIVE DISPLAY MARKET, BY REGION, 2020–2023 (USD MILLION)
                        TABLE 54 RETAIL & HOSPITALITY: INTERACTIVE DISPLAY MARKET, BY REGION, 2024–2029 (USD MILLION)
     10.3 BFSI 
             10.3.1 INCREASED SERVICE EFFICIENCY WITH VISUALLY APPEALING CONTENT PROMOTION ADVANTAGES TO DRIVE MARKET
                        TABLE 55 BFSI: INTERACTIVE DISPLAY MARKET, BY PRODUCT, 2020–2023 (USD MILLION)
                        TABLE 56 BFSI: INTERACTIVE DISPLAY MARKET, BY PRODUCT, 2024–2029 (USD MILLION)
                        TABLE 57 BFSI: INTERACTIVE DISPLAY MARKET, BY REGION, 2020–2023 (USD MILLION)
                        TABLE 58 BFSI: INTERACTIVE DISPLAY MARKET, BY REGION, 2024–2029 (USD MILLION)
     10.4 INDUSTRIAL 
             10.4.1 REAL-TIME DATA VISUALIZATION AND COST SAVINGS IN DIVERSE INDUSTRIES TO FUEL DEMAND
                        TABLE 59 INDUSTRIAL: INTERACTIVE DISPLAY MARKET, BY PRODUCT, 2020–2023 (USD MILLION)
                        TABLE 60 INDUSTRIAL: INTERACTIVE DISPLAY MARKET, BY PRODUCT, 2024–2029 (USD MILLION)
                        TABLE 61 INDUSTRIAL: INTERACTIVE DISPLAY MARKET, BY REGION, 2020–2023 (USD MILLION)
                        TABLE 62 INDUSTRIAL: INTERACTIVE DISPLAY MARKET, BY REGION, 2024–2029 (USD MILLION)
     10.5 HEALTHCARE 
             10.5.1 HIGH ADOPTION OF SELF-SERVICE KIOSKS TO OFFER FAST HEALTHCARE SERVICES TO FUEL MARKET GROWTH
                        TABLE 63 HEALTHCARE: INTERACTIVE DISPLAY MARKET, BY PRODUCT, 2020–2023 (USD MILLION)
                        TABLE 64 HEALTHCARE: INTERACTIVE DISPLAY MARKET, BY PRODUCT, 2024–2029 (USD MILLION)
                        TABLE 65 HEALTHCARE: INTERACTIVE DISPLAY MARKET, BY REGION, 2020–2023 (USD MILLION)
                        TABLE 66 HEALTHCARE: INTERACTIVE DISPLAY MARKET, BY REGION, 2024–2029 (USD MILLION)
     10.6 CORPORATE & GOVERNMENT 
             10.6.1 INCREASED USE OF INTERACTIVE DISPLAYS IN CORPORATE SECTOR TO CONDUCT SEMINARS, PRESENTATIONS, AND MEETINGS TO PROPEL MARKET
                        TABLE 67 CORPORATE & GOVERNMENT: INTERACTIVE DISPLAY MARKET, BY PRODUCT, 2020–2023 (USD MILLION)
                        TABLE 68 CORPORATE & GOVERNMENT: INTERACTIVE DISPLAY MARKET, BY PRODUCT, 2024–2029 (USD MILLION)
                        TABLE 69 CORPORATE & GOVERNMENT: INTERACTIVE DISPLAY MARKET, BY REGION, 2020–2023 (USD MILLION)
                        TABLE 70 CORPORATE & GOVERNMENT: INTERACTIVE DISPLAY MARKET, BY REGION, 2024–2029 (USD MILLION)
     10.7 TRANSPORTATION 
             10.7.1 DEPLOYMENT OF INTERACTIVE KIOSKS IN AIRPORTS FOR EASY CHECK-IN TO DRIVE ADOPTION
                        TABLE 71 TRANSPORTATION: INTERACTIVE DISPLAY MARKET, BY PRODUCT, 2020–2023 (USD MILLION)
                        TABLE 72 TRANSPORTATION: INTERACTIVE DISPLAY MARKET, BY PRODUCT, 2024–2029 (USD MILLION)
                        TABLE 73 TRANSPORTATION: INTERACTIVE DISPLAY MARKET, BY REGION, 2020–2023 (USD MILLION)
                        TABLE 74 TRANSPORTATION: INTERACTIVE DISPLAY MARKET, BY REGION, 2024–2029 (USD MILLION)
     10.8 EDUCATION 
             10.8.1 ADOPTION OF INTERACTIVE DISPLAYS IN EDUCATIONAL INSTITUTIONS TO ENHANCE TEACHING AND LEARNING EXPERIENCES TO SUPPORT MARKET GROWTH
                        TABLE 75 EDUCATION: INTERACTIVE DISPLAY MARKET, BY PRODUCT, 2020–2023 (USD MILLION)
                        TABLE 76 EDUCATION: INTERACTIVE DISPLAY MARKET, BY PRODUCT, 2024–2029 (USD MILLION)
                        TABLE 77 EDUCATION: INTERACTIVE DISPLAY MARKET, BY REGION, 2020–2023 (USD MILLION)
                        TABLE 78 EDUCATION: INTERACTIVE DISPLAY MARKET, BY REGION, 2024–2029 (USD MILLION)
     10.9 SPORTS & ENTERTAINMENT 
             10.9.1 INCREASING PENETRATION OF INTERACTIVE DISPLAYS IN MOVIE HALLS AND GAME ZONES TO FOSTER MARKET GROWTH
                        TABLE 79 SPORTS & ENTERTAINMENT: INTERACTIVE DISPLAY MARKET, BY PRODUCT, 2020–2023 (USD MILLION)
                        TABLE 80 SPORTS & ENTERTAINMENT: INTERACTIVE DISPLAY MARKET, BY PRODUCT, 2024–2029 (USD MILLION)
                        TABLE 81 SPORTS & ENTERTAINMENT: INTERACTIVE DISPLAY MARKET, BY REGION, 2020–2023 (USD MILLION)
                        TABLE 82 SPORTS & ENTERTAINMENT: INTERACTIVE DISPLAY MARKET, BY REGION, 2024–2029 (USD MILLION)
     10.10 OTHER VERTICALS 
             TABLE 83 OTHER VERTICALS: INTERACTIVE DISPLAY MARKET, BY PRODUCT, 2020–2023 (USD MILLION)
             TABLE 84 OTHER VERTICALS: INTERACTIVE DISPLAY MARKET, BY PRODUCT, 2024–2029 (USD MILLION)
             TABLE 85 OTHER VERTICALS: INTERACTIVE DISPLAY MARKET, BY REGION, 2020–2023 (USD MILLION)
             TABLE 86 OTHER VERTICALS: INTERACTIVE DISPLAY MARKET, BY REGION, 2024–2029 (USD MILLION)
 
11 INTERACTIVE DISPLAY MARKET, BY REGION (Page No. - 124)
     11.1 INTRODUCTION 
             FIGURE 47 INTERACTIVE DISPLAY MARKET, BY REGION
             FIGURE 48 ASIA PACIFIC TO HOLD LARGEST MARKET SHARE IN 2029
             TABLE 87 INTERACTIVE DISPLAY MARKET, BY REGION, 2020–2023 (USD MILLION)
             TABLE 88 INTERACTIVE DISPLAY MARKET, BY REGION, 2024–2029 (USD MILLION)
     11.2 NORTH AMERICA 
             FIGURE 49 NORTH AMERICA: INTERACTIVE DISPLAY MARKET SNAPSHOT
             TABLE 89 NORTH AMERICA: INTERACTIVE DISPLAY MARKET, BY COUNTRY, 2020–2023 (USD MILLION)
             TABLE 90 NORTH AMERICA: INTERACTIVE DISPLAY MARKET, BY COUNTRY, 2024–2029 (USD MILLION)
             TABLE 91 NORTH AMERICA: INTERACTIVE DISPLAY MARKET, BY VERTICAL, 2020–2023 (USD MILLION)
             TABLE 92 NORTH AMERICA: INTERACTIVE DISPLAY MARKET, BY VERTICAL, 2024–2029 (USD MILLION)
             11.2.1 IMPACT OF RECESSION ON INTERACTIVE DISPLAY MARKET IN NORTH AMERICA
             11.2.2 US
                        11.2.2.1 Growing demand for advanced and feature-rich interactive displays for high customer engagement to drive market
             11.2.3 CANADA
                        11.2.3.1 Increasing adoption of interactive displays with advanced features such as multi-touch and gesture recognition to propel market
             11.2.4 MEXICO
                        11.2.4.1 Rising use of self-service kiosks in banking and finance sector to foster market growth
     11.3 EUROPE 
             FIGURE 50 EUROPE: INTERACTIVE DISPLAY MARKET SNAPSHOT
             TABLE 93 EUROPE: INTERACTIVE DISPLAY MARKET, BY COUNTRY, 2020–2023 (USD MILLION)
             TABLE 94 EUROPE: INTERACTIVE DISPLAY MARKET, BY COUNTRY, 2024–2029 (USD MILLION)
             TABLE 95 EUROPE: INTERACTIVE DISPLAY MARKET, BY VERTICAL, 2020–2023 (USD MILLION)
             TABLE 96 EUROPE: INTERACTIVE DISPLAY MARKET, BY VERTICAL, 2024–2029 (USD MILLION)
             11.3.1 IMPACT OF RECESSION ON INTERACTIVE DISPLAY MARKET IN EUROPE
             11.3.2 UK
                        11.3.2.1 Rising deployment in hospitality and retail verticals to drive market
             11.3.3 GERMANY
                        11.3.3.1 High adoption in hospitality sector to contribute to market growth
             11.3.4 FRANCE
                        11.3.4.1 High utilization in transportation and hospitality verticals to assist tourists to support market growth
             11.3.5 REST OF EUROPE
     11.4 ASIA PACIFIC 
             FIGURE 51 ASIA PACIFIC: INTERACTIVE DISPLAY MARKET SNAPSHOT
             TABLE 97 ASIA PACIFIC: INTERACTIVE DISPLAY MARKET, BY COUNTRY, 2020–2023 (USD MILLION)
             TABLE 98 ASIA PACIFIC: INTERACTIVE DISPLAY MARKET, BY COUNTRY, 2024–2029 (USD MILLION)
             TABLE 99 ASIA PACIFIC: INTERACTIVE DISPLAY MARKET, BY VERTICAL, 2020–2023 (USD MILLION)
             TABLE 100 ASIA PACIFIC: INTERACTIVE DISPLAY MARKET, BY VERTICAL, 2024–2029 (USD MILLION)
             11.4.1 IMPACT OF RECESSION ON INTERACTIVE DISPLAY MARKET IN ASIA PACIFIC
             11.4.2 CHINA
                        11.4.2.1 Implementation of supportive education policies to promote interactive learning to fuel market growth
             11.4.3 JAPAN
                        11.4.3.1 Commitment to deploying eco-friendly technologies to boost market growth
             11.4.4 SOUTH KOREA
                        11.4.4.1 Increasing adoption of interactive displays in retail and transportation industries to drive market
             11.4.5 INDIA
                        11.4.5.1 Widespread use of interactive displays in educational and BFSI industries to support market growth
             11.4.6 REST OF ASIA PACIFIC
     11.5 ROW 
             FIGURE 52 ROW: INTERACTIVE DISPLAY MARKET SNAPSHOT
             TABLE 101 ROW: INTERACTIVE DISPLAY MARKET, BY REGION, 2020–2023 (USD MILLION)
             TABLE 102 ROW: INTERACTIVE DISPLAY MARKET, BY REGION, 2024–2029 (USD MILLION)
             TABLE 103 ROW: INTERACTIVE DISPLAY MARKET, BY VERTICAL, 2020–2023 (USD MILLION)
             TABLE 104 ROW: INTERACTIVE DISPLAY MARKET, BY VERTICAL, 2024–2029 (USD MILLION)
             11.5.1 IMPACT OF RECESSION ON INTERACTIVE DISPLAY MARKET IN ROW
             11.5.2 SOUTH AMERICA
                        11.5.2.1 Need for dynamic interactive platforms to enhance customer experience and streamline operations to support market growth
             11.5.3 MIDDLE EAST & AFRICA
                        TABLE 105 MIDDLE EAST & AFRICA: INTERACTIVE DISPLAY MARKET, BY COUNTRY, 2020–2023 (USD MILLION)
                        TABLE 106 MIDDLE EAST & AFRICA: INTERACTIVE DISPLAY MARKET, BY COUNTRY, 2024–2029 (USD MILLION)
                        11.5.3.1 GCC countries
                                     11.5.3.1.1 Rising government-led smart city initiatives to drive market
                        11.5.3.2 Rest of Middle East & Africa
 
12 COMPETITIVE LANDSCAPE (Page No. - 144)
     12.1 OVERVIEW 
     12.2 STRATEGIES ADOPTED BY KEY PLAYERS 
             TABLE 107 OVERVIEW OF STRATEGIES ADOPTED BY INTERACTIVE DISPLAY MANUFACTURERS, 2020–2023
             12.2.1 PRODUCT PORTFOLIO
             12.2.2 REGIONAL FOCUS
             12.2.3 MANUFACTURING FOOTPRINT
             12.2.4 ORGANIC/INORGANIC GROWTH STRATEGIES
     12.3 MARKET SHARE ANALYSIS 
             FIGURE 53 INTERACTIVE DISPLAY MARKET SHARE ANALYSIS, 2023
             TABLE 108 INTERACTIVE DISPLAY MARKET: DEGREE OF COMPETITION, 2023
     12.4 FIVE-YEAR REVENUE ANALYSIS OF TOP MARKET PLAYERS 
             FIGURE 54 INTERACTIVE DISPLAY MARKET: REVENUE ANALYSIS OF TOP FIVE PLAYERS, 2018–2022
     12.5 COMPANY EVALUATION MATRIX 
             12.5.1 STARS
             12.5.2 EMERGING LEADERS
             12.5.3 PERVASIVE PLAYERS
             12.5.4 PARTICIPANTS
                        FIGURE 55 INTERACTIVE DISPLAY MARKET: COMPANY EVALUATION MATRIX, 2023
             12.5.5 COMPANY FOOTPRINT
                        TABLE 109 OVERALL COMPANY FOOTPRINT (25 COMPANIES)
                        TABLE 110 COMPANY PRODUCT FOOTPRINT (25 COMPANIES)
                        TABLE 111 COMPANY VERTICAL FOOTPRINT (25 COMPANIES)
                        TABLE 112 COMPANY REGION FOOTPRINT (25 COMPANIES)
     12.6 STARTUP/SMALL AND MEDIUM-SIZED ENTERPRISE (SME) EVALUATION MATRIX 
             12.6.1 PROGRESSIVE COMPANIES
             12.6.2 RESPONSIVE COMPANIES
             12.6.3 DYNAMIC COMPANIES
             12.6.4 STARTING BLOCKS
                        FIGURE 56 INTERACTIVE DISPLAY MARKET: STARTUP/SME EVALUATION MATRIX, 2023
             12.6.5 COMPETITIVE BENCHMARKING
                        TABLE 113 INTERACTIVE DISPLAY MARKET: LIST OF KEY STARTUPS/SMES
                        TABLE 114 INTERACTIVE DISPLAY MARKET: COMPETITIVE BENCHMARKING OF KEY STARTUPS/SMES
     12.7 INVESTMENTS AND FUNDING 
           TABLE 115 INTERACTIVE DISPLAY MARKET: INVESTMENTS AND FUNDING
     12.8 COMPETITIVE SCENARIOS AND TRENDS 
             12.8.1 PRODUCT LAUNCHES
                        TABLE 116 INTERACTIVE DISPLAY MARKET: PRODUCT LAUNCHES, JANUARY 2020–DECEMBER 2023
             12.8.2 DEALS
                        TABLE 117 INTERACTIVE DISPLAY MARKET: DEALS, JANUARY 2020–DECEMBER 2023
             12.8.3 OTHERS
                        TABLE 118 INTERACTIVE DISPLAY MARKET: OTHERS, JANUARY 2020–DECEMBER 2023
 
13 COMPANY PROFILES (Page No. - 170)
     13.1 KEY PLAYERS 
(Business Overview, Products/Services/Solutions Offered, MnM View, Key Strengths and Right to Win, Strategic Choices Made, Weaknesses and Competitive Threats, Recent Developments)*  
             13.1.1 SAMSUNG
                        TABLE 119 SAMSUNG: COMPANY OVERVIEW
                        FIGURE 57 SAMSUNG: COMPANY SNAPSHOT
                        TABLE 120 SAMSUNG: PRODUCTS/SOLUTIONS/SERVICES OFFERED
                        TABLE 121 SAMSUNG: PRODUCT LAUNCHES
                        TABLE 122 SAMSUNG: DEALS
             13.1.2 LG DISPLAY CO., LTD.
                        TABLE 123 LG DISPLAY CO., LTD.: COMPANY OVERVIEW
                        FIGURE 58 LG DISPLAY CO., LTD.: COMPANY SNAPSHOT
                        TABLE 124 LG DISPLAY CO., LTD.: PRODUCTS/SOLUTIONS/SERVICES OFFERED
                        TABLE 125 LG DISPLAY CO., LTD.: PRODUCT LAUNCHES
                        TABLE 126 LG DISPLAY CO., LTD.: DEALS
             13.1.3 PANASONIC CORPORATION
                        TABLE 127 PANASONIC CORPORATION: COMPANY OVERVIEW
                        FIGURE 59 PANASONIC CORPORATION: COMPANY SNAPSHOT
                        TABLE 128 PANASONIC CORPORATION: PRODUCTS/SOLUTIONS/SERVICES OFFERED
                        TABLE 129 PANASONIC CORPORATION: OTHERS
             13.1.4 LEYARD
                        TABLE 130 LEYARD: COMPANY OVERVIEW
                        FIGURE 60 LEYARD: COMPANY SNAPSHOT
                        TABLE 131 LEYARD: PRODUCTS/SOLUTIONS/SERVICES OFFERED
                        TABLE 132 LEYARD: PRODUCT LAUNCHES
                        TABLE 133 LEYARD: DEALS
             13.1.5 SHARP CORPORATION
                        TABLE 134 SHARP CORPORATION: COMPANY OVERVIEW
                        FIGURE 61 SHARP CORPORATION: COMPANY SNAPSHOT
                        TABLE 135 SHARP CORPORATION: PRODUCTS/SOLUTIONS/SERVICES OFFERED
                        TABLE 136 SHARP CORPORATION: DEALS
             13.1.6 BOE TECHNOLOGY GROUP CO., LTD.
                        TABLE 137 BOE TECHNOLOGY GROUP CO., LTD.: COMPANY OVERVIEW
                        FIGURE 62 BOE TECHNOLOGY GROUP CO., LTD.: COMPANY SNAPSHOT
                        TABLE 138 BOE TECHNOLOGY GROUP CO., LTD.: PRODUCTS/SOLUTIONS/SERVICES OFFERED
                        TABLE 139 BOE TECHNOLOGY GROUP CO., LTD.: PRODUCT LAUNCHES
                        TABLE 140 BOE TECHNOLOGY GROUP CO., LTD.: DEALS
             13.1.7 ELO TOUCH SOLUTIONS, INC.
                        TABLE 141 ELO TOUCH SOLUTIONS, INC.: COMPANY OVERVIEW
                        TABLE 142 ELO TOUCH SOLUTIONS, INC.: PRODUCTS/SOLUTIONS/SERVICES OFFERED
                        TABLE 143 ELO TOUCH SOLUTIONS, INC.: PRODUCT LAUNCHES
                        TABLE 144 ELO TOUCH SOLUTIONS, INC.: DEALS
             13.1.8 CRYSTAL DISPLAY SYSTEMS LTD.
                        TABLE 145 CRYSTAL DISPLAY SYSTEMS LTD.: COMPANY OVERVIEW
                        TABLE 146 CRYSTAL DISPLAY SYSTEMS LTD.: PRODUCTS/SOLUTIONS/SERVICES OFFERED
                        TABLE 147 CRYSTAL DISPLAY SYSTEMS LTD.: PRODUCTS LAUNCHES
                        TABLE 148 CRYSTAL DISPLAY SYSTEMS LTD.: DEALS
             13.1.9 VIEWSONIC CORPORATION
                        TABLE 149 VIEWSONIC CORPORATION: COMPANY OVERVIEW
                        TABLE 150 VIEWSONIC CORPORATION: PRODUCTS/SOLUTIONS/SERVICES OFFERED
                        TABLE 151 VIEWSONIC CORPORATION: PRODUCT LAUNCHES
             13.1.10 AUO CORPORATION
                        TABLE 152 AUO CORPORATION: COMPANY OVERVIEW
                        FIGURE 63 AUO CORPORATION: COMPANY SNAPSHOT
                        TABLE 153 AUO CORPORATION: PRODUCTS/SOLUTIONS/SERVICES OFFERED
                        TABLE 154 AUO CORPORATION: PRODUCT LAUNCHES
                        TABLE 155 AUO CORPORATION: DEALS
*Business Overview, Products/Services/Solutions Offered, MnM View, Key Strengths and Right to Win, Strategic Choices Made, Weaknesses and Competitive Threats, Recent Developments might not be captured in case of unlisted companies.  
     13.2 OTHER PLAYERS 
             13.2.1 GESTURETEK INC.
             13.2.2 ITS, INC.
             13.2.3 BAANTO INTERNATIONAL LTD.
             13.2.4 INTUIFACE
             13.2.5 QISDA CORPORATION
             13.2.6 BOXLIGHT
             13.2.7 EGAN VISUAL
             13.2.8 HITACHI, LTD.
             13.2.9 PROMETHEAN LIMITED
             13.2.10 VESTEL
             13.2.11 BARCO
             13.2.12 FIRSTOUCH DIGITAL SOLUTIONS
             13.2.13 SMART TECHNOLOGIES ULC
             13.2.14 HORIZON DISPLAY INC.
             13.2.15 SENSES ELECTRONICS PVT. LTD.
 
14 APPENDIX (Page No. - 222)
     14.1 DISCUSSION GUIDE 
     14.2 KNOWLEDGESTORE: MARKETSANDMARKETS’ SUBSCRIPTION PORTAL 
     14.3 CUSTOMIZATION OPTIONS 
     14.4 RELATED REPORTS 
     14.5 AUTHOR DETAILS 


The study involved four major activities in estimating the size of the interactive display market. Exhaustive secondary research has been conducted to collect information on the market, the peer markets, and the parent market. Both top-down and bottom-up approaches have been employed to estimate the total market size. Market breakdown and data triangulation methods have also been used to estimate the market for segments and subsegments.

Secondary Research

Revenues of companies offering interactive displays have been obtained from the secondary data available through paid and unpaid sources. The revenues have also been derived by analyzing the product portfolio of key companies, and these companies have been rated according to the performance and quality of their products.

Various secondary sources have been referred to in the secondary research process for identifying and collecting information important for this study. Secondary sources include corporate filings (such as annual reports, investor presentations, and financial statements); trade, business, and professional associations; white papers; IoT technologies journals and certified publications; articles by recognized authors; gold-standard and silver-standard websites; directories; and databases.

Secondary research has been conducted mainly to obtain critical information about the market’s value chain, the total pool of key players, market classification and segmentation according to the industry trends to the bottom-most level, geographic markets, and key developments from both demand- and technology-oriented perspectives. Secondary data has been collected and analyzed to determine the overall market size, further validated by primary research.

Primary Research

Extensive primary research has been conducted after understanding and analyzing the current scenario of the interactive display market through secondary research. Several primary interviews have been conducted with key opinion leaders from both demand and supply sides across 4 major regions: North America, Europe, Asia Pacific, and RoW. Approximately 25% of the primary interviews have been conducted on the demand side, while 75% have been conducted on the supply side. Primary data has been collected mainly through telephonic interviews, which consist of 80% of the total primary interviews. Questionnaires and e-mails have also been used to collect data.

After interacting with industry experts, brief sessions were conducted with highly experienced independent consultants to reinforce the findings from our primary. This, along with the in-house subject matter experts’ opinions, has led us to the findings as described in the remainder of this report. The breakdown of primary respondents is as follows:

Interactive Display Market
 Size, and Share

To know about the assumptions considered for the study, download the pdf brochure

Market Size Estimation

The bottom-up procedure has been employed to arrive at the overall size of the interactive display market.

  • Identifying the entities in the interactive display market influencing the entire market along with related component players
  • Analyzing major manufacturers of interactive displays, studying their portfolios, and understanding different types of products based on their features and functions
  • Analyzing trends in the usage of interactive display offerings
  • Tracking the ongoing and upcoming developments in the market, such as investments made, R&D activities, product launches, collaborations, and partnerships, and forecasting the market size based on these developments and other critical parameters
  • Carrying out multiple discussions with key opinion leaders to understand the different types of interactive displays, applications, and recent trends in the market, thereby analyzing the breakup of the scope of work carried out by major manufacturing companies
  • Arriving at the market estimates by analyzing segmental revenues of these companies generated by interactive display offerings and then combining the same to get the market estimate by different segments
  • Verifying and cross-checking the estimate at every level by discussing with key opinion leaders, such as Chief Experience Officers (CXOs), directors, and operations managers, and finally with the domain experts at MarketsandMarkets
  • Studying various paid and unpaid sources of information, such as annual reports, press releases, white papers, Factiva, and databases

Interactive Display Market
 Size, and Bottom-Up Approach

The top-down approach has been used to estimate and validate the total size of the interactive display market.

  • Focusing initially on the investments and expenditures being made in the ecosystems of various applications
  • Calculate the market size, considering revenues generated by major players through the cost of the interactive display.
  • Segmenting each application of interactive display in each region and deriving the global market size based on region.
  • Acquiring and analyzing information related to revenues generated by players through their key offerings.
  • Conducting multiple on-field discussions with key opinion leaders involved in the development of various interactive display offerings.
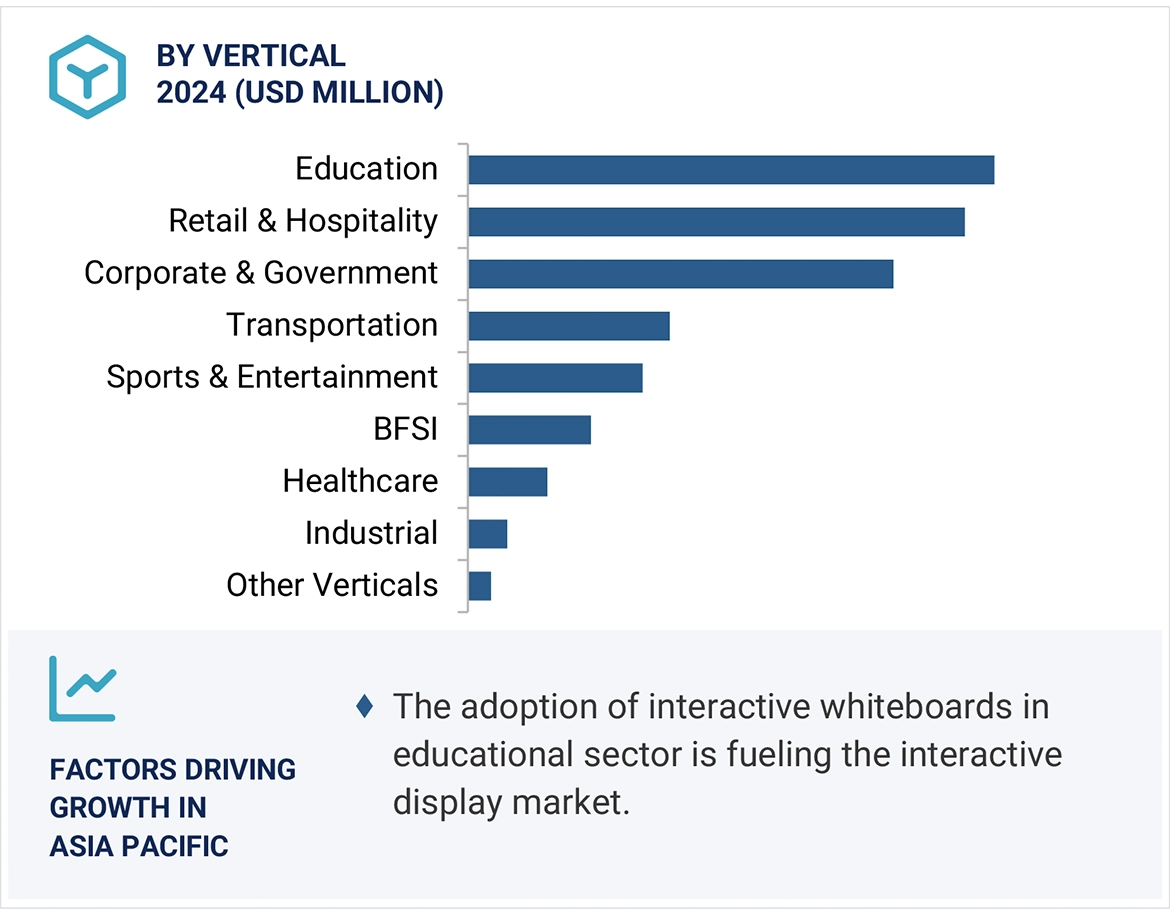
  • Estimating the geographic split using secondary sources based on various factors, such as the number of players in a specific country and region and the types of interactive display used in education, transportation, retail and hospitality, corporate and government, industrial, and healthcare.

Interactive Display Market
 Size, and Top-Down Approach

Data Triangulation

After arriving at the overall size of the interactive display market through the process explained, the total market has been split into several segments and subsegments. Market breakdown and data triangulation procedures have been employed, wherever applicable, to complete the overall market engineering process and arrive at the exact statistics for all segments and subsegments. The data has been triangulated by studying various factors and trends from the demand and supply sides. The market has also been validated using the top-down and bottom-up approaches.

Market Definition

An interactive display is a display that can accept input using touch. It is designed to provide customers access to information such as wayfinding, self-check-in, product availability at a departmental store, patient details, and others. These displays have specially designed software applications for creating an interactive experience while delivering information based on the input received from end users. Thus, interactive displays act as dynamic information-sharing devices in sectors such as retail, transportation, healthcare, and educational institutes.

Key Stakeholders

  • Raw material suppliers
  • Original equipment manufacturers (OEMs)
  • OEM technology providers
  • Original design manufacturers (ODMs)
  • Technology, service, and solution providers
  • Suppliers and distributors
  • Government and other regulatory bodies
  • Forums, alliances, and associations
  • Technology investors
  • Research institutes and organizations
  • Analysts and strategic business planners
  • Market research and consulting firms

Report Objectives

  • To define, describe, segment, and forecast the global interactive display market in terms of value on the basis of panel size, panel type, technology, vertical, and region
  • To define, describe, segment, and forecast the global interactive display market in terms of value and volume based on product.
  • To describe and forecast the market size, in terms of value, with respect to four major regions: North America, Europe, Asia Pacific (APAC), and the Rest of the World (RoW)
  • To provide detailed information regarding the major factors influencing the growth of the market (drivers, restraints, opportunities, and challenges)
  • To provide a detailed value chain for the interactive display industry and analyze the market trends
  • To strategically analyze the micromarkets1 with respect to individual growth trends, prospects, and contributions to the total market
  • To highlight the impact of Porter's five forces on the interactive display market ecosystem and analyze the underlying market opportunities
  • To analyze the associated case studies in the interactive display market business and their impact on the business strategies adopted by key players
  • To analyze the opportunities for stakeholders in the market and detail the competitive landscape of the market leaders
  • To provide key industry trends and associated important regulations impacting the global interactive display market
  • To strategically profile the key players and comprehensively analyze their market shares and core competencies
  • To benchmark players within the market using the proprietary company evaluation matrix framework, which analyzes market players on various parameters within the broad categories of market rank and product offering
  • To analyze the competitive strategies, such as contracts, joint ventures, and acquisitions, product launches and developments, and research and developments, adopted by the interactive display market players
  • To map the competitive intelligence on the basis of company profiles, key player strategies, and game-changing developments, such as contracts, product launches, collaborations, and acquisitions.

Available customizations:

With the given market data, MarketsandMarkets offers customizations according to the specific requirements of companies. The following customization options are available for the report:

  • Detailed analysis and profiling of additional market players based on various blocks of the supply chain
Custom Market Research Services

We will customize the research for you, in case the report listed above does not meet with your exact requirements. Our custom research will comprehensively cover the business information you require to help you arrive at strategic and profitable business decisions.

Request Customization
Report Code
SE 3537
Published ON
Jan, 2024
Choose License Type
BUY NOW
  • SHARE
X
Request Customization
Speak to Analyst
Speak to Analyst
OR FACE-TO-FACE MEETING
PERSONALIZE THIS RESEARCH
  • Triangulate with your Own Data
  • Get Data as per your Format and Definition
  • Gain a Deeper Dive on a Specific Application, Geography, Customer or Competitor
  • Any level of Personalization
REQUEST A FREE CUSTOMIZATION
LET US HELP YOU!
  • What are the Known and Unknown Adjacencies Impacting the Interactive Display Market
  • What will your New Revenue Sources be?
  • Who will be your Top Customer; what will make them switch?
  • Defend your Market Share or Win Competitors
  • Get a Scorecard for Target Partners
CUSTOMIZED WORKSHOP REQUEST
+1-888-600-6441
  • Call Us
  • +1-888-600-6441 (Corporate office hours)
  • +1-888-600-6441 (US/Can toll free)
  • +44-800-368-9399 (UK office hours)
CONNECT WITH US
ABOUT TRUST ONLINE
©2024 MarketsandMarkets Research Private Ltd. All rights reserved
DMCA.com Protection Status Website Feedback