Label Identification Market

Label Identification Market by Product (Label, Barcode, RFID, Laser, Printer, Scanner), Technology (Direct Thermal Printing, Inkjet), Throughput (High, Mid), Application (Biobanking, High Throughput Screening, Genomics) - Global Forecast to 2031



LABEL IDENTIFICATION MARKET SIZE, SHARE & GROWTH SNAPSHOT
Source: Secondary Research, Interviews with Experts, MarketsandMarkets Analysis
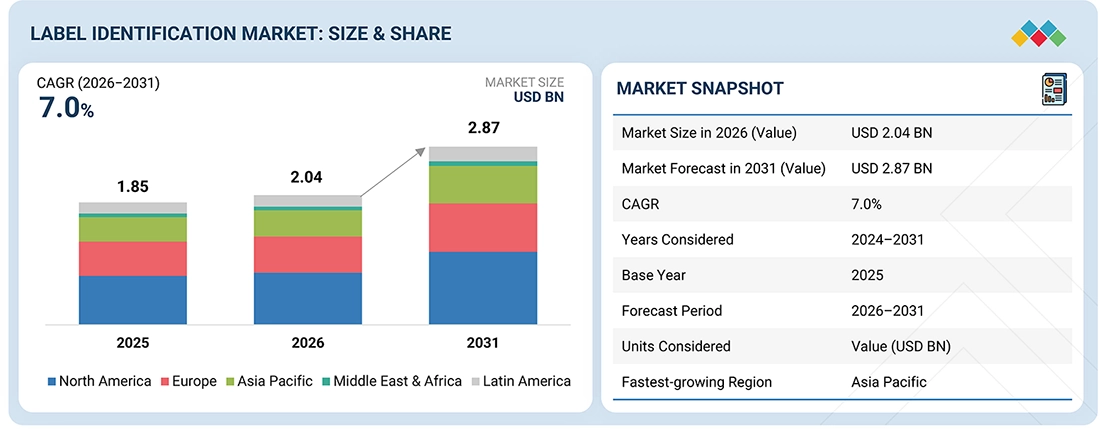
The global label identification market is projected to grow from USD 2.04 billion in 2026 to USD 2.87 billion by 2031, at a CAGR of 7.0% during the forecast period. The market was valued at USD 1.85 billion in 2025. The label identification market is experiencing robust growth, driven by increasing demand for rapid, accurate, and automated identification solutions across clinical diagnostics, pharmaceutical manufacturing, biotechnology research, food safety, and environmental testing. Key growth trends include the rising adoption of artificial intelligence (AI)-enabled identification platforms, MALDI-TOF mass spectrometry, molecular diagnostics, next-generation sequencing (NGS), and automated sample tracking technologies that improve laboratory efficiency and reduce turnaround times. Laboratories are increasingly investing in integrated workflows that combine specimen identification, data management, and analytical testing to address growing sample volumes, regulatory requirements, and workforce shortages.
KEY TAKEAWAYS
-
MARKET SNAPSHOT:
Base Year Market Size (2025): USD 1.85 Billion
Current Market Size (2026): USD 2.04 Billion
Forecast Market Size (2031): USD 2.87 Billion
CAGR (2026–2031): 7.0% -
SEGMENT LEADERSHIP:
Fastest-Growing Region: Asia Pacific is projected to register the highest CAGR of 9.0% during the forecast period.
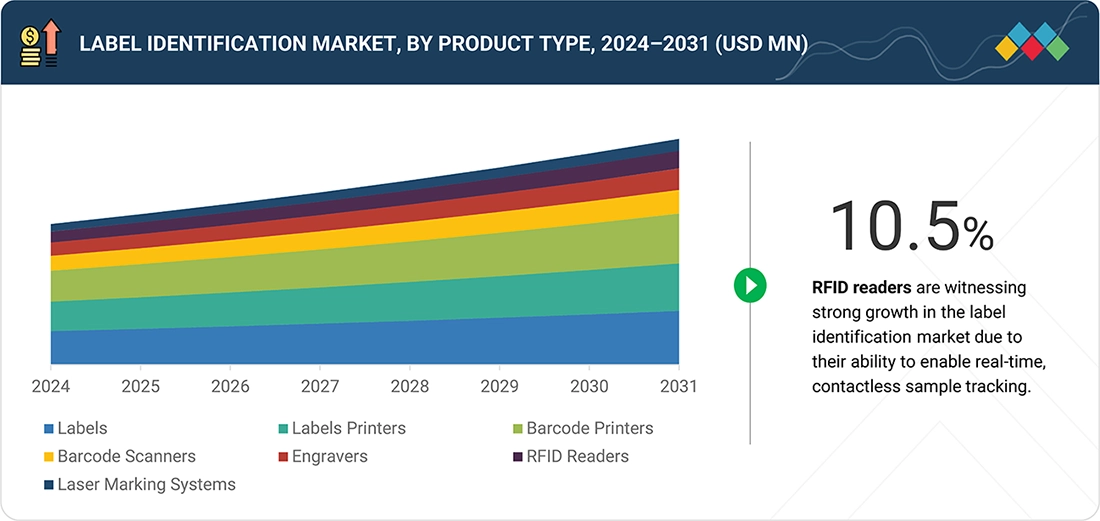
Fastest-Growing Product: Labels segment is expected to register the highest CAGR of 6.2% during the forecast period.
Technology Leader: Thermal transfer printing (THT) technologies segment held the largest share of 32% in 2025.
Throughput Leader: Medium-throughput segment held the largest market share of 45% in 2025.
Fastest-Growing Application: Genomics and proteomics segment is expected to register the highest CAGR during the forecast period. -
MARKET OUTLOOK & COMPETITIVE LANDSCAPE:
Thermo Fisher Scientific, Eppendorf, and Honeywell are focusing on expanding automated sample identification, barcode tracking, laboratory informatics, and workflow integration solutions to improve traceability, operational efficiency, and data accuracy across laboratory environments.
Agaram Technologies, Azenta Life Sciences, Brady Corporation, Brooks Automation, and Cognex Corporation are emphasizing laboratory automation, intelligent sample tracking, barcode and machine-vision technologies, and integrated informatics platforms to enhance specimen traceability, workflow efficiency, and regulatory compliance.
The label identification market is experiencing rapid growth as laboratories across the healthcare, pharmaceutical, biotechnology, food safety, and environmental sectors increasingly seek faster, more accurate, and highly automated identification solutions. Market growth is being fueled by the adoption of advanced technologies, including AI-powered identification systems, MALDI-TOF mass spectrometry, molecular diagnostics, next-generation sequencing (NGS), and automated specimen-tracking platforms, which enhance productivity and diagnostic accuracy. Laboratories are also moving toward integrated, digitized workflows that streamline sample identification, testing, and data management while helping to address rising testing volumes and labor shortages. Growing investments in precision medicine, infectious disease monitoring, genomics research, biobanking, and high-throughput screening are further driving demand for sophisticated identification technologies. In addition, the increasing use of laboratory automation, cloud-connected informatics platforms, barcode and RFID-based tracking systems, and smart laboratory infrastructure is accelerating the shift toward connected, data-centric laboratory environments, supporting sustained market growth worldwide.
TRENDS & DISRUPTIONS IMPACTING CUSTOMERS' CUSTOMERS
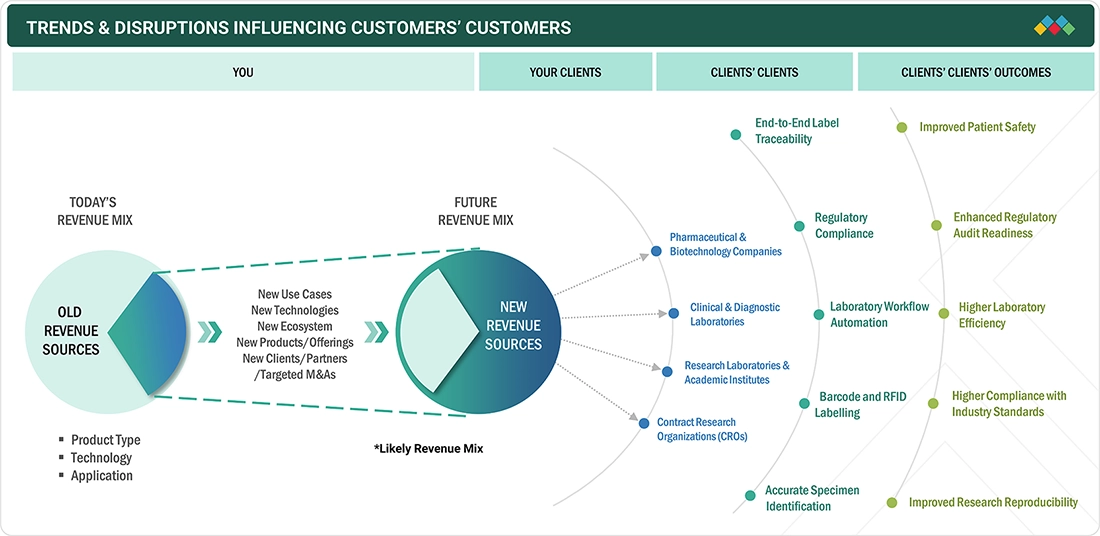
The label identification market is undergoing significant transformation as companies expand beyond traditional product-focused revenue streams toward solution-driven offerings centered on end-to-end sample traceability, laboratory workflow automation, high-throughput sample management, and regulatory compliance. Key trends include the adoption of digital identification technologies, automation platforms, integrated data management systems, and traceability solutions that support pharmaceutical, biotechnology, clinical diagnostics, research institutions, and CROs. Market disruptions are being driven by increasing regulatory scrutiny, the need for real-time sample visibility, growing laboratory complexity, and the integration of advanced technologies such as automation, IoT-enabled tracking, and data analytics. These shifts are reshaping customer priorities from standalone identification products to comprehensive workflow solutions. The impact is substantial, enabling laboratories and their clients to improve patient safety, accelerate diagnostic results, enhance audit readiness, reduce sample loss and human errors, and increase operational efficiency, ultimately creating new revenue opportunities and strengthening competitive differentiation across the laboratory ecosystem.
Source: Secondary Research, Interviews with Experts, MarketsandMarkets Analysis
MARKET DYNAMICS

Level
-
Shift from Traditional Barcodes to RFID-enabled Tracking

-
Growing Integration with Cloud-based LIMS and Laboratory Informatics Platforms


Level
-
Technical Limitations of RFID in Laboratory Environments

-
High Implementation and Infrastructure Costs


Level
-
Expansion of Biobanking and Precision Medicine Programs

-
Growing Adoption of AI-powered Laboratory Automation


Level
-
Complexity of Integrating Multiple Digital Technologies

-
Cybersecurity and Data Integrity Risks

Source: Secondary Research, Interviews with Experts, MarketsandMarkets Analysis
Driver: Shift from Traditional Barcodes to RFID-enabled Tracking
A significant technology transition is underway in label identification, with laboratories increasingly moving beyond conventional standalone 1D and 2D barcode systems toward hybrid barcode-RFID tracking solutions. While barcodes remain the industry standard for sample identification, RFID is gaining traction due to its ability to enable non-line-of-sight reading, simultaneous scanning of multiple samples, real-time inventory monitoring, and enhanced traceability across laboratory workflows. Recent trends include the growing adoption of RFID-enabled sample storage systems in biobanking and cryogenic environments, the integration of RFID data with cloud-based LIMS platforms for real-time asset visibility, and the deployment of smart laboratory infrastructure that supports automated sample handling and inventory management. As laboratories continue to digitize operations and increase throughput, hybrid barcode-RFID technologies are emerging as a preferred solution to improve operational efficiency, reduce manual intervention, and ensure end-to-end sample traceability in regulated environments.
Restraint: Technical Limitations of RFID in Laboratory Environments
Despite the growing adoption of RFID technology in label identification and sample tracking applications, several technical challenges continue to limit its widespread implementation. RFID performance can be affected by laboratory conditions such as metal equipment, liquid-containing samples, densely packed storage systems, and ultra-low-temperature environments used in biobanking and cryogenic preservation. Signal interference, inconsistent read rates, and reduced tag performance in these settings can impact tracking accuracy and operational reliability. Recent trends toward high-density biobanking, automated freezer storage, and large-scale genomic and cell therapy research have further increased the demand for highly reliable tracking solutions, exposing the limitations of current RFID systems. Additionally, laboratories often require specialized cryo-resistant tags, advanced reader infrastructure, and extensive validation processes, which increase deployment complexity and costs. As a result, many laboratories continue to rely on hybrid barcode-RFID systems rather than fully transitioning to RFID-based identification, slowing the adoption of next-generation laboratory tracking technologies.
Opportunity: Growing Adoption of AI-Powered Laboratory Automation
The growing implementation of artificial intelligence (AI), machine vision, and advanced laboratory automation platforms is creating significant opportunities for the label identification market. Modern AI-enabled identification systems can automatically validate sample labels, recognize damaged or poorly printed barcodes, detect identification discrepancies, and enhance tracking accuracy across laboratory workflows, reducing reliance on manual processes. Recent trends include the integration of AI-powered image recognition, computer vision-based barcode scanning, and predictive workflow analytics with laboratory automation systems and cloud-based LIMS platforms. These technologies are increasingly being adopted in high-throughput diagnostics, genomics, biobanking, pharmaceutical research, and clinical laboratories to improve operational efficiency, support real-time sample traceability, and minimize human error. As laboratories continue their digital transformation toward smart and autonomous operations, demand for intelligent identification solutions capable of enabling seamless data capture, automated decision-making, and end-to-end workflow optimization is expected to accelerate, creating substantial growth opportunities for market participants.
Challenge: Complexity of Integrating Multiple Digital Technologies
The rapid evolution toward smart, digitally connected laboratories has increased the complexity of integrating diverse identification and data management technologies into laboratory workflows. Modern laboratories are increasingly adopting barcode and RFID tracking systems, automated sample handling platforms, IoT-enabled monitoring devices, cloud-based laboratory information management systems (LIMS), digital twin technologies, and AI-powered analytics solutions to enhance operational efficiency and traceability. However, ensuring seamless communication and interoperability among these platforms remains a significant challenge, especially for facilities relying on legacy software, fragmented databases, and older laboratory equipment. Recent trends such as the expansion of automated biobanking, real-time sample monitoring, remote laboratory operations, and enterprise-wide data integration have further heightened the need for standardized data formats and compatible technology ecosystems. The lack of universal standards, combined with complex implementation requirements, lengthy validation processes, and high levels of system customization, can increase deployment costs and slow digital transformation initiatives, creating a key challenge to the broader adoption of advanced laboratory identification technologies.
LABEL IDENTIFICATION MARKET: COMMERCIAL USE CASES ACROSS INDUSTRIES
| COMPANY | USE CASE DESCRIPTION | BENEFITS |
|---|---|---|
 |
Provides barcode- and RFID-based laboratory identification solutions for sample labeling, specimen tracking, biobanking, and integration with laboratory information management systems (LIMS) | Supports traceability across research, clinical, and pharmaceutical workflows | Reduces sample identification errors | Improves regulatory compliance and audit readiness | Enhances sample traceability throughout the lifecycle | Increases laboratory productivity and workflow efficiency |
 |
Offers laboratory sample identification and cryogenic labeling solutions for biobanks, genomics laboratories, and research institutions | Enables reliable identification of tubes, plates, and storage containers under extreme conditions | Ensures long-term sample integrity and traceability | Supports biobanking and cold-storage applications |Minimizes sample loss and mix-ups | Streamlines inventory and storage management |
 |
Delivers barcode printing, scanning, RFID, and mobile data-capture technologies for laboratory sample tracking and asset identification | Supports automated workflows in diagnostic, pharmaceutical, and testing laboratories | Improves data accuracy and real-time visibility | Reduces manual data-entry errors | Enables automated sample tracking | Enhances operational efficiency and throughput |
 |
Provides automated sample management, intelligent storage systems, RFID-enabled tracking, and laboratory identification solutions for biobanking, drug discovery, and life science research | Enables end-to-end sample chain-of-custody management | Supports high-throughput laboratory operations | Improves sample retrieval and storage accuracy | Accelerates research and drug development workflows |
Logos and trademarks shown above are the property of their respective owners. Their use here is for informational and illustrative purposes only.
MARKET ECOSYSTEM
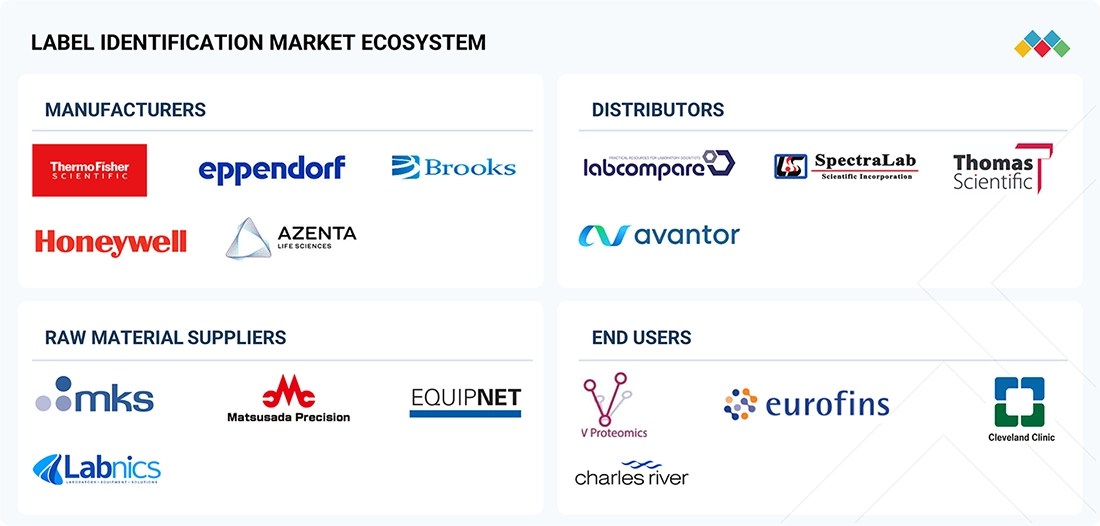
The label identification ecosystem comprises a highly interconnected network of manufacturers, raw material suppliers, distributors, and end users that collectively drive innovation and market adoption. Leading manufacturers such as Thermo Fisher Scientific, Eppendorf, Azenta Life Sciences, Brooks Automation, and Honeywell develop identification, labeling, tracking, and sample management solutions, supported by raw material and component suppliers that provide precision equipment, sensors, and specialized laboratory infrastructure. Distributors play a critical role in expanding market reach and providing technical support, ensuring efficient delivery of technologies to laboratories worldwide. Demand is primarily driven by end users, including clinical laboratories, biopharmaceutical companies, contract research organizations (CROs), research institutes, and healthcare providers such as Eurofins Scientific, Charles River Laboratories, and the Cleveland Clinic. This ecosystem fosters continuous collaboration across the value chain, accelerating innovation in sample traceability, workflow automation, compliance management, and data integrity, while enabling laboratories to improve operational efficiency, reduce errors, and meet increasingly stringent regulatory and quality requirements.
Logos and trademarks shown above are the property of their respective owners. Their use here is for informational and illustrative purposes only.
MARKET SEGMENTS
Source: Secondary Research, Interviews with Experts, MarketsandMarkets Analysis
Label Identification Market, by Product Type
Labels are gaining widespread adoption in the label identification market. The increasing adoption of automated and error-free sample identification workflows is driving demand for advanced laboratory labeling technologies across clinical diagnostics, pharmaceutical and biotechnology, research, and environmental testing laboratories. Laboratories are increasingly shifting from handwritten and conventional labels to durable barcode and RFID-enabled labels that improve sample traceability, regulatory compliance, and data integrity while minimizing identification errors. The growing implementation of laboratory automation, laboratory information management systems (LIMS), and high-throughput testing is further accelerating the need for chemically resistant, cryogenic, and heat-resistant labels that can withstand harsh laboratory conditions. Additionally, the expansion of precision medicine, biobanking, and molecular diagnostics is boosting demand for high-performance labeling solutions that ensure accurate tracking of samples throughout their lifecycle, supporting the overall growth of the label identification market.
Label Identification Market, by Technology
Thermal transfer printing technologies are witnessing increasing adoption in the label identification market. The growing demand for durable, high-resolution, and error-free sample identification is driving the adoption of thermal transfer printing in the label identification market. Laboratories in pharmaceutical, biotechnology, clinical diagnostics, and research settings increasingly prefer thermal transfer printers because they produce long-lasting labels that resist chemicals, moisture, abrasion, extreme temperatures, and cryogenic storage conditions. The rising implementation of laboratory automation, barcode-based sample tracking, and Laboratory Information Management Systems (LIMS) is further accelerating the use of thermal transfer printing, as it enables reliable barcode readability and regulatory compliance while improving workflow efficiency, reducing labeling errors, and ensuring complete sample traceability across laboratory operations.
Label Identification Market, by Application
The rapid expansion of genomics and proteomics research is a key growth driver for the label identification market, as these applications require precise, high-throughput sample identification and traceability. Increasing investments in next-generation sequencing (NGS), biomarker discovery, precision medicine, and large-scale biobanking are driving demand for advanced labeling, barcode, and RFID-based identification solutions that minimize sample mix-ups and ensure data integrity. Additionally, the growing adoption of automated laboratory workflows and Laboratory Information Management Systems (LIMS) is further accelerating the use of reliable label identification technologies to support efficient sample tracking, regulatory compliance, and reproducible research outcomes across genomics and proteomics laboratories.
REGION
Asia Pacific to be the fastest-growing region in the label identification market during the forecast period
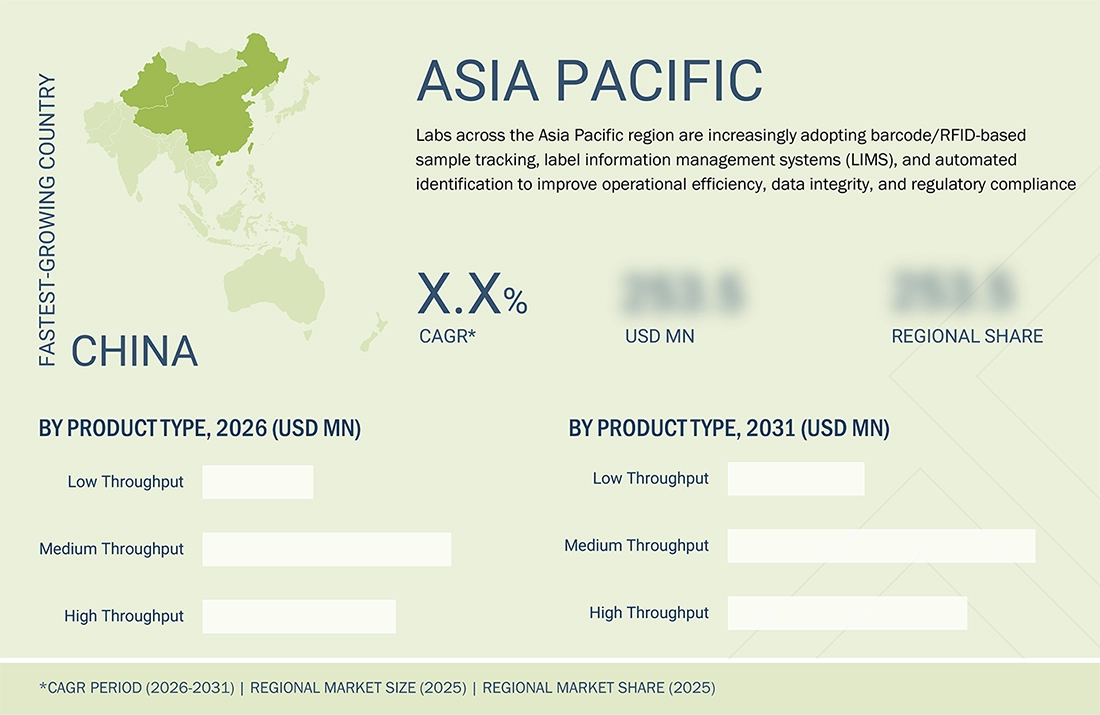
The Asia Pacific label identification market is experiencing strong growth due to expanding healthcare infrastructure, increasing investments in pharmaceutical and biotechnology research, and the rapid adoption of laboratory automation across emerging economies such as China, India, Japan, and South Korea. Rising demand for molecular diagnostics, genomics research, clinical testing, and biobanking is accelerating the adoption of advanced labeling, barcoding, RFID, and sample-tracking solutions to improve workflow efficiency and sample traceability. Furthermore, growing government support for life sciences research, increasing clinical trial activity, and the expansion of diagnostic laboratories are driving the demand for reliable label identification across the region.
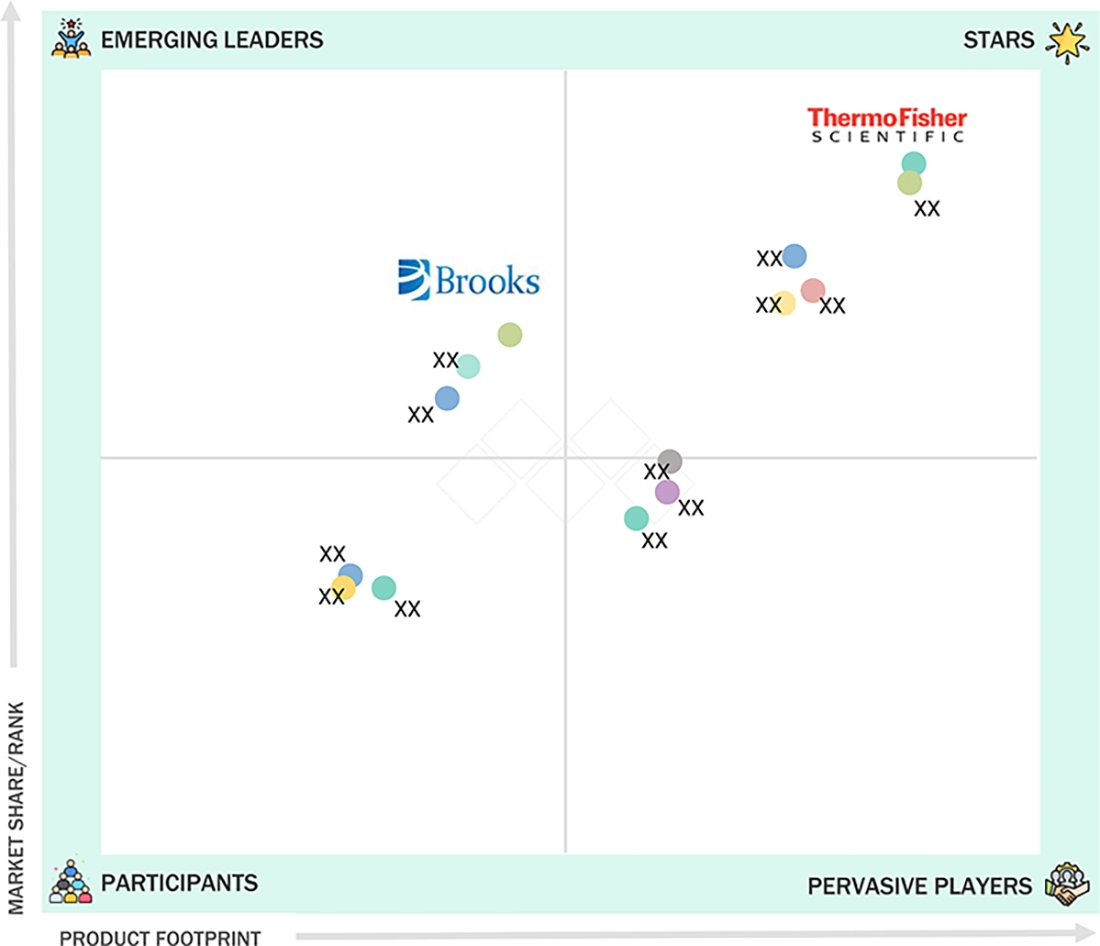
LABEL IDENTIFICATION MARKET: COMPANY EVALUATION MATRIX
The company evaluation landscape in the label identification market indicates a clear segmentation between market leaders, established participants, and emerging challengers based on product footprint and market presence. Companies positioned in the "Stars" quadrant demonstrate strong competitive advantages through comprehensive portfolios, global reach, advanced technological capabilities, and broad customer adoption, with Thermo Fisher Scientific emerging as a leading market player for its extensive identification, sample management, and laboratory workflow solutions. Other vendors occupy positions across the spectrum, reflecting varying levels of market penetration and solution breadth, while emerging leaders are gaining traction through innovation, niche specialization, and expansion into high-growth applications. The evaluation highlights that success in this market is increasingly determined by the ability to deliver integrated traceability platforms, automation capabilities, regulatory compliance support, and scalable laboratory identification solutions, with companies that combine strong product portfolios and broad market reach best positioned to capitalize on growing demand from pharmaceutical, biotechnology, clinical diagnostics, and research laboratory customers.
Source: Secondary Research, Interviews with Experts, MarketsandMarkets Analysis
KEY MARKET PLAYERS
- Thermo Fisher Scientific, Inc (US)
- Eppendorf (Germany)
- Honeywell (US)
- Cognex Corporation (US)
- Brooks Automation (US)
- Brady Corporation (US)
- Azenta Life Sciences (US)
- Agaram Technologies (India)
MARKET SCOPE
| REPORT METRIC | DETAILS |
|---|---|
| Market Size in 2025 (Value) | USD 1.85 Billion |
| Market Size in 2026 (Value) | USD 2.04 Billion |
| Market Forecast in 2031 (value) | USD 2.87 Billion |
| Growth Rate | CAGR of 7.0% from 2026–2031 |
| Years Considered | 2024–2031 |
| Base Year | 2025 |
| Forecast Period | 2026–2031 |
| Units Considered | Value (USD Billion) |
| Report Coverage | Revenue Forecast, Company Ranking, Competitive Landscape, Growth Factors, and Trends |
| Segments Covered |
|
| Region Covered | North America, Europe, Asia Pacific, Latin America, Middle East & Africa |
WHAT IS IN IT FOR YOU: LABEL IDENTIFICATION MARKET REPORT CONTENT GUIDE
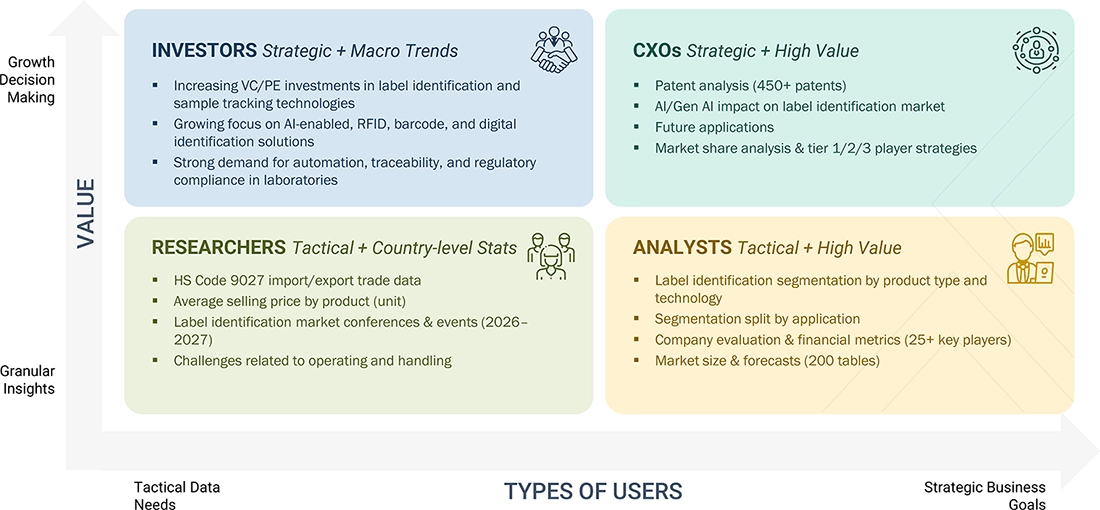
DELIVERED CUSTOMIZATIONS
We have successfully delivered the following deep-dive customizations:
| CLIENT REQUEST | CUSTOMIZATION DELIVERED | VALUE ADDS |
|---|---|---|
| Laboratory Identification Technologies |
|
|
RECENT DEVELOPMENTS
- April 2026 : Brady Corporation entered into a definitive agreement to acquire Honeywell's Productivity Solutions and Services (PSS) business, comprising mobile computers, barcode scanners, printing solutions, and software for USD 1.4 billion in cash. The deal is expected to close in H2 2026, subject to regulatory approvals.
- August 2025 : Brady Corporation (US) acquired Mecco Partners, LLC, a specialist in laser marking and pin marking systems, complementing the Gravotech acquisition to advance end-to-end direct part marking and specialty identification solutions.
- January 2025 : Brady Corporation (US) launched the i7500 high-speed printer featuring LabelSense technology for rapid material changeover with zero waste, targeting high-volume industrial and laboratory identification workflows.
Table of Contents
 Exclusive indicates content/data unique to MarketsandMarkets and not available with any competitors.
Methodology
This study balanced primary and secondary research into the label identification market by analyzing various market variables affecting small, medium, and large businesses. The next step involved conducting primary research with industry experts along the value chain to validate the findings, assumptions, and market sizing. Multiple methodologies, including both top-down and bottom-up approaches, were employed to estimate the overall market size.
The study encompasses market segments, evolving trends, regulatory frameworks, and competitive dynamics. It also examines leading market players and the strategies they employ in this sector. In conclusion, the total market size was estimated using a combination of top-down and bottom-up approaches, with data triangulation to finalize the market size. Primary research was conducted throughout the study to validate and test each hypothesis.
Secondary Research
During the study, secondary research was conducted using a range of sources, including directories and databases such as Bloomberg Businessweek, D&B Hoovers, and Factiva. Additional materials included white papers, annual reports, SEC filings, and investor presentations. This research approach was adopted to collect and analyze data that provides comprehensive, technical, and market-focused insights into the label identification market. The findings offer insights into key players and market segmentation, informed by recent industry trends and significant developments. A database comprising leading industry figures was also created as part of this secondary research.
Primary Research
Primary research involved activities designed to gather both qualitative and quantitative data. A variety of individuals from both the supply and demand sides were interviewed during this phase. On the supply side, key figures such as CEOs, vice presidents, directors of marketing and sales, directors of technology and innovation, and other important leaders were interviewed by industry experts. On the demand side, primary sources included academic institutions and research organizations. This research aimed to validate market segmentation, identify prominent market participants, and gain insights into significant industry trends and market dynamics through a real-world primary study.
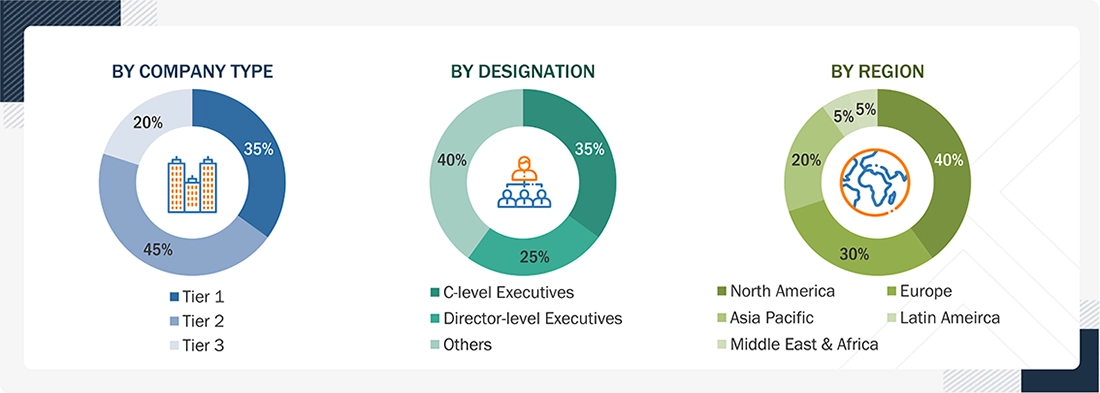
Note: Others include distributors, suppliers, product managers, business development managers, marketing managers, and sales managers.
Companies are categorized into tiers based on their total revenue. As of 2025, Tier 1 = >USD 1,000 million, Tier 2 = USD 500–1,000 million, and Tier 3 = <USD 500 million.
To know about the assumptions considered for the study, download the pdf brochure
Market Size Estimation
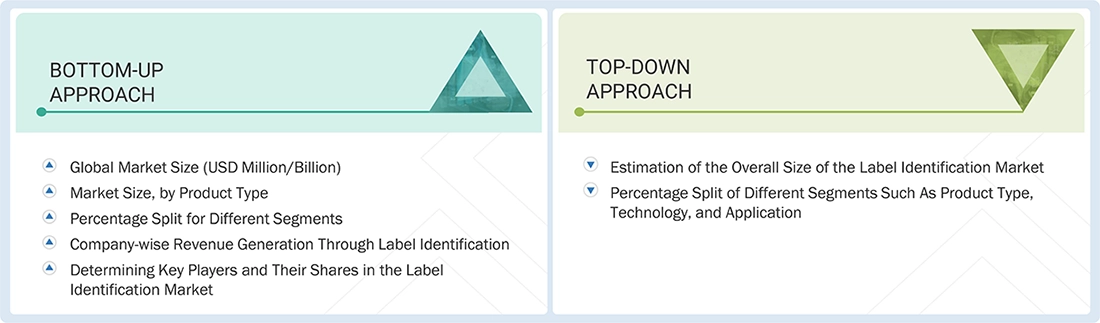
This report provides an analysis of the global label identification market size by reviewing the revenue shares of prominent companies. Key players with significant market shares were identified through secondary research, and their revenue from label identification product sales was calculated and subsequently validated through primary research. The secondary research included an analysis of annual and financial reports from leading market participants. Meanwhile, the primary research involved in-depth interviews with key thought leaders, such as directors, CEOs, and marketing executives.
To calculate the global market value, segmental revenues were determined based on the revenue mapping of service and product providers. The process involved the following steps:
- Generating a list of key players that operate in the label identification market at the regional or global levels
- Mapping the products of manufacturers of label identification and related product lines at the regional level
- Mapping the revenues of listed players through the sales of label identification and related products
- Mapping the revenues of major players to cover at least ~25–30% of the global market share as of 2025
- Extrapolating the mapped revenues of players to arrive at the global label identification market value for the respective segment
- Summing up the market value for all segments and subsegments to achieve the actual value of the global label identification market
Data Triangulation
After estimating the overall market size, the label identification market was classified into subsegments. The overall market engineering process was finalized through data triangulation and market segmentation, yielding accurate statistics for all segments and subsegments. This triangulation involved analyzing various trends and factors on both the demand and supply sides. Furthermore, label identification market data were verified and validated using both top-down and bottom-up approaches.
Market Definition
The label identification market comprises technologies, instruments, software, and consumables used to accurately identify, authenticate, and track biological, chemical, and material samples in laboratory environments. These technologies include barcode and RFID systems, laboratory information management systems (LIMS), sample labeling and tracking solutions, molecular identification technologies, microbial identification systems, and automated data management platforms. Label identification is widely used across pharmaceutical and biotechnology companies, clinical and diagnostic laboratories, academic and research institutes, food and beverage testing, environmental testing, and forensic laboratories to improve sample traceability, workflow efficiency, regulatory compliance, data integrity, and the accuracy of analytical and diagnostic results.
Key Stakeholders
- Research & Development Directors
- Analytical Laboratory Managers
- Scientists
- Quality Control (QC) Managers
- Quality Assurance (QA) Directors
- Procurement Managers
- Supply Chain Managers
- Bioprocessing Managers
- Manufacturing Operations Directors
- Clinical Research Managers
- Product Development Scientists
- Regulatory Affairs Managers
- Laboratory Directors
- Sales & Marketing Directors
- CRO/CDMO Operations Managers
Report Objectives
- To define, describe, and forecast the size of the label identification market based on product type, technology, application, and region
- To provide detailed information regarding the factors influencing the growth potential of the global label identification market (drivers, restraints, opportunities, challenges, and trends)
- To analyze micromarkets with respect to individual growth trends, prospects, and contributions to the global label identification market
- To analyze key growth opportunities in the global label identification market for key stakeholders and provide details of the competitive landscape for market leaders
- To forecast the size of market segments and/or subsegments concerning five regions, namely, North America (US and Canada), Europe (Germany, France, the UK, Spain, Italy, and the Rest of Europe), Asia Pacific (Japan, China, India, Australia, South Korea, and the Rest of Asia Pacific), Latin America (Brazil, Mexico, and the Rest of Latin America), and the Middle East & Africa (GCC Countries and the Rest of Middle East & Africa)
- To profile the key players in the label identification market and comprehensively analyze their market shares and core competencies
- To track and analyze the competitive developments undertaken in the global label identification market, such as product launches/approvals, agreements, expansions, collaborations, and acquisitions.
Available customizations:
With the given market data, MarketsandMarkets offers customizations based on your company’s specific needs. The following customization options are available for the present global label identification market report:
Product Analysis
- Product matrix, which gives a detailed comparison of the product portfolios of the top 15 companies
Company Information
- Detailed analysis and profiling of additional market players (up to 13)
Geographic Analysis
- Further breakdown of the Rest of Europe label identification market into Russia, Belgium, the Netherlands, Switzerland, Austria, Finland, Sweden, Poland, and Portugal
- Further breakdown of the Rest of Asia Pacific label identification market into Singapore, Taiwan, New Zealand, the Philippines, Malaysia, and other Asia Pacific countries
- Further breakdown of the Rest of Latin America label identification market into Argentina, Chile, Peru, and Colombia.


Personalize This Research
- Triangulate with your Own Data
- Get Data as per your Format and Definition
- Gain a Deeper Dive on a Specific Application, Geography, Customer or Competitor
- Any level of Personalization
Let Us Help You
- What are the Known and Unknown Adjacencies Impacting the Label Identification Market
- What will your New Revenue Sources be?
- Who will be your Top Customer; what will make them switch?
- Defend your Market Share or Win Competitors
- Get a Scorecard for Target Partners

Custom Market Research Services
We Will Customise The Research For You, In Case The Report Listed Above Does Not Meet With Your Requirements
Get 10% Free CustomisationTESTIMONIALS

JAYANT RAJPUROHIT
Director of Market Insights, Data and Analytics
SFI Health,
Leading Pharmaceutical Companywww.sfihealth.com/
We at SFI Health approached MarketsandMarkets for an Opportunity Assessment on "Incidence and Prevalence of Focus Indications" as we wanted to know the most attractive HCPs like Physician, Functional MD, Naturopath and Pharmacist. The project was critical for us to ensure our focus on the right target which would enable sustainable growth and profitability for SFI Health. The business insights provided exceeded our expectations and we were extremely impressed. The team at MarketsandMarkets is highly professional and detail oriented and very well understood our business needs. MarketsandMarkets offers a unique combination of expertise and dedicated engagement model. We identified 2 new products to be launched in coming months, based on the research findings provided by MarketsandMarkets. We are happy with the services and would strongly recommend MarketsandMarkets to my peers in the industry.

BEATRIZ DE LA CALLE
Head of Commercial Analytics
Qualicaps,
Leading Pharmaceutical Companywww.qualicaps.com/

We partnered with MarketsandMarkets for an assessment study on hard empty capsules. The team was extremely professional in understanding our business requirements and we received timely responses to all our queries. The market intelligence and the recommendations has met our business requirements. We were extremely impressed to see the final study results; it really exceeded our expectations. The market intelligence offered by MarketsandMarkets, and clarity on next steps will help us achieve our business objective for the Year 2021. We are happy with the services and would strongly recommend MarketsandMarkets to my peers in the industry.

Bob Williams,
Senior Director Business Development & Innovation
Bracco Diagnostics Inc.,
Italian Multinational in life sciences sector and a World Leader in imaging diagnosticsimaging.bracco.com/us-en
We were pleased with targeted insights that MarketsandMarkets identified from a custom study on the 'Radiation Dose Management Solutions Market'. Your team identified and characterized the market participants as well as underlying trends accurately. This study was useful to Bracco in formulating business strategies for our dose monitoring product lines and we thank MarketsandMarkets for the job well done.
Cody Coonradt,
Market Development and Strategy Manager
3M Health Information Systems,
Leader in Health care Coding, Payment & Analytics Solutions.www.3m.com/3M/en_US/health-information-systems-us
The value for our organization comes from three things: depth of research, specificity of segments and being easy to work with. As important as the first two are, the third can't be underestimated. MarketsandMarkets, maybe more than any other research vendor, wants to know what is top of mind for our team and what big questions we are grappling to answer.
Their customer first approach and high value engagement model, have given us great analysis and excellent value for money






Growth opportunities and latent adjacency in Label Identification Market