
Laser Optics Market Size, Share and Trends

Laser Optics Market Size, Share and Trends by Component (Laser Mirrors, Laser Lenses, Splitters, Optical Modulators), Application (Laser Processing, Optical Communication, Medical Laser Systems), End-user Industry and Region - Global Forecast to 2030


Laser Optics Market Size, Share & Trends
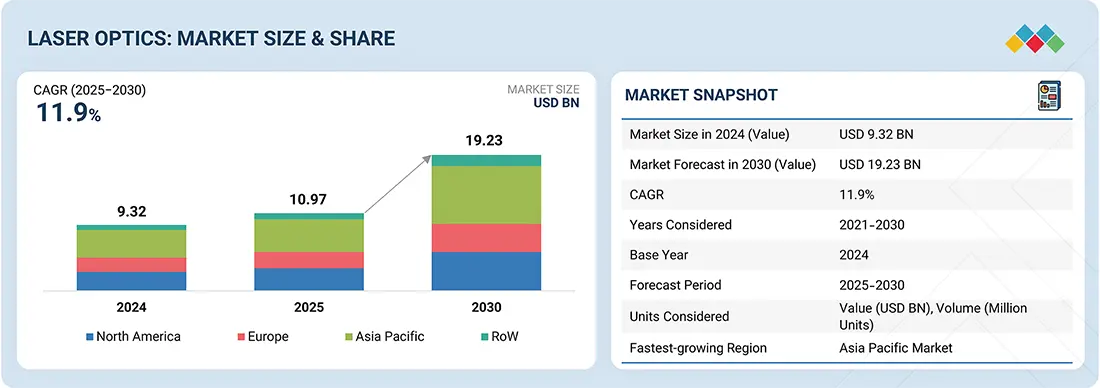
According to Marketsandmarkets, the laser optics market size is projected to reach USD 19.23 billion by 2030 from USD 10.97 billion in 2025, at a CAGR of 11.9% during the forecast period. The market experiences positive impacts from key segments, including industrial manufacturing with laser cutting and welding, medical applications such as surgery and dermatology, defense, telecommunications, and semiconductor manufacturing. Government agencies play a substantial role. The market’s adoption and innovation processes are directly impacted by their investments in defense laser systems alongside healthcare regulations and standardization efforts from organizations such as the National Institute of Standards and Technology (NIST). The acceleration of advanced laser technology deployment across various sectors occurs through government financial support for research and development alongside automation initiatives.
MARKET SNAPSHOT TABLE
| REPORT METRIC | DETAILS |
|---|---|
| Market Size in 2025 (Value) | USD 10.97 Billion |
| Market Forecast in 2030 (Value) | USD 19.23 Billion |
| Growth Rate | CAGR of 11.9% from 2025–2030 |
| Years Considered | 2021–2030 |
| Base Year | 2024 |
| Forecast Period | 2025–2030 |
| Units Considered | Value (USD Billion), Volume (Million Units) |
| Report Coverage | Revenue forecast, company ranking, competitive landscape, growth |
| Top Companies |
|
| Growth Driver |
|
| Segments Covered |
|
| Regions Covered | North America, Asia Pacific, Europe, and RoW |
Market Size & Forecast
KEY TAKEAWAYS
-
BY COMPONENTSOptical modulators held the largest share, as they control laser beam properties like amplitude, phase, frequency, and polarization, enabling high-speed communication and precision instrumentation.
-
BY APPLICATIONThe laser processing segment led the market in 2024, driven by its superior precision, quality, and reliability in applications such as cutting, micro-processing, and surface treatments across automotive, aerospace, and tooling industries.
-
BY END USER INDUSTRYThe telecommunication segment is expected to dominate, driven by growing demand for high-speed data, 5G rollout, and the critical role of lasers in reliable, long-distance fiber-optic communication.
-
BY REGIONAsia Pacific held the largest share of the laser optics market in 2024. Asia Pacific presents significant opportunities for the growth of the laser optics market, driven by industrialization, technological advancements, expanding end-user industries, government support, rising investments, and emerging markets.
-
COMPETITIVE LANDSCAPEMajor vendors in the laser optics market include Coherent Corp. (US), TRUMPF (Germany), Han’s Laser Technology Industry Group Co., Ltd (China), IPG Photonics Corporation (US), JENOPTIK AG (Germany), Edmund Optics Inc. (US), Laser Components (Germany), Sumitomo Electric Industries, Ltd. (Japan), Shanghai Optics (US), and Lumentum Operations LLC (US). Product launches and enhancements, partnerships, and expansions were the key strategies adopted by the players to enhance their product portfolios, increase their market share, and expand their presence in the laser optics market.
The major driver of the laser optics market share is the rising demand for high-precision optics in applications such as semiconductor manufacturing, healthcare, and defense. Increasing adoption of lasers in medical procedures, communication, and industrial cutting and welding is further fueling market growth. Additionally, advancements in photonics and the expansion of 5G and optical communication networks are boosting the need for laser optics.
Source: Secondary Research, Interviews with Experts, MarketsandMarkets Analysis
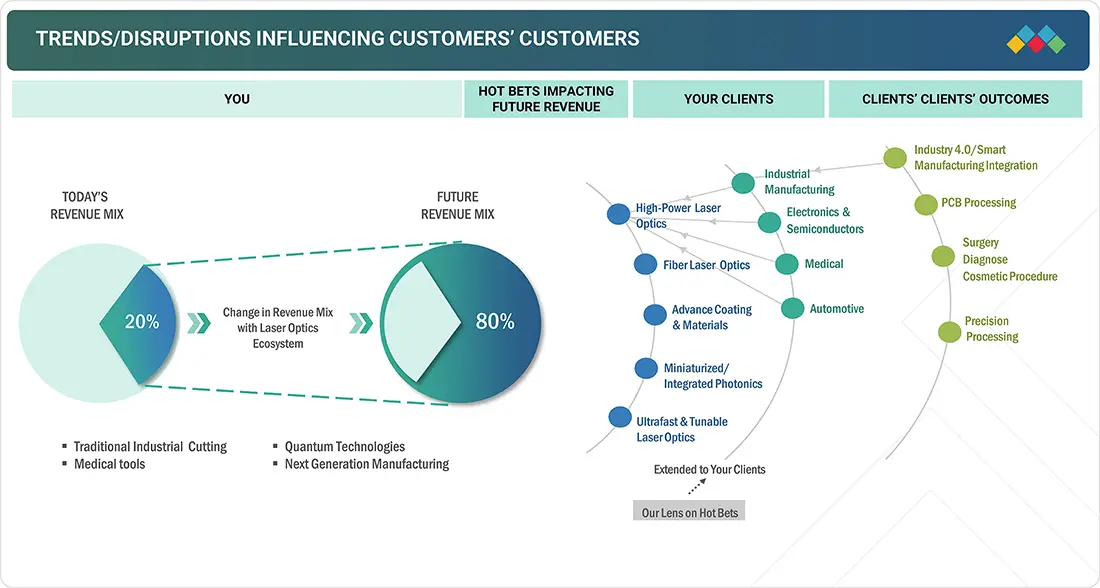
TRENDS & DISRUPTIONS IMPACTING CUSTOMERS' CUSTOMERS
This figure highlights the revenue shift in the laser optics ecosystem from traditional applications like industrial cutting and medical tools to new sources such as quantum technologies and next-generation manufacturing. Emerging opportunities in high-power optics, fiber optics, advanced coatings, and ultrafast tunable lasers are driving growth. These advancements enable end-user industries like electronics, medical, automotive, and precision manufacturing to expand into high-value applications such as PCB processing, cosmetic procedures, and Industry 4.0 integration.
Source: Secondary Research, Interviews with Experts, MarketsandMarkets Analysis
MARKET DYNAMICS
Level
-
Increasing demand for high-precision industrial manufacturing

-
Expansion of laser-based medical applications

Level
-
High initial investment and operational costs

Level
-
Expansion into emerging applications such as electric vehicle LiDAR, and 3D sensing

-
Growth in optical communication and data transmission

Level
-
Regulatory hurdle and safety compliance

Source: Secondary Research, Interviews with Experts, MarketsandMarkets Analysis
Driver: Increase in demand for high-precision industrial manufacturing
The growing demand for high-precision industrial manufacturing is driving the laser optics market trends, as these components ensure accuracy, efficiency, and reliability in modern production. Industries like aerospace, automotive, electronics, and medical devices increasingly use laser-based cutting, welding, engraving, and surface treatment to meet strict tolerances. With rising miniaturization and microfabrication needs, advanced optics that deliver consistent and focused laser output are becoming critical. Additionally, the push toward automation and Industry 4.0 is accelerating the adoption of high-performance optical components in smart factories, further fueling market growth.
Restraint: High initial investment and operational costs
High initial investments and operating costs pose major challenges to the growth of the laser optics market, as advanced systems require costly optics, laser sources, cooling, and control electronics. Integration into production processes is often difficult for SMEs, with additional customization further rising expenses. Ongoing maintenance, specialized technicians, controlled environments, and high energy consumption add to operational costs. Moreover, staff training is essential to avoid downtime or errors, creating significant barriers for widespread adoption despite the advantages of precision and efficiency.
Opportunity: Growth in optical communication and data transmission
The surge in optical communication and data transfer presents a key opportunity for the laser optics market, driven by rising demand for high-speed internet, cloud computing, and data center expansion. Optical communication systems rely on advanced laser optics to ensure long-distance, high-capacity data transmission with minimal loss. The rollout of 5G, IoT proliferation, and telecom investments in optical networking are further boosting demand. Moreover, emerging technologies like quantum communication and photonic data processing are opening new avenues for innovation, positioning laser optics as a critical enabler of future communication infrastructure.
Challenge: Regulatory hurdles and safety compliance
The laser optics market faces challenges from rising regulatory barriers and strict safety compliance, as industries like healthcare, defense, and telecommunications adopt high-power laser technologies. Governments impose stringent standards to address risks such as eye damage, skin exposure, and fire hazards, requiring manufacturers to meet complex international regulations like FDA guidelines. Compliance demands extensive testing, certification, and design adjustments, increasing costs and delaying product launches. While innovation opportunities remain strong, balancing regulatory requirements with technological advancement is essential for sustainable market growth.
Laser Optics Market: COMMERCIAL USE CASES ACROSS INDUSTRIES
| COMPANY | USE CASE DESCRIPTION | BENEFITS |
|---|---|---|
 |
Laser optics for automotive manufacturing and metal 3D printing | Faster production speeds| Enhanced design flexibility| Reduced material waste |
 |
Medical lasers for ophthalmology, dermatology, and surgical procedures | High precision| Minimal tissue damage| Faster recovery times |
Logos and trademarks shown above are the property of their respective owners. Their use here is for informational and illustrative purposes only.
MARKET ECOSYSTEM
The laser optics ecosystem consists of material providers, component manufacturers, and end users working in close coordination. Material suppliers deliver high-quality substrates essential for precision optics, while component manufacturers transform these materials into advanced laser devices. End users in industries like automotive, electronics, and aerospace drive demand and innovation across the supply chain. This collaborative structure ensures continuous technological advancement and responsiveness to evolving industrial needs.
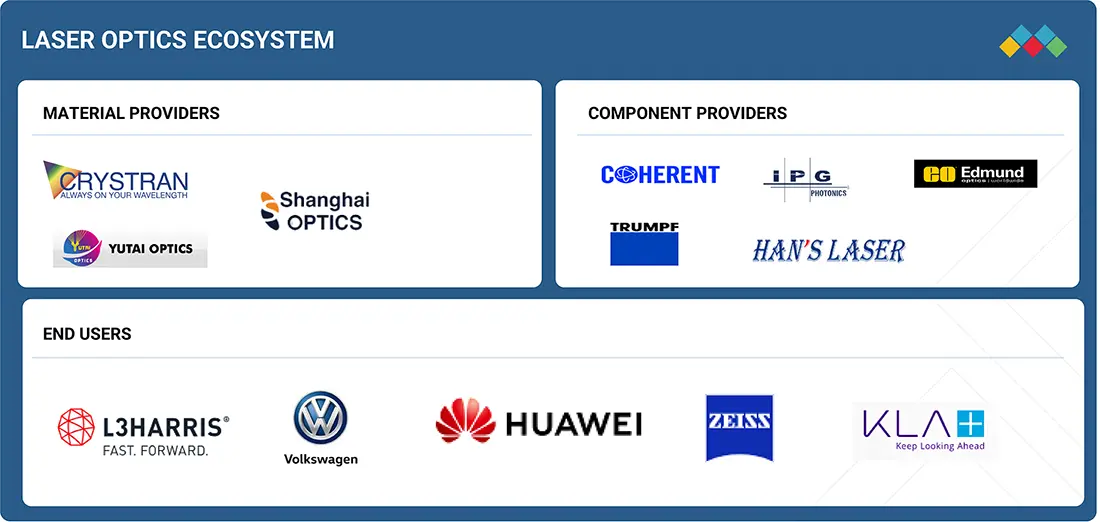
Logos and trademarks shown above are the property of their respective owners. Their use here is for informational and illustrative purposes only.
MARKET SEGMENTS
Source: Secondary Research, Interviews with Experts, MarketsandMarkets Analysis
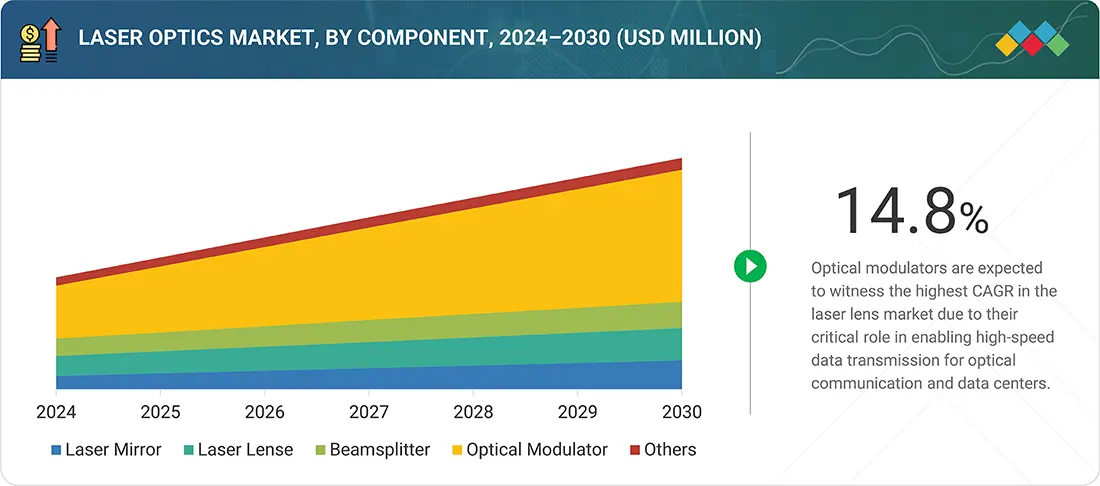
Laser Optics Market, By Component
The market for optical modulators accounted for a larger market share. Optical modulators play a crucial role in laser optics by controlling the properties of laser beams, such as amplitude, phase, frequency, or polarization, enabling their application in high-speed communication and precision instrumentation. These devices function by modulating the intensity or phase of light through external stimuli, typically electrical or acoustic signals. Common types include electro-optic modulators (EOMs), acousto-optic modulators (AOMs), and magneto-optic modulators, each exploiting different physical phenomena to achieve modulation.
Laser Optics Market, By Application
The laser processing segment accounted for a larger market share in 2024.Laser processing involves using lasers for applications such as materials processing, micro-processing, and advanced processing. Laser technology provides higher quality, reliability, and precision compared to conventional mechanical methods. Laser cutting is considered better than mechanical cutting as it gives better and more accurate cuts, even in tight dimensions. Laser surface treatment techniques, such as laser cleaning, laser peening, laser cladding, and laser surface alloying, are used in automotive, aerospace, tooling, and mold-making industries for improving surface properties such as hardness, wear resistance, and corrosion resistance.
Laser Optics Market, By End User Industry
The telecommunication segment is projected to lead the market during the forecast period. The telecommunication sector is witnessing rapid expansion in the adoption of laser optics, propelled by the surge in demand for high-speed data transmission and the rollout of 5G and optical networks. Lasers play a pivotal role in fiber-optic communication, enabling the transmission of vast amounts of data over long distances with minimal loss and high reliability. The integration of advanced laser technology is essential for supporting the ever-increasing bandwidth requirements of cloud computing, video streaming, and IoT connectivity.
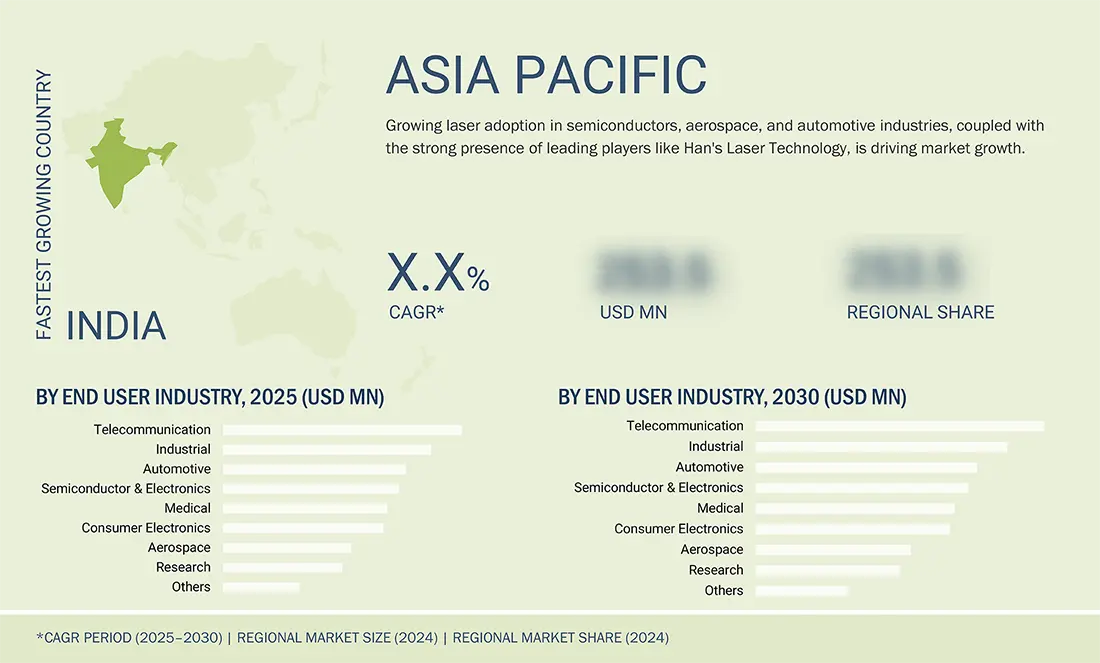
REGION
Asia Pacific to be the fastest-growing region in the global laser optics market during the forecast period
Asia Pacific held the largest share of the laser optics industry in 2024. Asia Pacific presents significant opportunities for the growth of the laser optics market, driven by industrialization, technological advancements, expanding end-user industries, government support, rising investments, and emerging markets. The region is home to leading laser optics manufacturers, research institutions, and academic centers, driving technological advancements in laser technology, photonics, and related fields.
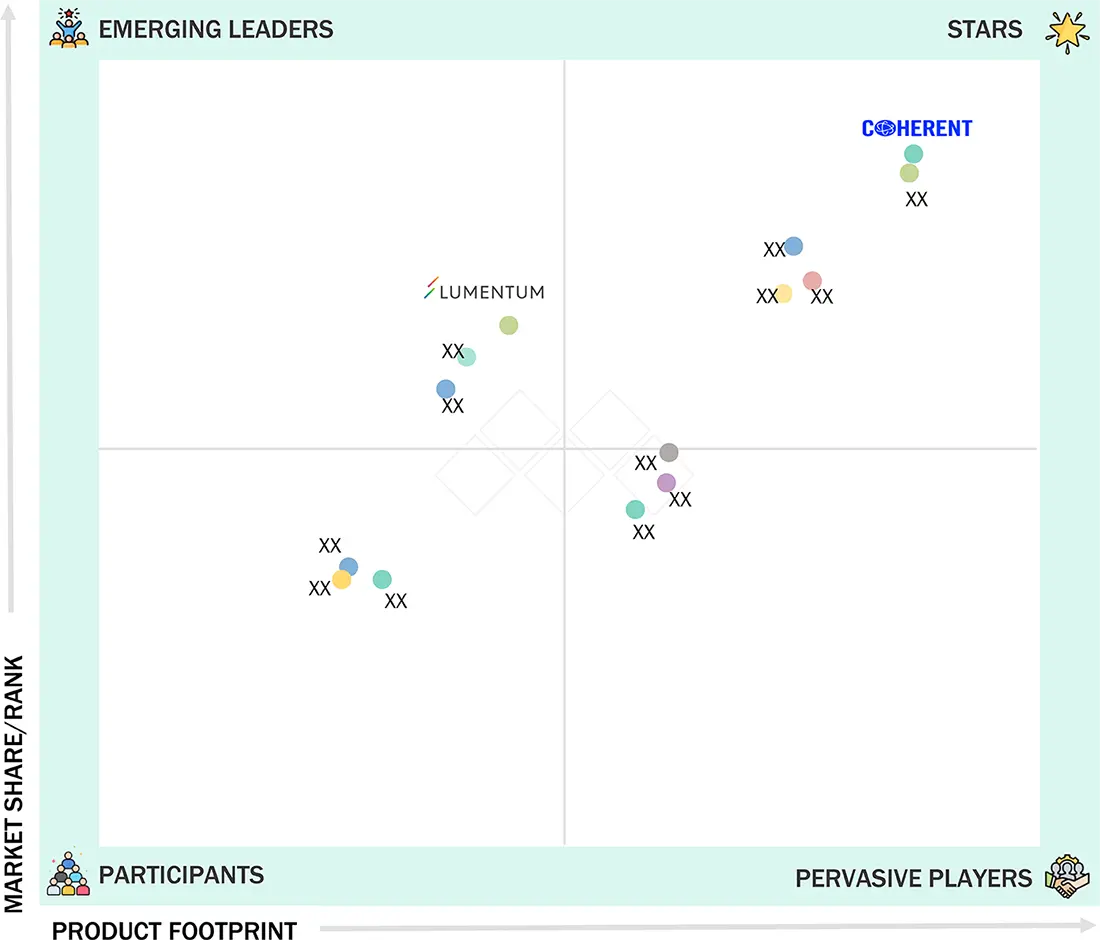
Laser Optics Market: COMPANY EVALUATION MATRIX
Stars are the leading market players in new developments, such as product launches, innovative technologies, and the adoption of growth strategies. These players have a broad portfolio, innovative product offerings, and a global presence. They have well-established channels throughout the value chain. Coherent Corp. (US) comes under this category. Emerging Leaders demonstrate more substantial product innovations than their competitors. Companies are investing more in R&D to launch several products in the market. A few players have a unique portfolio, while some have heavily invested in R&D or recently launched several products or innovative products. Lumentum Operations LLC. (US) comes under this category.
Source: Secondary Research, Interviews with Experts, MarketsandMarkets Analysis
KEY MARKET PLAYERS
WHAT IS IN IT FOR YOU: Laser Optics Market REPORT CONTENT GUIDE
DELIVERED CUSTOMIZATIONS
We have successfully delivered the following deep-dive customizations:
| CLIENT REQUEST | CUSTOMIZATION DELIVERED | VALUE ADDS |
|---|---|---|
| Laser System Manufacturer | Competitive profiling of optical component providers (lenses, mirrors, beam delivery systems),Market landscape by application (cutting, welding, medical, lithography), Cost-performance benchmarking of suppliers | Identify best-fit suppliers to reduce procurement risks, detect pricing trends and technology gaps, and highlight differentiation strategies for premium optics |
RECENT DEVELOPMENTS
- June 2025 : At the Laser World of Photonics (LWoP) 2025 in Munich, Han’s Laser unveiled over 40 advanced products, including the full series of the new “Han’s Handheld Welding Family.” These innovations span two main zones: laser devices/components and integrated laser equipment/solutions, demonstrating breakthroughs in application fields and smart manufacturing.
- June 2025 : IPG released a new line of high-power lasers built on its rack-integrated (RI) platform. These lasers offer significant benefits for manufacturers, including 60% less floor space usage, simplified integration, enhanced reliability, and improved operational efficiency. The RI platform uses next-generation pump diodes, enabling higher power density and lower total cost of ownership. The architecture also allows for higher operating temperatures and safer use in humid environments.
- May 2025 : JENOPTIK AG introduced the Modular Beam Splitting System (MBSS), designed for efficient and high-precision laser processing of solar cells. The MBSS integrates micro-optical and optical components into a ready-to-install, process-stable solution, enabling parallel laser structuring with high throughput and uniform quality.
- January 2024 : Coherent Corp. introduced the OBIS 640 XT, a red laser module that matches the high output power, low noise, beam quality, and compact size of its existing portfolio of blue and green laser modules, which is a complete set. It also enables the high performance of SRM systems.
- October 2023 : TRUMPF designed the TruMatic 5000 laser machine for fully automated laser-cutting, punching, and forming capabilities. The new SheetMaster enables a fully automated flow of materials within the manufacturing cell, from loading and unloading the machine to removing finished parts.
Table of Contents
 Exclusive indicates content/data unique to MarketsandMarkets and not available with any competitors.
Methodology
The research process for this study included systematic gathering, recording, and analysis of data about customers and companies operating in the laser optics market. This process involved the extensive use of secondary sources, directories, and databases (Factiva and OneSource) to identify and collect valuable information for the comprehensive, technical, market-oriented, and commercial study of the laser optics market. In-depth interviews were conducted with primary respondents, including experts from core and related industries and preferred manufacturers, to obtain and verify critical qualitative and quantitative information and assess growth prospects. Key players in the laser optics market were identified through secondary research, and their market rankings were determined through primary and secondary research. This research included studying annual reports of top players and interviewing key industry experts such as CEOs, directors, and marketing executives.
Secondary Research
Various secondary sources have been referred to in the secondary research process for identifying and collecting information pertinent to this study. The secondary sources include annual reports, press releases, and investor presentations of companies; white papers, certified publications, and articles by recognized authors; directories; and databases. Secondary research has been mainly carried out to obtain key information about the supply chain of the laser optics industry, the value chain of the market, the total pool of the key players, market classification, and segmentation according to the industry trends to the bottom-most level, geographic markets, and key developments from both market- and technology-oriented perspectives.
Primary Research
In the primary research process, various sources from the supply and demand sides have been interviewed to obtain qualitative and quantitative information for this report. Primary sources from the supply side included industry experts such as CEOs, VPs, marketing directors, technology and innovation directors, and key executives from major companies and organizations operating in the laser optics market. After going through the entire market engineering (which includes calculations for market statistics, market breakdown, market size estimations, market forecasting, and data triangulation), extensive primary research has been conducted to gather information and verify and validate the obtained critical numbers. Primary research has been conducted to identify segmentation types, industry trends, key players, competitive landscape, and key market dynamics such as drivers, restraints, opportunities, and challenges, along with the key strategies adopted by players operating in the market.

Note: The three tiers of the companies have been defined based on their total/segmental revenue as of 2024: Tier 1 = more than USD 1 billion, Tier 2 = USD 500 million to USD 1 billion, and Tier 3 = less than USD 500 million. Others include sales, marketing, and product managers.
To know about the assumptions considered for the study, download the pdf brochure
Market Size Estimation
In the complete market engineering process, top-down and bottom-up approaches and several data triangulation methods have been used to estimate and forecast the size of the market and its segments and subsegments listed in the report. Extensive qualitative and quantitative analyses have been carried out on the complete market engineering process to list the key information/insights about the laser optics market.
The key players in the market have been identified through secondary research, and their rankings in the respective regions have been determined through primary and secondary research. This entire procedure involved the study of the annual and financial reports of top players and interviews with industry experts such as chief executive officers, vice presidents, directors, and marketing executives for quantitative and qualitative key insights. All percentage shares, splits, and breakdowns have been determined using secondary sources and verified through primary sources. All parameters that affect the markets covered in this research study have been accounted for, viewed in extensive detail, verified through primary research, and analyzed to obtain the final quantitative and qualitative data. This data has been consolidated and enhanced with detailed inputs and analysis from MarketsandMarkets and presented in this report.
Laser Optics Market : Top-Down and Bottom-Up Approach

Data Triangulation
After arriving at the overall market size from the above estimation process, the total market has been split into several segments and subsegments. Data triangulation and market breakdown procedures have been employed to complete the overall market engineering process and arrive at the exact statistics for all the segments and subsegments, wherever applicable. The data has been triangulated by studying various factors and trends from both the demand and supply sides. The market has also been validated using both top-down and bottom-up approaches.
Market Definition
The laser optics market refers to the global industry focused on the design, manufacturing, and supply of optical components and assemblies specifically used in laser systems. These components—including lenses, mirrors, windows, filters, beam splitters, polarization optics, and optical modules—are engineered to manipulate, direct, focus, or modify laser beams across a wide range of wavelengths and power levels. Laser optics are essential in ensuring beam quality, precision, and system efficiency in applications spanning industrial manufacturing, telecommunications, medical devices, aerospace, defense, automotive, research, and consumer electronics. The market encompasses both standard and custom-built optical solutions designed to meet the increasingly complex demands of high-performance laser systems. As lasers continue to penetrate emerging industries and technologies—from LiDAR and 3D printing to quantum computing and biomedical imaging, the demand for advanced, high-durability, and wavelength-specific optics is growing rapidly. This market includes component manufacturers, system integrators, and OEMs that deliver optics for continuous wave, pulses, and ultrafast laser technologies globally.
Key Stakeholders
- Government bodies, venture capitalists, and private equity firms
- Laser technology manufacturers
- Laser technology distributors
- Laser technology industry associations
- Professional service/solution providers
- Research institutions and organizations
- Standards organizations and regulatory authorities related to the laser technology market
- System integrators
- Technology consultants
Report Objectives
- To define, describe, and forecast the laser optics market in terms of value based on components, application, end user industry, and region
- To describe and forecast the market, in terms of value, by region—North America, Europe, Asia Pacific, and RoW
- To provide detailed information regarding factors (drivers, restraints, opportunities, and challenges) influencing market growth
- To provide a detailed overview of the process flow of the laser optics market
- To analyze supply chain, market/ecosystem map, trend/disruptions impacting customer business, technology analysis, Porter's five force analysis, trade analysis, case study analysis, patent analysis, key conferences & events, and regulations related to the laser optics market
- To analyze opportunities for stakeholders in the laser optics market by identifying the high-growth segments
Key Questions Addressed by the Report
What is the current size of the Laser Optics Market?
The global Laser Optics Market is estimated at USD 10.97 billion in 2025 and is projected to reach USD 19.23 billion by 2030.
What is the expected CAGR of the Laser Optics Market during 2025–2030?
The market is expected to grow at a CAGR of 11.9% from 2025 to 2030, driven by increasing adoption of laser technologies across industrial, medical, telecom, and defense sectors.
What are the major growth drivers of the Laser Optics Market?
Key growth drivers include rising demand for high-precision industrial manufacturing, expansion of laser-based medical applications, growth of optical communication networks, and increasing automation under Industry 4.0 initiatives.
Which component segment holds the largest share of the Laser Optics Market?
The Optical Modulators segment holds the largest market share because of its critical role in controlling laser beam properties such as amplitude, phase, frequency, and polarization in communication and precision instrumentation systems.
Which application segment dominates the Laser Optics Market?
Laser Processing accounted for the largest market share due to its widespread use in cutting, welding, micro-processing, cleaning, cladding, and surface treatment applications across automotive and aerospace industries.
Which end-user industry is expected to lead the Laser Optics Market?
The Telecommunication industry is projected to dominate the market owing to growing demand for high-speed data transmission, fiber-optic networks, cloud computing infrastructure, and 5G deployment.
Which region is expected to grow the fastest in the Laser Optics Market?
Asia Pacific is projected to be the fastest-growing region due to rapid industrialization, strong electronics manufacturing ecosystems, government support, and increasing investments in photonics and laser technologies.
Who are the leading companies operating in the Laser Optics Market?
Major players include Coherent Corp., TRUMPF, IPG Photonics Corporation, JENOPTIK AG, and Lumentum Operations LLC.
What are the key trends shaping the Laser Optics Market?
Major trends include adoption of laser optics in quantum technologies, advanced manufacturing, EV LiDAR systems, ultrafast lasers, high-power fiber optics, semiconductor manufacturing, and next-generation optical communication networks.
What opportunities and challenges exist in the Laser Optics Market?
Key opportunities include growth in optical communication, data centers, 5G infrastructure, EV LiDAR, and 3D sensing applications. Challenges include high initial investment costs, operational expenses, regulatory compliance requirements, and laser safety
Need a Tailored Report?
Customize this report to your needs
Get 10% FREE Customization
Customize This ReportPersonalize This Research
- Triangulate with your Own Data
- Get Data as per your Format and Definition
- Gain a Deeper Dive on a Specific Application, Geography, Customer or Competitor
- Any level of Personalization
Let Us Help You
- What are the Known and Unknown Adjacencies Impacting the Laser Optics Market
- What will your New Revenue Sources be?
- Who will be your Top Customer; what will make them switch?
- Defend your Market Share or Win Competitors
- Get a Scorecard for Target Partners

Custom Market Research Services
We Will Customise The Research For You, In Case The Report Listed Above Does Not Meet With Your Requirements
Get 10% Free CustomisationTESTIMONIALS

Tetsuya Ohhira
Business Development Manager-Technology Business
Nikon Corporation,
Leading Japanese MNC specializing in optics and imaging productswww.nikon.com
MarketsandMarkets™ response
is quick. Their attitude is flexible and positive. Analyst Insights are globally considered and
significant. Client Services quickly respond to our inquiry and demand. Their wide range of global
surveys help us make our strategic plan.
We hope Knowledge Store will be easier to search
for a report.
VP - Marketing & Business Development
Leading Provider of Process Control Solutions
We engaged with MarketsandMarkets on a study to perform an analysis and recommend a Go-To-Market strategy for metrology and process control in the semiconductor market. The study was tailored to our targets and needs with well-defined milestones. Our overall experience with the MarketsandMarkets team was very good throughout the project in all aspects including the analysis methodologies used, the quality and depth of primary and secondary data sets, the professionalism and flexibility of the team and the ability to meet the target schedule and milestones. We want to thank MarketsandMarkets team for a job well done.
Growth opportunities and latent adjacency in Laser Optics Market


Alexander
Apr, 2026
Does the report identify high-growth customer industries that I should target to increase revenue?.
Christopher
Apr, 2026
What actionable insights does the report provide to outperform competitors and gain market share?.