
LNG Terminals Market

LNG Terminals Market by Technology (Liquefaction, Regasification), Function (Import, Export, Bifunctional), Terminal Type (Onshore, Floating), Capacity (Small-scale, Medium-scale, Large-scale Terminals), and Region - Global Forecast to 2030


OVERVIEW
Source: Secondary Research, Interviews with Experts, MarketsandMarkets Analysis
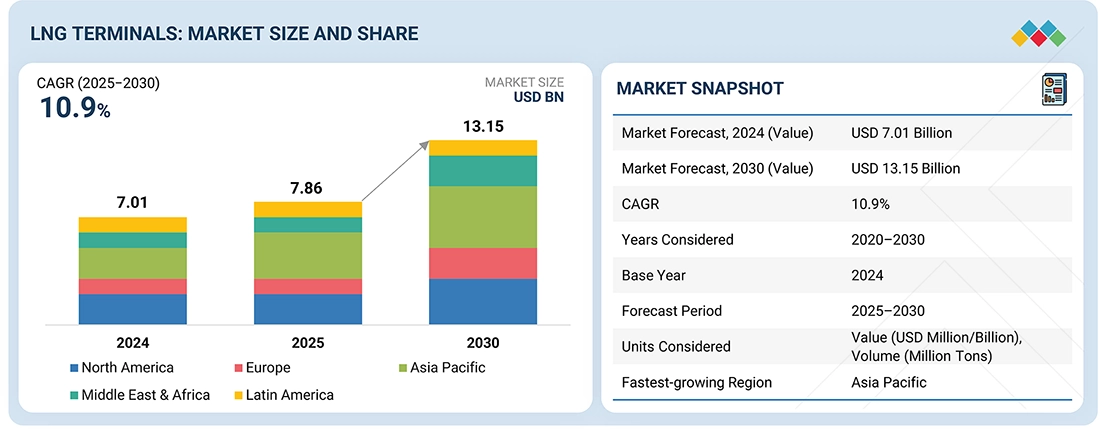
The global LNG terminals market is projected to grow from USD 7.01 billion in 2024 to USD 13.15 billion by 2030, at a CAGR of 10.9%, driven by the expansion of LNG trade and the global shift toward cleaner fuel alternatives. Increasing emphasis on environmental sustainability and energy security prompts investment in modern, efficient terminal infrastructure.
LNG Terminals Market Size and Forecast:
- Market Size Value in 2024: USD 7.01 Billion
- Market Size Value in 2025: USD 7.86 Billion
- Revenue Forecast in 2030: USD 13.15 Billion
- Growth Rate: CAGR of 10.9% from 2025 to 2030
- Data available from 2020 to 2030
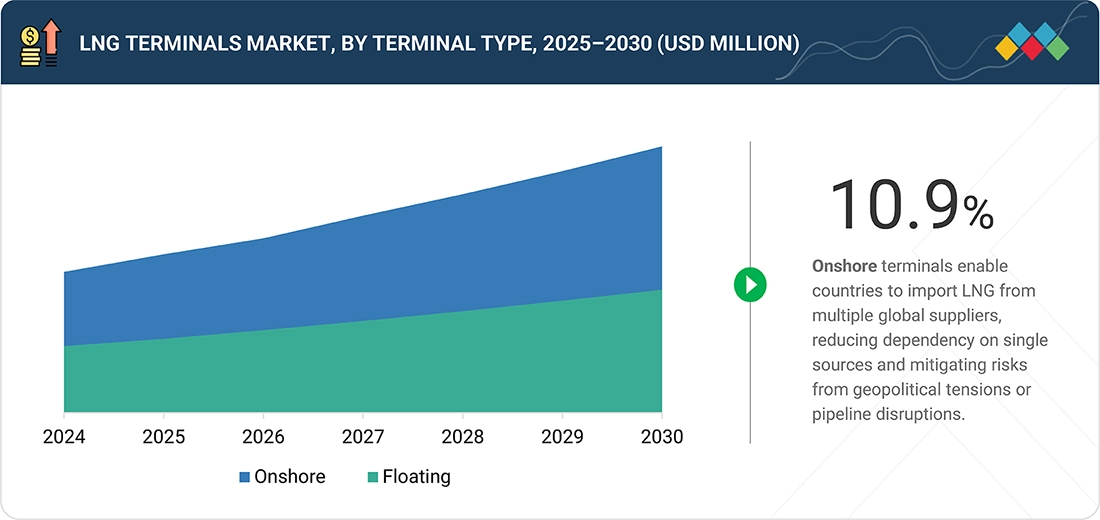
- The onshore terminal segment holds the largest market share due to its high storage capacity, established infrastructure, and suitability for large-scale LNG operations.
LNG Terminals Market Trends and Insights
- Market Growth: LNG Terminals Market growth is driven by the expansion of global LNG trade, increasing emphasis on energy security, and the transition toward cleaner fuel alternatives across power generation and industrial sectors.
- Growing Trends: Adoption of modular terminal designs, electrified systems, digital monitoring technologies, and floating LNG infrastructure is increasing to improve operational efficiency and deployment flexibility.
- Growth Opportunities: Rising investments in regasification facilities, expansion of LNG import infrastructure in emerging economies, and the integration of hydrogen and carbon capture technologies are creating significant LNG Terminals market opportunities.
- Market Share Analysis: The onshore terminal segment holds the largest LNG Terminals market share due to its extensive infrastructure and long-term operational capabilities, while export terminals continue to attract major investments supported by long-term LNG supply contracts.
KEY TAKEAWAYS
-
BY FUNCTIONThe LNG terminals market is driven by advancements in import, export, and bifunctional terminals. The LNG terminals market is driven by advancements in import, export, and bi-functional facilities. Export terminals, being capital-intensive, depend on assured demand through long-term LNG contracts. When importers sign long-term LNG purchase agreements, they reduce risk for exporters, making Final Investment Decisions (FIDs).
-
BY TERMINAL TYPELNG terminals are critical infrastructure for the global natural gas supply chain, enabling the import, export, storage, and processing of LNG. These terminals are broadly categorized by their location and function: onshore and floating, each serving either liquefaction (export) or regasification (import) purposes. Onshore terminals are set to witness greater demand.
-
BY CAPACITYThe capacity of an LNG terminal refers to the maximum amount of liquefied natural gas it can handle—typically measured in million tons. Based on capacity, the LNG terminals market is segmented into small-scale (<1 MTPA), medium-scale (1–5 MTPA), and large-scale (>5 MTPA). Small-scale LNG terminals, with capacities of less than 1 MTPA, are tailored for localized or regional distribution, often serving remote areas, island nations, or niche markets where large infrastructure is not viable. Large-scale LNG terminals are significant as they boost energy security by diversifying supply sources and managing demand. They enhance national resilience and enable participation in global LNG trade for improved supply security and economic stability.
-
BY TECHNOLOGYLNG terminals have two main technologies: liquefaction, which converts natural gas into LNG for export, and regasification terminals, which revert LNG to its gaseous form for distribution and consumption. Importing LNG from multiple global suppliers enhances energy security by reducing reliance on a single source and minimizing geopolitical risks. Regasification infrastructure also allows for flexibility in responding to market changes and demand shifts.
-
BY REGIONNorth America and Asia Pacific are the dominant markets due to strong industrial bases and high adoption of automation technologies. Asia Pacific is estimated the largest region, driven by rapid industrialization, expansion of refineries, and power sector growth in countries such as China and India.
-
COMPETITIVE LANDSCAPEMajor market players in the LNG terminals market have adopted both organic and inorganic growth strategies, including partnerships, joint ventures, and investments. For example, Bechtel Corporation (US), and TotalEnergies SE (France) have entered into various agreements and strategic collaborations to expand LNG infrastructure, enhance storage and regasification capacity, and meet the growing global demand for cleaner energy sources across power generation and industrial applications.
The transition from coal and oil to natural gas across power generation and industrial sectors is a major driver for LNG terminal development. Growing environmental concerns, tightening air quality regulations, and the introduction of carbon pricing mechanisms are prompting industries and utilities to adopt cleaner energy sources.
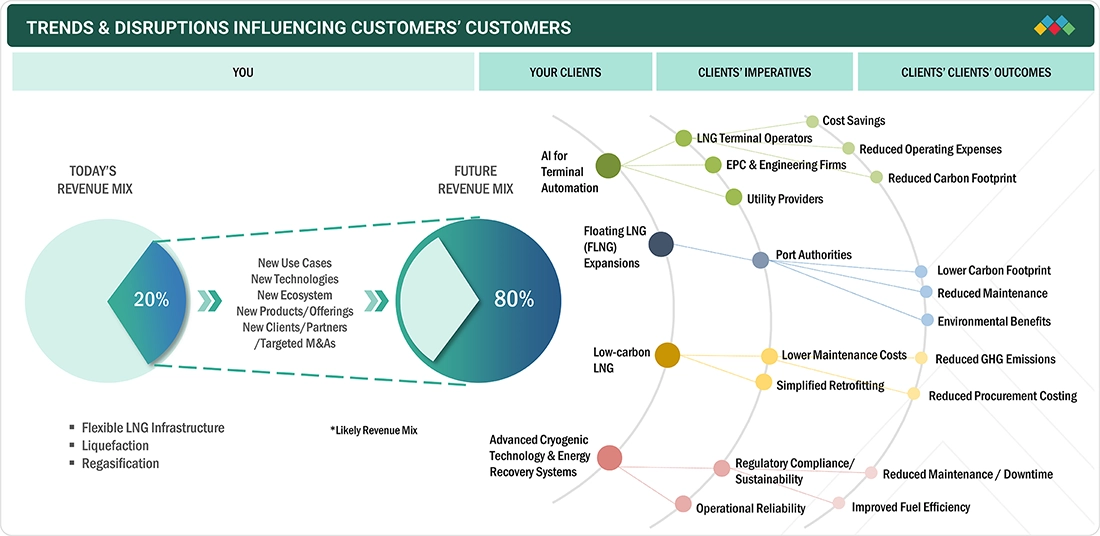
TRENDS & DISRUPTIONS IMPACTING CUSTOMERS' CUSTOMERS
The increasing emphasis on energy conservation and the strong government initiatives to reduce carbon emissions are expected to drive the LNG terminals market. Additionally, LNG terminal operators and their value chain partners must proactively adapt to digitalization, decarbonization, and changing regulatory landscapes to unlock new revenue streams and maintain competitiveness. The rise of small-scale and floating LNG terminals challenges traditional large onshore facilities by offering greater flexibility, faster deployment, and lower capital expenditure, making LNG more accessible to emerging markets. The LNG terminals market is undergoing a strategic transformation driven by a combination of technological advancements, policy shifts, and decarbonization efforts.
Source: Secondary Research, Interviews with Experts, MarketsandMarkets Analysis
MARKET DYNAMICS
Level
-
Mounting demand for low-emission energy amid rapid industrialization

-
Shifting preference from coal to cleaner alternative fuels

Level
-
Requirement for substantial financial resources and long payback period

-
Issues related to compliance with safety, environmental, and land use regulations

Level
-
Increasing reliance on natural gas to curb carbon footprint

-
Growing focus on diversifying energy sources and enhancing energy security

Level
-
Climate risks and high operational costs of FSRUs

-
Geopolitical instability impacting supply security

Source: Secondary Research, Interviews with Experts, MarketsandMarkets Analysis
Driver: Mounting demand for low-emission energy amid rapid industrialization
The global LNG market is experiencing robust growth, driven by rising energy demand due to population growth and rapid industrialization in developing economies. As nations increasingly seek alternatives to coal and oil, LNG is gaining prominence as a cleaner, reliable, and efficient energy source. Its role in supporting the transition toward lower-carbon energy systems is being reinforced by international climate agreements to reduce greenhouse gas emissions and mitigate climate change. In response, many governments are developing policies and regulatory frameworks that position LNG as central to national energy strategies. Significant investments are made in LNG terminal infrastructure, often supported by international partnerships to strengthen global supply chains. Financial incentives, tax exemptions, and regulatory advantages are offered to encourage industries to adopt LNG. Beyond power generation, LNG is also emerging as a cleaner fuel option for transportation and industrial processes, adding further momentum to its adoption. These diverse applications enhance LNG’s economic appeal and position it as a strategic pillar in long-term energy security and sustainability planning.
Restraint: Requirement for substantial financial resources and long payback period
The development of large LNG terminals requires immense amounts of capital and is, by far, the greatest barrier to growing the market. Liquefaction (export) and regasification (import) terminals consume immense resources. Compared to other countries, the capital costs of an LNG terminal are generally between USD 480 million and USD 2 billion and vary based on the size and complexity of the terminal, location, and the requests for supporting infrastructure. For example, nearly all LNG terminals in India were designed with a capacity of 5 million metric tonnes per annum (MMTPA) of LNG, and their construction costs were somewhere between USD 480 million (INR 4,000 crores) and USD 600 million (INR 5,000 crores). Not only are the capital requirements considerable, but the long development and commissioning periods, often 5 to 7 years, for large-scale projects further complicate the issue. Once operational, the assets usually have long payback periods before they become cashflow positive (7 to 15 years, based on the gas price, utilization rate, and demand in the market). In many instances, the biggest risk is under-utilization of the assets, especially in areas where gas demand is uncertain or lacks stability, infrastructure connectivity is often limited, or policies to support gas are inconsistent.
Opportunity: Increasing reliance on natural gas to curb carbon footprint
The LNG terminals market has recently made significant strides, primarily due to global interest in cleaner energy, rising demand for natural gas, and terminals that provide an easier and cost-effective alternative and flexible infrastructure. Improved technology has enhanced the efficiency and sustainability of LNG import and export terminals. One main technological breakthrough in the energy space is the development of floating storage regasification units (FSRUs) and floating liquefied natural gas (FLNG) terminals and vessels. These floating solutions reduce construction time and capital costs compared to an onshore terminal while providing additional mobility and flexibility. An example is how Excelerate Energy's FSRU in Bangladesh has ensured access to LNG. Another significant innovation has been in the prefabrication of terminal components that enable companies to manufacture the components for LNG terminals off-site using modular construction techniques, followed by the in-the-water assembly of the terminal or vessel. This leads to faster project delivery, enhanced quality of product, and less environmental footprint, which collectively impact the terminal operating life and benefit positively. The TotalEnergies Mozambique LNG project is considering using some modular units that will also consider the potential use of scalability and adaptability. Terminal operation monitoring has been enhanced through increased automation and digitalization, leading to significant growth in construction and operational environments.
Challenge: Climate risks and high operational costs of FSRUs
The floating storage regasification units (FSRUs) are the most commonly utilized types of floating import terminals. While FSRUs cost much less than building onshore LNG terminals, they have considerably higher operating costs. Typically, the costs for leasing an FSRU range from USD 80,000 to USD 120,000 per day or approximately USD 29 million to USD 44 million per year. After Russia invaded Ukraine in 2022, these costs increased considerably. A recent cancellation of an FSRU project in Bangladesh had a reported daily cost of USD 300,000 (BDT 33.8 million), translating to approximately USD 110 million (BDT 13.2 billion) annually. Wärtsilä, a maritime technology company, states that after six or seven years of operations, onshore LNG terminals will have a lower cost than FSRUs.
LNG Terminals Market: COMMERCIAL USE CASES ACROSS INDUSTRIES
| COMPANY | USE CASE DESCRIPTION | BENEFITS |
|---|---|---|
 |
The Yamal LNG project (16.5 MTPA) in the Arctic faced challenges such as sub-zero temperatures, unstable permafrost, and difficult logistics. Technip Energies used modular construction, Arctic-class vessels, and advanced ground stabilization to overcome these hurdles. | The project achieved zero safety incidents, adhered to strict environmental standards, and was delivered ahead of schedule. It set new benchmarks for Arctic LNG development and engineering excellence. |
 |
Petronet LNG expanded the Dahej Terminal from 5 to 17.5 MMTPA to meet India’s surging gas demand, addressing infrastructure bottlenecks and efficiency challenges. Upgrades included new storage tanks, a second jetty, and improved connectivity. | The expansion enhanced operational efficiency, safety, and supply reliability, supporting India’s clean energy goals and ensuring LNG import resilience in the growing natural gas market. |
Logos and trademarks shown above are the property of their respective owners. Their use here is for informational and illustrative purposes only.
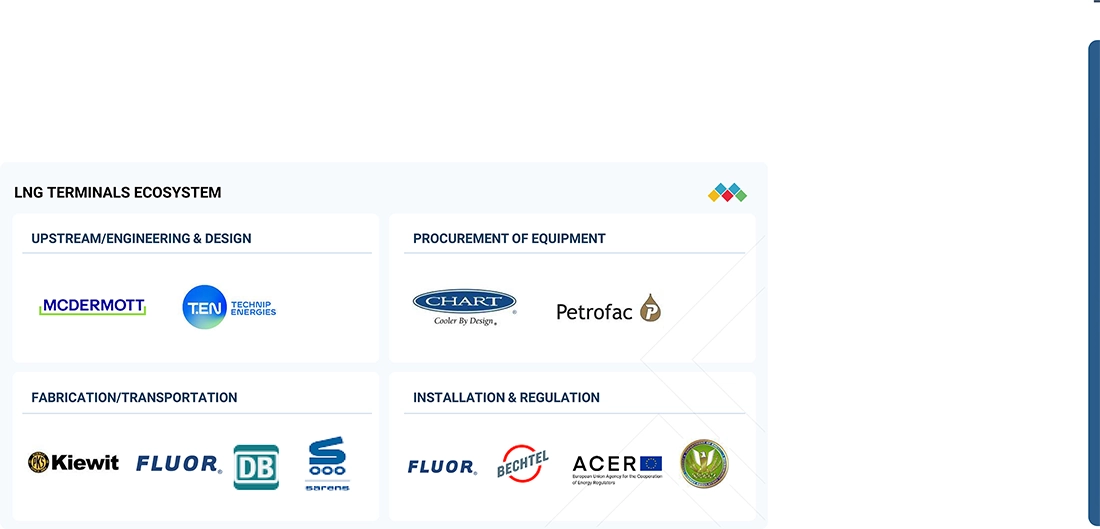
MARKET ECOSYSTEM
The LNG terminal ecosystem analysis shows the interconnections/adjacencies that affect the LNG terminals market by showcasing MnM coverage of the market under study. The section highlights the key industries and applications impacting the market under study. The LNG terminals ecosystem involves key players operating across different levels. Companies such as Technip Energies N.V., Bechtel Corporation, JGC Holdings Corporation, and Wison Group serve as leading engineering & design service providers. Major procurement service providers, such as Fluor Corporation, Sensus, HYUNDAI E&C, Petrofac Limited, McDermott, and Samsung Engineering Co., Ltd, provide sourcing, contracting, and supply of critical equipment, materials, and services required for terminal construction and operation.
Logos and trademarks shown above are the property of their respective owners. Their use here is for informational and illustrative purposes only.
MARKET SEGMENTS
Source: Secondary Research, Interviews with Experts, MarketsandMarkets Analysis
LNG Terminals Market, by Technology
LNG regasification terminals have become significant for nations seeking to strengthen their energy security and diversify their energy mix. By establishing the capability to import LNG from multiple global suppliers, countries can reduce reliance on a single source of natural gas, thereby minimizing vulnerability to geopolitical tensions, supply disruptions, or regional conflicts. Beyond risk mitigation, the flexibility offered by regasification infrastructure allows governments and utilities to respond dynamically to market fluctuations, seasonal demand shifts, and long-term strategic energy planning. This diversification not only ensures a stable and reliable energy supply for residential, industrial, and power-generation sectors but also enhances national resilience, supports economic stability, and reinforces a country’s standing in the global energy landscape.
LNG Terminals Market, by Capacity
Large-scale LNG terminals serve as strategic infrastructure for countries seeking to enhance energy security and diversify their supply sources. By enabling access to LNG from multiple international suppliers, these terminals reduce reliance on any single provider and mitigate vulnerabilities associated with geopolitical tensions, regional conflicts, or pipeline disruptions. Beyond risk reduction, the scale and flexibility of such terminals allow nations to manage seasonal demand fluctuations, respond to market dynamics, and ensure a continuous, reliable energy supply for power generation, industrial use, and domestic consumption. This capability not only strengthens national energy resilience but also positions countries to participate more actively in global LNG trade, leveraging strategic storage and import capacities to optimize supply security and economic stability.
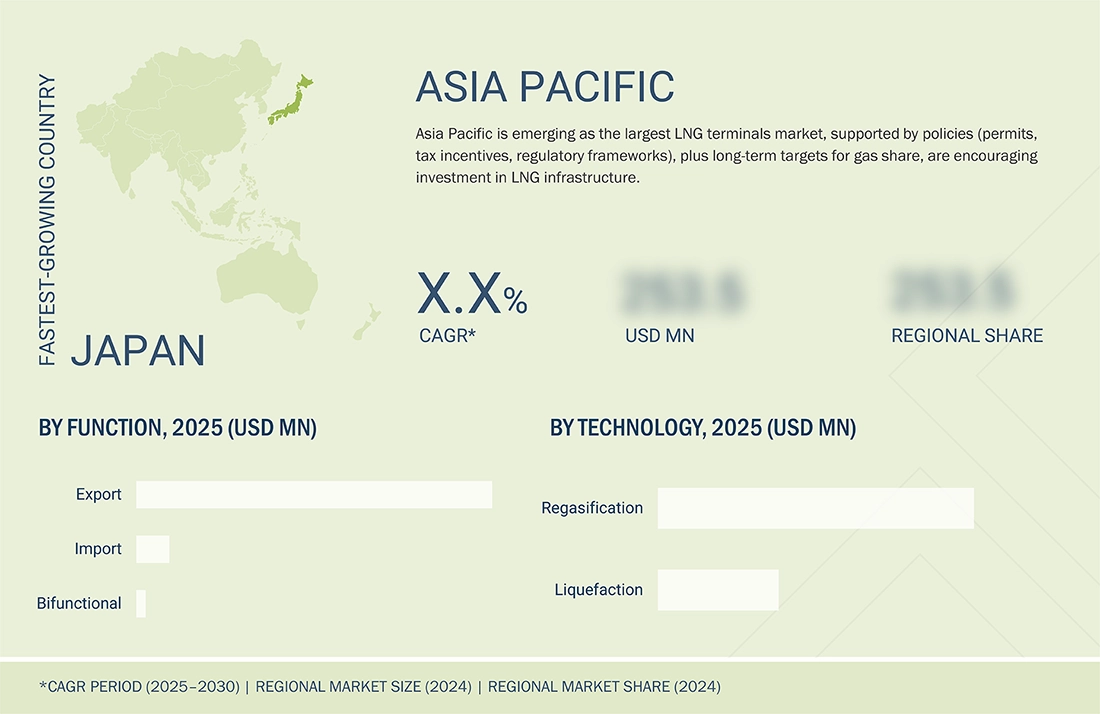
REGION
Asia Pacific to account for largest share of LNG terminals market
Asia Pacific is estimated to be the largest region of the global LNG terminals market, driven by rapidly growing energy demand, a strong push for cleaner fuel alternatives, and the strategic need to secure energy supplies through LNG imports. As of 2023, China, Japan, South Korea, and India collectively account for over 60% of the world’s LNG imports. Japan continues to be the leading LNG importer. At the same time, China has emerged as the largest LNG consumer, propelled by its aggressive coal-to-gas transition and efforts to decarbonize industrial sectors. The region is witnessing increased investment in both onshore and floating regasification terminals, especially in emerging Southeast Asian economies. Countries such as Vietnam, the Philippines, and Bangladesh are developing LNG infrastructure to address rising electricity demand and reduce reliance on coal-based power generation. This expansion is further supported by favorable government policies, growing participation from private sector players, and long-term agreements with LNG-exporting nations. These factors collectively foster sustained development of LNG terminals across Asia Pacific, reinforcing the region’s position as a critical driver of global LNG infrastructure growth and contributing to its broader energy security and sustainability goals.
LNG Terminals Market: COMPANY EVALUATION MATRIX
In the LNG terminals market matrix, Technip Energies (Star) leads with a strong market share and extensive project footprint, driven by its advanced engineering capabilities, integrated EPC solutions, and successful execution of large-scale onshore LNG facilities worldwide. McDermott (Emerging Leader) is gaining visibility with its innovative design and construction solutions, strengthening its position through technology-driven project delivery and strategic partnerships. While Technip Energies dominates through scale and a diverse portfolio, McDermott shows significant potential to move toward the leaders’ quadrant as global investments in LNG liquefaction and regasification infrastructure continue to rise.

Source: Secondary Research, Interviews with Experts, MarketsandMarkets Analysis
KEY MARKET PLAYERS
MARKET SCOPE
| REPORT METRIC | DETAILS |
|---|---|
| Market Size, 2024 (Value) | USD 7.01 Billion |
| Market Forecast, 2030 (Value) | USD 13.15 Billion |
| Growth Rate | CAGR of 10.9% from 2025 to 2030 |
| Years Considered | 2020–2030 |
| Base Year | 2024 |
| Forecast Period | 2025–2030 |
| Units Considered | Value (USD Million/Billion), Volume (Million Tons) |
| Report Coverage | Market forecast, company ranking, competitive landscape, growth factors, and trends |
| Segments Covered |
|
| Regions Covered | Europe, Asia Pacific, North America, South America, Middle East & Africa |
WHAT IS IN IT FOR YOU: LNG Terminals Market REPORT CONTENT GUIDE
DELIVERED CUSTOMIZATIONS
We have successfully delivered the following deep-dive customizations:
| CLIENT REQUEST | CUSTOMIZATION DELIVERED | VALUE ADDS |
|---|---|---|
| LNG Terminals by Technology Customization | Market estimation for technology segment for LNG terminals market | Division of the liquefaction segment into air-cooled, seawater-cooled, and hybrid technologies |
RECENT DEVELOPMENTS
- December 2024 : Woodside Energy executed a turnkey engineering, procurement, and construction (EPC) agreement with Bechtel Corporation to develop its Louisiana LNG terminal, previously referred to as Driftwood LNG. The agreement deal involves building a three-train facility with a combined capacity of 16.5 million tonnes per annum (Mtpa), part of an overall project licensed for up to 27.6 Mtpa. Bechtel would carry out work under a limited notice to proceed (LNTP), which included site preparation and procurement of essential materials and services.
- September 2024 : SAIPEM SpA entered into an EPC contract with Qatar LNG. In accordance with this contract, Saipem undertakes the engineering, procurement, fabrication, and installation of six offshore platforms. The work scope also entails laying approximately 100 kilometers of corrosion-resistant alloy rigid subsea pipelines (28-inch and 24-inch diameters), 100 kilometers of subsea composite cables, 150 kilometers of fiber-optic cables, and other subsea facilities.
- June 2024 : TotalEnergies inked an Engineering, Procurement, and Construction (EPC) agreement with Technip Energies for its Marsa LNG Terminal project. The agreement is for the complete scope of execution—from detailed engineering and equipment procurement to construction and commissioning—of a state-of-the-art LNG terminal for improving.
Table of Contents
 Exclusive indicates content/data unique to MarketsandMarkets and not available with any competitors.
Methodology
The study involved major activities in estimating the current size of the LNG terminals market. Exhaustive secondary research was done to collect information on the peer and parent markets. The next step was to validate these findings, assumptions, and sizing with industry experts across the value chain through primary research. The top-down and bottom-up approaches were employed to estimate the total market size. Thereafter, market breakdown and data triangulation techniques were used to estimate the market size of the segments and subsegments.
Secondary Research
This research study on the LNG terminal market involved the use of extensive secondary sources, directories, and databases, such as Hoover’s, Bloomberg, Factiva, IRENA, International Energy Agency, and Statista Industry Journal, to collect and identify valuable information for a technical, market-oriented, and commercial study of the market. The other secondary sources included annual reports, press releases, and investor presentations of companies; white papers; certified publications; and articles by recognized authors, manufacturer associations, trade directories, and databases.
Primary Research
The LNG market comprises several stakeholders, such as engineering and design providers, equipment procurement providers, and transportation and logistics providers in the supply chain. The rising demand for onshore and floating LNG terminal types characterizes the demand side of this market. The supply side is characterized by prominent players' increasing focus on securing contracts from industrial players. Various primary sources from the supply and demand sides of the market were interviewed to obtain qualitative and quantitative information. The following is the breakdown of primary respondents.
In the complete market engineering process, the top-down and bottom-up approaches and several data triangulation methods were extensively used to perform the market size estimations and forecasts for all segments and subsegments listed in this report. Extensive qualitative and quantitative analyses were conducted to complete the market engineering process and list key information/insights throughout the report.

Note: The tiers of the companies are defined based on their total revenues as of 2024. Tier 1: >
USD 1 billion, Tier 2: USD 500 million to USD 1 billion, and Tier 3: < USD 500 million. Others include
sales managers, engineers, and regional managers.
To know about the assumptions considered for the study, download the pdf brochure
Market Size Estimation
The top-down and bottom-up approaches were used to estimate and validate the total size of the LNG terminal market. These methods were also used extensively to estimate the size of various subsegments in the market. The research methodology used to estimate the market size includes the following.
LNG Terminals Market : Top-Down and Bottom-Up Approach

Data Triangulation
The total market was split into several segments and subsegments after arriving at the overall market size from the above estimation process. Data triangulation and market breakdown processes were employed to complete the overall market engineering process and arrive at the exact statistics for all the segments and subsegments, wherever applicable. The data was triangulated by studying various factors and trends from the demand and supply sides. In addition, the market size was validated using both the top-down and bottom-up approaches.
Market Definition
The LNG terminals market encompasses the global industry involved in planning, developing, constructing, operating, and commercializing liquefied natural gas (LNG) infrastructure used for import and export purposes. LNG terminals are critical components of the LNG supply chain, enabling the efficient transportation and distribution of natural gas by facilitating its liquefaction for shipment and regasification for end use. Export terminals convert natural gas into its liquid form for easier storage and transport, while import terminals revert LNG to its gaseous state for distribution into domestic pipelines and consumption markets.
Stakeholders
- LNG terminal operators
- Engineering, procurement, and construction (EPC) companies
- National and regional governments/regulators
- LNG suppliers/producers
- Shipping and logistics companies
- National oil & gas companies
- Consulting companies of oil & gas industry
- Oil & gas associations
- Government and research organizations
- State and national regulatory authorities
Report Objectives
- To define, describe, and forecast the LNG terminals market based on technology, terminal type, function, capacity, and region, in terms of value
- To define, describe, and forecast the market based on function, in terms of volume
- To forecast the market size across five key regions, namely, North America, Europe, Asia Pacific, the Middle East & Africa, and South America, in terms of value
- To provide detailed information about the key drivers, restraints, opportunities, and industry-specific challenges influencing the growth of the market
- To strategically analyze the LNG terminal market with respect to individual growth trends, prospects, and contributions of each segment to the market
- To provide information pertaining to the supply chain, trends/disruptions impacting customer business, and the regulatory landscape related to the market
- To strategically analyze the micromarkets with respect to individual growth trends, upcoming expansions, and their contributions to the overall market
- To analyze opportunities for stakeholders in the LNG terminal market and draw a competitive landscape for market players
- To benchmark players within the market using the company evaluation quadrant, which analyzes market players on various parameters within the broad categories of business and product strategies
- To strategically profile key players and comprehensively analyze their market ranking and core competencies
- To analyze competitive developments in the market, such as contracts and agreements
Available Customizations
MarketsandMarkets offers customizations according to the specific needs of the companies using the given market data.
The following customization options are available for the report:
Product Analysis
- Product matrix, which gives a detailed comparison of the product portfolio of each company
Geographic Analysis as per Feasibility
- Further breakdown of the LNG terminal market, by country
Company Information
- Detailed analysis and profiling of additional market players (up to five)
Key Questions Addressed by the Report
What was the size of the LNG terminals market in 2025?
The LNG terminals market was worth USD 7.86 billion in 2025.
What are the major drivers for the LNG terminals market?
Some major drivers for the LNG terminals market include shifting preference from coal to cleaner alternative fuels and increasing adoption of LNG in power generation, heating, and other industrial applications.
Which will be the biggest market for LNG terminals during the forecast period?
Asia Pacific is estimated to dominate the LNG terminals market during the forecast period.
Which will be the largest segment, by function, in the LNG terminals market during the forecast period?
The export segment is likely to account for the largest market share during the forecast period.
Which will be the fastest-growing segment, by technology, in the LNG terminals market during the forecast period?
The liquefaction segment is projected to register the highest CAGR during the forecast period.
Need a Tailored Report?
Customize this report to your needs
Get 10% FREE Customization
Customize This ReportPersonalize This Research
- Triangulate with your Own Data
- Get Data as per your Format and Definition
- Gain a Deeper Dive on a Specific Application, Geography, Customer or Competitor
- Any level of Personalization
Let Us Help You
- What are the Known and Unknown Adjacencies Impacting the LNG Terminals Market
- What will your New Revenue Sources be?
- Who will be your Top Customer; what will make them switch?
- Defend your Market Share or Win Competitors
- Get a Scorecard for Target Partners

Custom Market Research Services
We Will Customise The Research For You, In Case The Report Listed Above Does Not Meet With Your Requirements
Get 10% Free CustomisationTESTIMONIALS

Kimberly Murphy
GLOBAL MARKETING DIRECTOR
Bently Nevada,
Leading Condition Monitoring & Asset Protectionwww.bakerhughesds.com/bently-nevada

MarketsandMarkets™ showed consistent rigor for success and relentlessly worked with Bently Nevada stakeholders to positively impact go-to-market strategy. Their proactiveness and flexibility has been instrumental in achieving the objectives to grow our sales pipeline in key industrial markets.

DARRICK HUEBER
Business Development Leader
Nexus Controls LLC,
Leading Manufacturer of Automation System & Electrical Panelswww.bakerhughesds.com/nexus-controls

We partnered with MarketsandMarkets to expand our business further by tapping into new industrial segments. It was critical for us to gather crucial business insights about specific markets to achieve this goal. MarketsandMarkets engagement model and client services helped us provide those insights, it was really impressive and valuable for my business. The team was extremely flexible and helpful.

Mike Schoff
Global Industrial Commercial Strategy Leader
Nexus Controls LLC
Leading Manufacturer of Automation System & Electrical Panelswww.bakerhughesds.com/nexus-controls
We consulted MarketsandMarkets for potential Partner Identification. Overall, it was a good experience. The insights provided through interviews conducted by the team helped us put together the questionnaire required for discussion with the selected partners. Their ability to provide insights through interviews with customers in a timely manner was quite impressive.


Growth opportunities and latent adjacency in LNG Terminals Market