
Loyalty Management Market Size, Share, Growth Opportunities & Latest Trends

Loyalty Management Market by Offering (Solutions (Platform-based, API-based) and Services), Program Type, Application, Business Model, and Vertical (BFSI, Aviation, Automotive, Media, Retail & Consumer Goods) - Global Forecast to 2030


OVERVIEW
Source: Secondary Research, Interviews with Experts, MarketsandMarkets Analysis
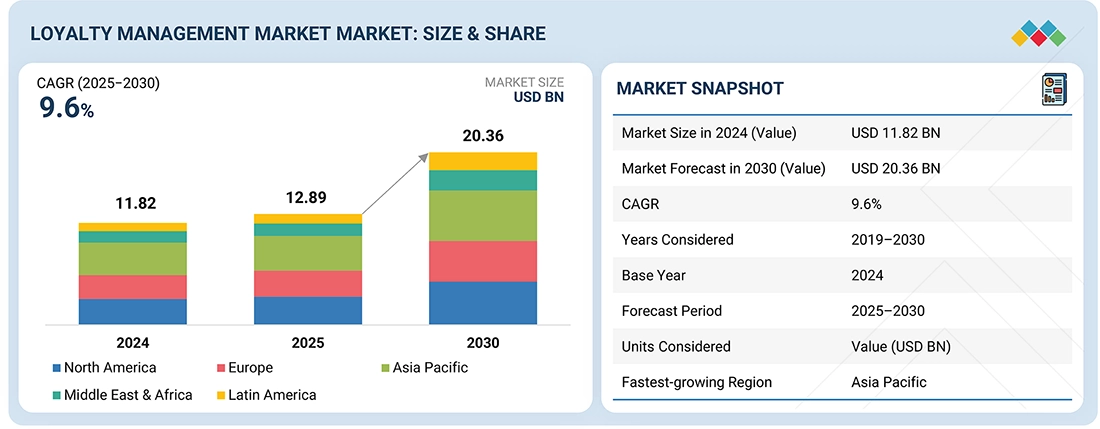
The loyalty management market is projected to reach USD 20.36 billion by 2030 from USD 12.89 billion in 2025, at a CAGR of 9.6% from 2025 to 2030. The growth of the loyalty management market is driven by the rising need for customer retention, increasing digital engagement across industries, and the growing use of data analytics and AI to deliver personalized rewards and experiences.
Market Size and Forecast:
- Market Size Value in 2024: USD 11.82 Billion
- Market Size Value in 2025: USD 12.89 Billion
- Revenue Forecast in 2030: USD 20.36 Billion
- Growth Rate: CAGR of 9.6% from 2025 to 2030
- Data available from 2019 to 2030
- Base year: 2024
- Forecast period: 2025-2031
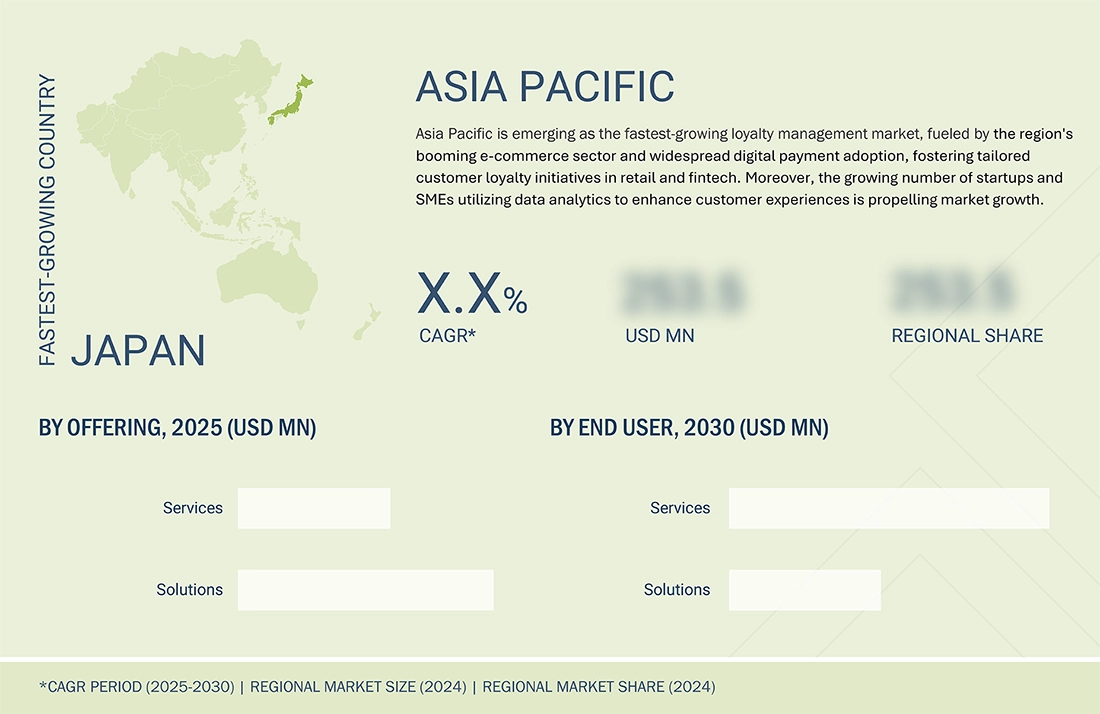
- Largest Growing Region: Asia Pacific
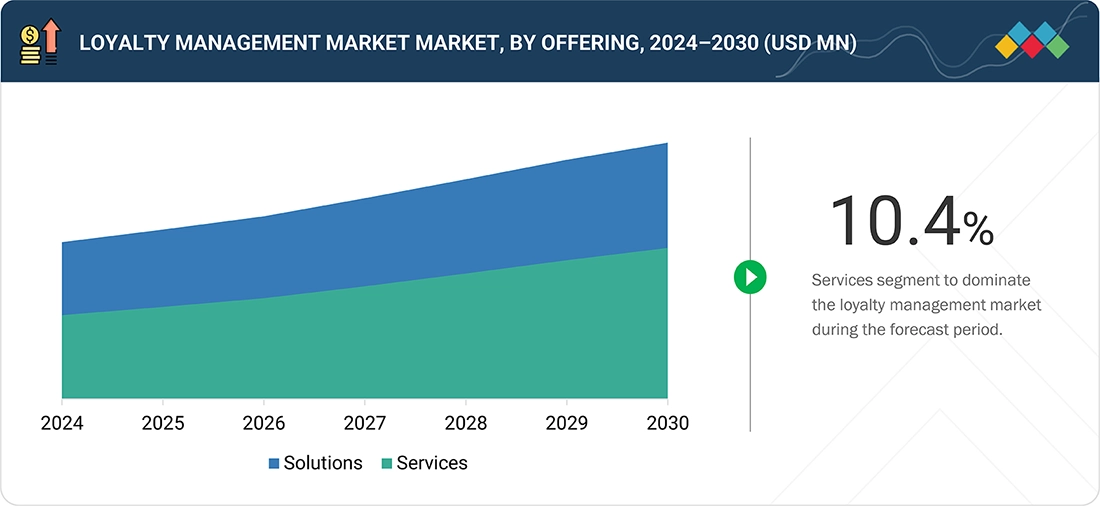
- The Loyalty Management Services growing at a CAGR of 10.4 %
Key Market Trends and Insights
- By Offering: The Loyalty Management Market is driven by AI-powered personalization, omnichannel rewards, and customer retention across key industries..
-
Key Drivers : The Loyalty Management Market is driven by demand for personalized rewards, customer retention, AI-driven insights, and omnichannel engagement.
- Growing Trends: AI-driven personalization, omnichannel engagement, gamified rewards, and real-time incentives are transforming the Loyalty Management Market.
- Growth Opportunities: Startups in the Loyalty Management Market gain opportunities through AI-driven personalization, gamified rewards, and omnichannel customer engagement solutions.
KEY TAKEAWAYS
- The Asia Pacific loyalty management market accounted for a 31.3% revenue share in 2025.
- By offering, the services segment is expected to register the highest CAGR of 10.4%.
- By program type, the subscription-based segment is projected to grow at the fastest rate from 2025 to 2030.
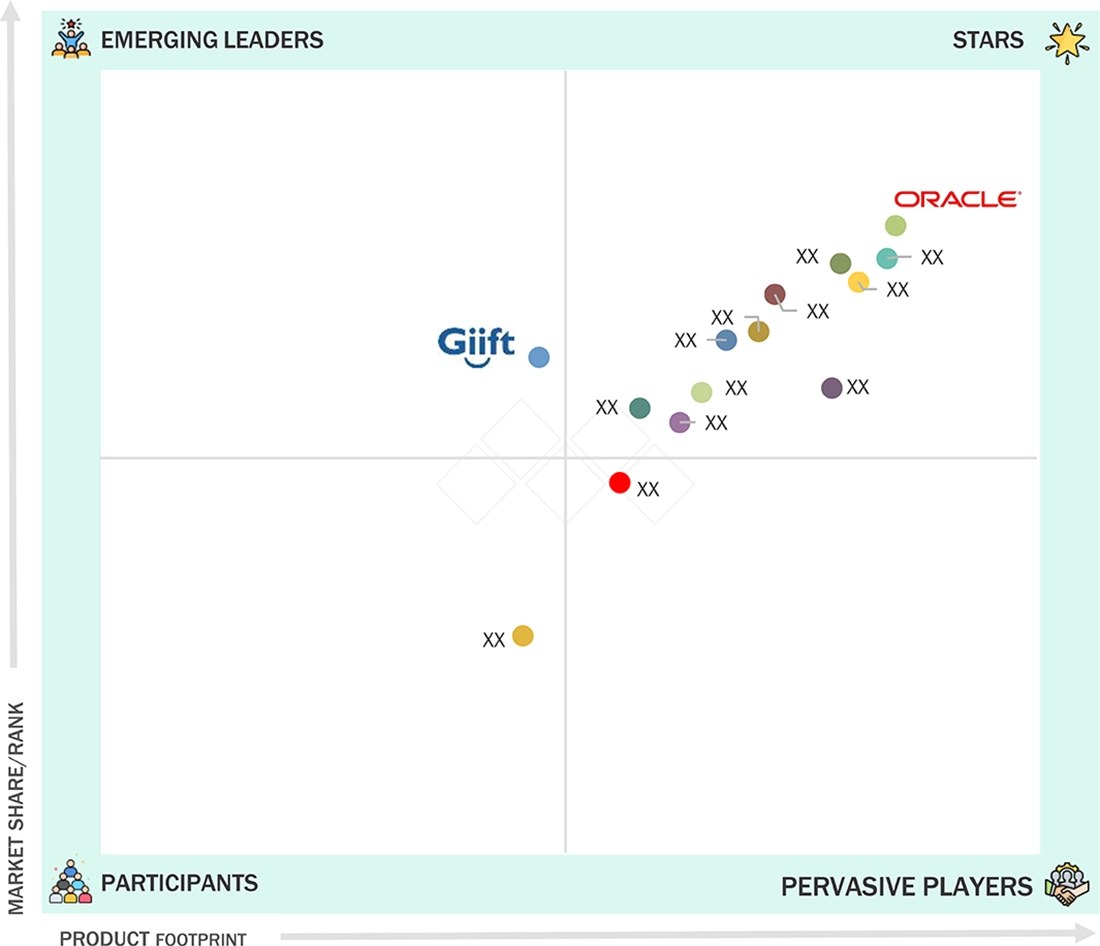
- Company Oracle, Epsilon, and Capillary were identified as some of the star players in the loyalty management market (global), given their strong market share and product footprint.
- Companies Annex Cloud, SessionM, and SumUp among others, have distinguished themselves among startups and SMEs by securing strong footholds in specialized niche areas, underscoring their potential as emerging market leaders
The loyalty management market is witnessing steady growth, driven by the expansion of omnichannel customer engagement strategies, the growing adoption of mobile-based loyalty programs, and the shift toward subscription and experience-based reward models. Additionally, increasing competition across sectors is prompting enterprises to invest in advanced loyalty platforms that foster deeper customer relationships and brand differentiation.
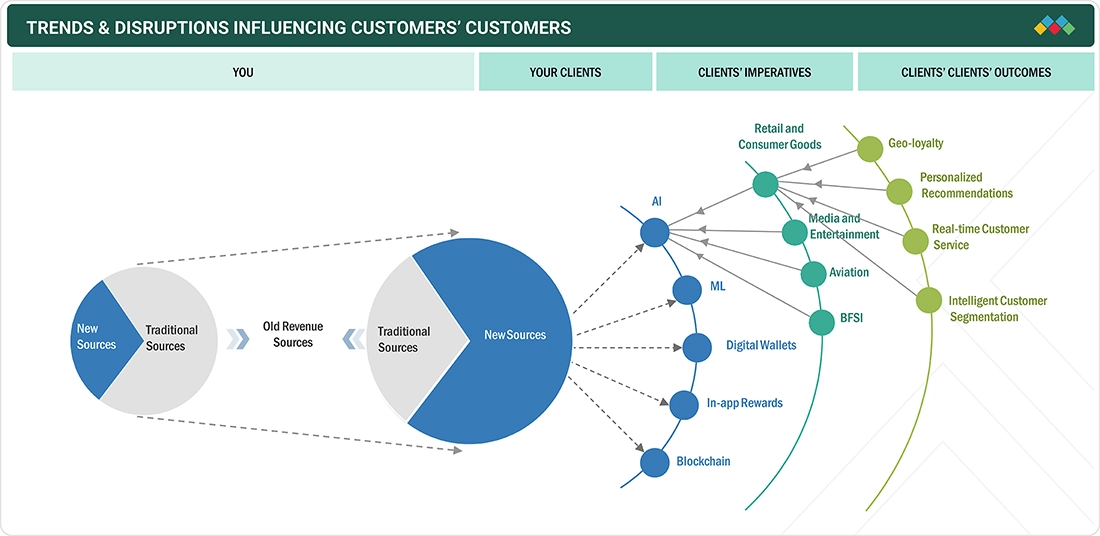
TRENDS & DISRUPTIONS IMPACTING CUSTOMERS' CUSTOMERS
The impact on loyalty management vendors stems from changing customer engagement models and technological advancements. Vendors serve enterprises across retail, BFSI, travel, and telecom, whose end consumers interact with loyalty programs across multiple channels. Trends like AI-driven personalization, omnichannel engagement, and data integration are reshaping loyalty strategies, boosting customer retention and satisfaction. As enterprises prioritize automation and analytics-led loyalty initiatives, demand for intelligent loyalty management platforms continues to grow.
Source: Secondary Research, Interviews with Experts, MarketsandMarkets Analysis
MARKET DYNAMICS
Level
-
AI-Driven Personalization and ROI Focus

-
Integration of gamification into loyalty programs

Level
-
Integration Complexity and Poor Customer Experience Alignment

-
Fragmentation of customer data across various systems and platforms

Level
-
Expanding Reward Customization and Omnichannel Engagement

-
Rising applications of big data and machine learning

Level
-
Data Privacy and Regulatory Compliance

-
Rapidly changing trends and diverse consumer preferences

Source: Secondary Research, Interviews with Experts, MarketsandMarkets Analysis
Driver: AI-Driven Personalization and ROI Focus
The rapid adoption of AI-driven personalization and the measurable return on investment (ROI) that loyalty programs deliver is driving the loyalty management market. Brands are leveraging generative and agentic AI to automate, optimize, and personalize loyalty experiences at scale. This technological leap enables companies to offer hyper-personalized rewards, contextual engagement, and real-time offers, which resonate deeply with consumers’ desire to be recognized as individuals rather than mere data points. The integration of AI into loyalty platforms is fundamentally transforming how brands interact with their customers, making loyalty programs more relevant, engaging, and efficient. As a result, companies are reporting the highest ROI ever from their loyalty initiatives, with satisfaction among program owners rising sharply, with over 69% expressing satisfaction. This success is prompting larger budgets and expanded teams dedicated to loyalty marketing. Furthermore, the ability to quickly adapt offers, automate management, and deliver value through AI-powered insights is setting new industry standards and driving widespread adoption and investment in loyalty management solutions.
Restraint: Integration Complexity and Poor Customer Experience Alignment
A significant restraint in the loyalty management market is the ongoing challenge of integrating loyalty programs seamlessly with broader customer experience (CX) strategies and existing technology stacks. According to the Antavo report, 71.4% of dissatisfied program owners cite poor integration with customer experience as the main reason for their dissatisfaction. Many organizations struggle to align their loyalty initiatives with the overall customer journey, often due to siloed data, legacy systems, or a lack of holistic planning. This misalignment can result in fragmented experiences and diminished program impact. Additionally, the complexity of managing multiple touchpoints and integrating new AI tools with existing infrastructure can be intimidating, leading to operational inefficiencies and reduced effectiveness.
Opportunity: Expanding Reward Customization and Omnichannel Engagement
Consumers are increasingly seeking greater choice and flexibility in how they earn and redeem rewards, with four out of ten expressing a desire for more non-transactional ways to participate in loyalty programs. This shift opens the door for brands to innovate with personalized reward structures, gamified experiences, and family or group accounts, features that are gaining popularity and driving higher engagement. The integration of AI-powered analytics enables brands to better understand individual preferences and tailor rewards accordingly, increasing perceived value and fostering deeper loyalty. Omnichannel engagement is also becoming a key differentiator, as customers expect seamless experiences across digital, mobile, and in-store channels. Brands that successfully unify loyalty touchpoints and offer consistent, context-aware interactions can significantly enhance customer satisfaction and retention.
Challenge: Data Privacy and Regulatory Compliance
As loyalty programs become more sophisticated and data-driven, leveraging AI, machine learning, and advanced analytics, the volume and sensitivity of customer data being collected and processed have increased dramatically. This raises significant concerns around data protection, especially considering evolving global regulations such as GDPR, CCPA, and other local privacy laws. Brands must navigate a complex landscape of compliance requirements, ensuring that customer data is collected, stored, and used transparently and securely. Any misstep can result in severe reputational damage, legal penalties, and erosion of customer trust. Additionally, the adoption of AI introduces new risks related to algorithmic bias, data governance, and ethical considerations. Companies must invest in robust security infrastructure, clear consent mechanisms, and ongoing staff training to mitigate these risks.
Loyalty Management Market: COMMERCIAL USE CASES ACROSS INDUSTRIES
| COMPANY | USE CASE DESCRIPTION | BENEFITS |
|---|---|---|
 |
Dunkin’ partnered with Epsilon to build and enhance its DD Perks loyalty program, focusing on customer retention and personalized engagement in a competitive coffee retail market. The partnership has been ongoing since 2013. | 24 million customers enrolled in DD Perks since launch | 50% increase in member spending year-over-year | Over 20 million real-time transactions processed daily |
 |
rue21 is a US-based fashion retailer targeting teens and young adults (ages 15–25) with over 650 stores. It launched rue21 REWARDS, a customer loyalty program built on Oracle CrowdTwist, to gain deeper insights into shopper behavior, increase personalization, and drive repeat purchases. | Loyalty program launched in just 8 months during the pandemic | 5 million+ members enrolled in first year, growing to 7 million+ | Earned a spot on Newsweek’s list of America’s top loyalty programs | Increased shopping frequency and engagement among loyalty members |
 |
DefenAge implemented a structured loyalty rewards program powered by Zinrelo to improve customer retention, increase repeat purchases, and strengthen brand loyalty. | 65% increase in customer retention | 57% increase in repeat revenue per member | 33% increase in customer purchase frequency | Stronger customer-brand relationships and long-term engagement |
Logos and trademarks shown above are the property of their respective owners. Their use here is for informational and illustrative purposes only.
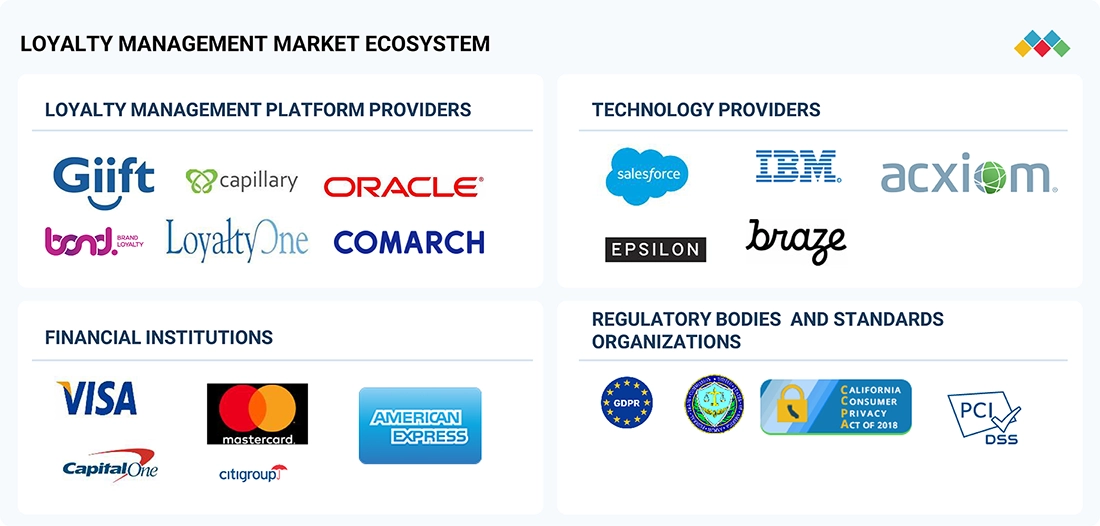
MARKET ECOSYSTEM
The loyalty management market ecosystem thrives on a collaborative network of platform providers offering tailored reward solutions and technology firms delivering advanced analytics and AI capabilities. Financial institutions enhance transaction integration, while regulatory bodies ensure compliance and data security. This synergy fosters innovative customer retention strategies across industries.
Logos and trademarks shown above are the property of their respective owners. Their use here is for informational and illustrative purposes only.
MARKET SEGMENTS
Source: Secondary Research, Interviews with Experts, MarketsandMarkets Analysis
Loyalty Management Market, By Solution
API-based loyalty management solutions are projected to witness the fastest growth rate during the forecast period. API-based loyalty management solutions provide a flexible and modular strategy for creating loyalty programs. They function through APIs that enable companies to integrate loyalty features, such as earning points, tier progression, and rewards, into their digital platforms like mobile apps, e-commerce websites, and partner systems. Unlike traditional systems, API-based solutions offer significant customization and adaptability, making them perfect for businesses seeking agile and scalable loyalty infrastructure. These solutions are becoming increasingly popular due to the growing demand for omnichannel loyalty experiences and the necessity for real-time personalization.
Loyalty Management Market, By Program Type
Points-based loyalty programs are the most common customer retention strategy, allowing customers to earn points for purchases and various brand interactions, such as referrals, reviews, or social sharing. These points can later be redeemed for discounts, free items, or exclusive rewards. The simplicity and flexibility of points-based loyalty programs have made them the default option for retailers, service providers, and FMCG brands worldwide. Points-based systems are highly adaptable, enabling brands to adjust point values, redemption options, and integrate gamification or tiered elements for enhanced engagement.
Loyalty Management Market, By Application
The Customer lifecycle management application segment is expected to have the largest market size during the forecast period. It involves managing and optimizing the entire customer journey, from acquisition and activation to retention and re-engagement, using loyalty programs as a strategic tool. Its primary role is to maximize customer lifetime value by providing targeted incentives and personalized experiences at every stage of the relationship. Brands are investing in advanced analytics, automation, and omnichannel integration to create seamless, context-aware loyalty experiences that foster lasting relationships.
REGION
Asia Pacific to be fastest-growing region in global aerospace materials market during forecast period
The Asia Pacific loyalty management market is expected to register the highest CAGR during the forecast period, driven by evolving consumer behaviors and emerging trends. The region’s diverse markets, from tech-savvy Japan to price-sensitive India, require flexible loyalty programs. Consumers here prefer instant gratification, with programs like GrabRewards offering real-time points redemption for rides or food deliveries, which aligns with the fast-paced lifestyle. Subscription-based loyalty models, such as those by Alibaba’s 88VIP, are gaining traction by providing exclusive benefits for a monthly fee. The integration of social media platforms, like WeChat in China, enables brands to engage customers through mini programs, blending loyalty with social interaction. Asia Pacific’s youthful, digitally engaged population and rising disposable incomes create a dynamic market for loyalty management, emphasizing creativity and consumer-centric strategies.
Loyalty Management Market: COMPANY EVALUATION MATRIX
In the loyalty management market matrix, Oracle (Star) leads with a strong market share and extensive product footprint, with a comprehensive, data-driven platform that enables omnichannel engagement, personalized rewards, and scalable loyalty programs for enterprises focused on customer retention and lifetime value. GIIFT Management (Emerging Leader) is rapidly gaining traction by offering innovative, partner-centric loyalty solutions that empower businesses to launch customizable rewards programs and foster deeper customer engagement through global partnerships. While Oracle dominates through scale and a diverse portfolio,GIFFT Management shows significant potential to move toward the leaders’ quadrant as demand for loyalty management continues to rise.
Source: Secondary Research, Interviews with Experts, MarketsandMarkets Analysis
KEY MARKET PLAYERS
- Epsilon (US)
- Oracle (US)
- Comarch (Poland)
- Bond Brand Loyalty (Canada)
- June 2024 : Merkle expanded its partnership with Braze, becoming a global strategic partner in the Braze Alloys Partner Program. This collaboration aims to deliver digital messaging innovation for leading brands, leveraging Merkle's expertise in integrating and customizing the Braze platform, as evidenced by their work with UScellular to enhance customer segmentation, personalization, and loyalty.
- March 2024 : Epsilon launched the next generation of its retail media platform. Epsilon Retail Media utilized AI and a person-first identity in the ad server, unlocking opportunities to drive better outcomes with shoppers on retailers’ properties, across the open web, or in tandem.
- August 2023 : The growth-focused private equity firm Cohere Capital acquired ICF Next’s commercial marketing group and established it as Phaedon, a standalone technology-enabled marketing and communications company.
- May 2023 : Bond Brand Loyalty announced a strategic investment from Colorado-based private equity firm Mountaingate Capital. This announcement followed a substantial period of growth for Bond and reflected the potential for further expansion in both reach and offerings to better serve clients.
Table of Contents
 Exclusive indicates content/data unique to MarketsandMarkets and not available with any competitors.
Methodology
This research study involved extensive use of secondary sources, directories, and databases, such as Dun & Bradstreet (D&B) Hoovers and Bloomberg BusinessWeek, to identify and collect information useful for a technical, market-oriented, and commercial study of the loyalty management market. The primary sources mainly included industry experts from core and related industries, along with preferred suppliers, manufacturers, distributors, service providers, technology developers, alliances, and organizations related to all segments of the value chain in this market. In-depth interviews were conducted with various primary respondents, including key industry participants, subject matter experts, C-level executives of major market players, and industry consultants, to obtain and verify critical qualitative and quantitative information.
Secondary Research
The global market size for companies offering loyalty management was determined based on secondary data from both paid and unpaid sources. It was also assessed by analyzing the product portfolios of major companies and evaluating them according to their performance and quality. In the secondary research process, a variety of secondary sources were consulted to identify and gather information for the study. These sources included annual reports, press releases, and investor presentations from companies; white papers, journals, and reputable publications; as well as articles from recognized authors, directories, and databases.
Secondary research was primarily utilized to gather essential information regarding the industry’s value chain and supply chain, and to identify key players through various solutions and services, market classification and segmentation based on the offerings of major players, industry trends related to technologies, applications, and regions, as well as significant developments from both market-oriented and technology-oriented perspectives.
Primary Research
In the primary research process, various primary sources from both the supply and demand sides were interviewed to gather qualitative and quantitative information about the market. The primary sources from the supply side included a range of industry experts such as Chief Experience Officers (CXOs), Vice Presidents (VPs), directors from business development, marketing, and product development or innovation teams, key executives from loyalty management solution vendors, professional service providers, industry associations, and key opinion leaders.
Interviews were conducted to gather insights, including market statistics, revenue data from solutions and services, market breakdowns, market size estimates, market forecasts, and data triangulation. Primary research also contributed to understanding various trends related to technologies, applications, deployments, and regions. Stakeholders from the demand side, including Chief Information Officers (CIOs), Chief Technology Officers (CTOs), Chief Strategy Officers (CSOs), and end users of loyalty management solutions, were interviewed to gain the buyer’s perspective on suppliers, products, service providers, and their current use of loyalty management solutions, which would affect the overall loyalty management market.

Note 1: Others include sales managers, marketing managers, and product managers.
Note 2: Tier 1 companies’ revenues are more than USD 10 billion; tier 2 companies’ revenues range between USD 1 and 10 billion; and tier 3 companies’ revenues range between USD 500 million and USD 1 billion.
Source: Industry Experts
To know about the assumptions considered for the study, download the pdf brochure
Market Size Estimation
Multiple approaches were adopted to estimate and forecast the size of the loyalty management market. The first approach involves estimating market size by summing the revenue generated by companies from selling loyalty management offerings. Top-down and bottom-up methods were utilized to estimate and validate the total size of the loyalty management market. These techniques were also extensively applied to estimate the size of various market segments. The research methodology used to evaluate the market size is listed below.
- Key players in the market have been identified through extensive secondary research.
- In terms of value, the industry’s supply chain and market size have been determined through primary and secondary research processes.
- All percentage shares, splits, and breakups have been determined using secondary sources and verified through primary sources.
Loyalty Management Market : Top-Down and Bottom-Up Approach

Data Triangulation
After determining the overall market size, the loyalty management market was divided into several segments and subsegments. A data triangulation procedure was employed to complete the overall market engineering process and obtain the precise statistics for all segments and subsegments, where applicable. The data was triangulated by analyzing various factors and trends from both the demand and supply sides. In addition to data triangulation and market breakdown, the market size was validated using top-down and bottom-up approaches.
Market Definition
Loyalty management involves a series of activities aimed at acquiring, engaging, and retaining stakeholders to strengthen relationships with customers and other partners. Loyalty programs are designed to provide an interactive environment among a business organization, its customers, employees, and channel partners (distributors and resellers). Loyalty management is a comprehensive solution that facilitates intelligent, personalized engagements, thereby increasing customer loyalty. Loyalty management software enables users to design, build, launch, manage, and analyze various types of loyalty programs.
Stakeholders
- System Integrators
- Value-added Resellers
- Cloud Service Providers
- Software Developers
- Application Developers
- Customer Loyalty Solution Vendors
- Channel Loyalty Solution Vendors
- Customer Analytics Solution Vendors
- Distributors and Resellers of Loyalty Management Solutions
Report Objectives
- To determine and forecast the global loyalty management market by offerings (solutions and services), program type, application, business model, vertical, and region
- To forecast the size of the market segments for North America, Europe, Asia Pacific, Latin America, and the Middle East & Africa
- To provide detailed information about the major factors (drivers, restraints, opportunities, and challenges) influencing the growth of the loyalty management market
- To analyze each submarket concerning individual growth trends, prospects, and contributions to the overall loyalty management market
- To analyze the opportunities in the market for stakeholders by identifying the high-growth segments of the loyalty management market
- To profile the key market players; provide a comparative analysis based on business overviews, regional presence, product offerings, business strategies, and key financials; and illustrate the market’s competitive landscape
- Track and analyze competitive developments in the market, such as mergers and acquisitions, product developments, partnerships and collaborations, and research and development (R&D) activities
Available Customizations
With the given market data, MarketsandMarkets offers customizations to meet the company’s specific needs. The following customization options are available for the report:
Country-wise information
- Analysis for additional countries (up to five)
Company Information
- Detailed analysis and profiling of additional market players (up to 5)
Key Questions Addressed by the Report
What is the definition of the loyalty management market?
Loyalty management refers to the strategic process of attracting, retaining, and nurturing customer relationships through various programs, incentives, and personalized interactions. Its primary goal is to foster long-term engagement and repeat business by recognizing, rewarding, and understanding customer behavior. This process involves collecting customer data, analyzing preferences, segmenting customers, and delivering tailored offers, experiences, and communications that encourage ongoing support.
What is the market size of the loyalty management market?
The loyalty management market is projected to grow from USD 12.89 billion in 2025 to USD 20.36 billion by 2030 at a CAGR of 9.6% from 2025 to 2030.
What are the major drivers of the loyalty management market?
The major drivers of the loyalty management market include a growing focus on reducing customer churn rates, the integration of gamification into loyalty programs, companies strategically investing in loyalty programs amid recession and inflation, the emergence of loyalty management mobile applications, the demand for advanced solutions to monitor customer scores and enhance customer engagement, and the rising adoption of an omnichannel customer loyalty strategy.
Who are the key players operating in the loyalty management market?
The key players profiled in the loyalty management market include Epsilon (US), Oracle (US), Comarch (Poland), Bond Brand Loyalty (Canada), Merkle (US), Capillary (Singapore), Jakala (Italy), Kobie (US), Giift Management (Singapore), Maritz Motivation (US), Cheetah Digital (US), Collinson (UK), AIR MILES Loyalty (Canada), Punchh (US), Ebbo (US), Preferred Patron (US), Loopy Loyalty (China), Paystone (UK), LoyLogic (Switzerland), Ascenda (Singapore), Loyalty Juggernaut (US), Gratifii (Australia), SAP SE (Germany), Annex Cloud (US), Apex Loyalty (US), Sumup (UK), Kangaroo (Canada), Smile.io (Canada), SessionM (US), LoyaltyLion (UK), Yotpo (US), SailPlay (US), Phaedon (US), and Zinrelo (US).
What are the key technological trends prevailing in the loyalty management market?
The loyalty management market is increasingly driven by AI and hyper-personalization, leveraging data analytics to deliver tailored offers and experiences. There is a strong shift toward omnichannel integration and mobile-first strategies, ensuring seamless customer engagement across all touchpoints. Additionally, gamification and experiential rewards are gaining prominence to foster deeper, more engaging customer relationships beyond mere transactions benefits.
Need a Tailored Report?
Customize this report to your needs
Get 10% FREE Customization
Customize This ReportPersonalize This Research
- Triangulate with your Own Data
- Get Data as per your Format and Definition
- Gain a Deeper Dive on a Specific Application, Geography, Customer or Competitor
- Any level of Personalization
Let Us Help You
- What are the Known and Unknown Adjacencies Impacting the Loyalty Management Market
- What will your New Revenue Sources be?
- Who will be your Top Customer; what will make them switch?
- Defend your Market Share or Win Competitors
- Get a Scorecard for Target Partners

Custom Market Research Services
We Will Customise The Research For You, In Case The Report Listed Above Does Not Meet With Your Requirements
Get 10% Free CustomisationTESTIMONIALS


Growth opportunities and latent adjacency in Loyalty Management Market