
Marketing Automation Market

Marketing Automation Market by Offering (Campaign Management, Analytics & Reporting, Lead Generation, Content Management), Application (Customer Acquisition & Retention, Brand Awareness & Positioning, Upselling & Cross Selling) - Global Forecast to 2030


OVERVIEW
Source: Secondary Research, Interviews with Experts, MarketsandMarkets Analysis
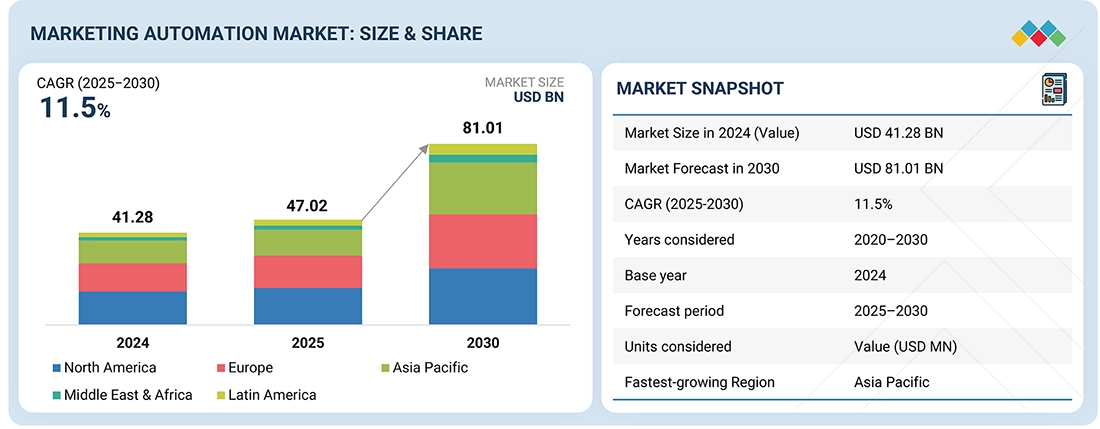
The Marketing Automation market is projected to grow from USD 47.02 billion in 2025 to USD 81.01 billion by 2030, at a CAGR of 11.5%. Growth is driven by AI-powered solutions enabling hyper-personalized campaigns, predictive analytics, and dynamic content automation across email, SMS, social, and web channels. Enterprises leverage omnichannel marketing automation platforms integrated with CRM systems and big data analytics to optimize customer acquisition, retention, and engagement. Rising adoption of account-based marketing, AI-driven campaign management, and multichannel strategies enhances targeting precision, performance measurement, and revenue attribution. These trends, coupled with compliance automation and increasing investments, are fueling long-term innovation and market expansion.
Market Size and Forecast:
- Market Size Value in 2024: USD 41.28 Billion
- Market Size Value in 2025: USD 47.02 Billion
- Revenue Forecast in 2030: USD 81.01 Billion
- Growth Rate: CAGR of 11.5 % from 2025 to 2030
- Data available from 2020 to 2030
- Base year: 2024
- Forecast period: 2025-2030
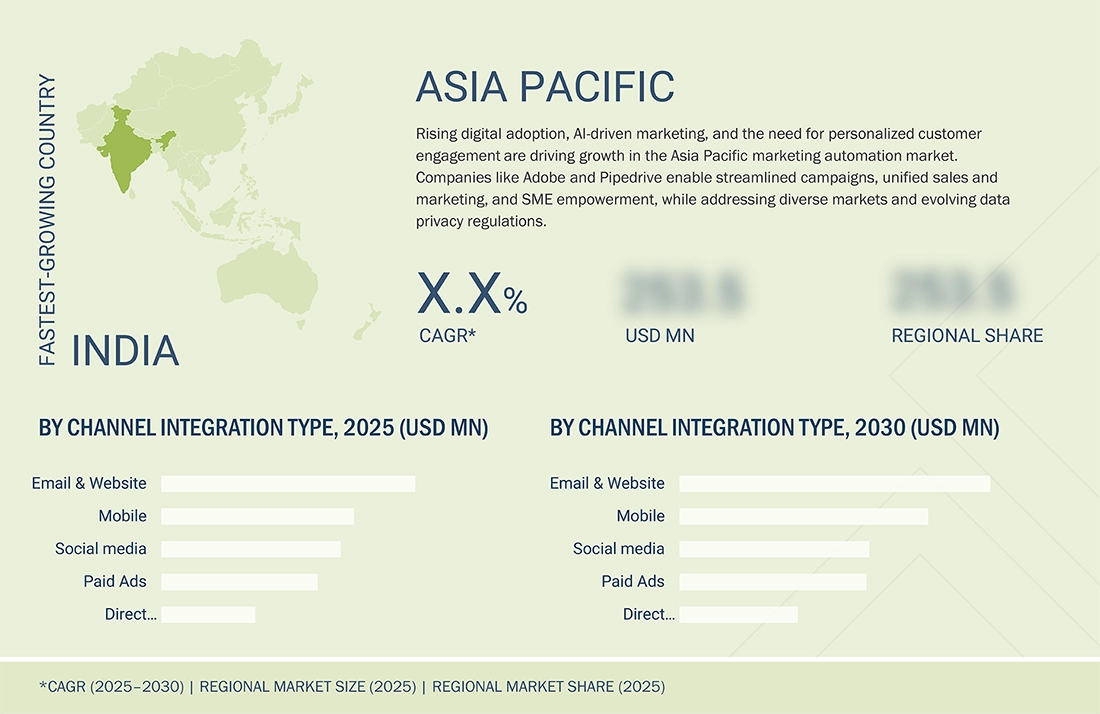
- Largest Growing Region: Asia Pacific
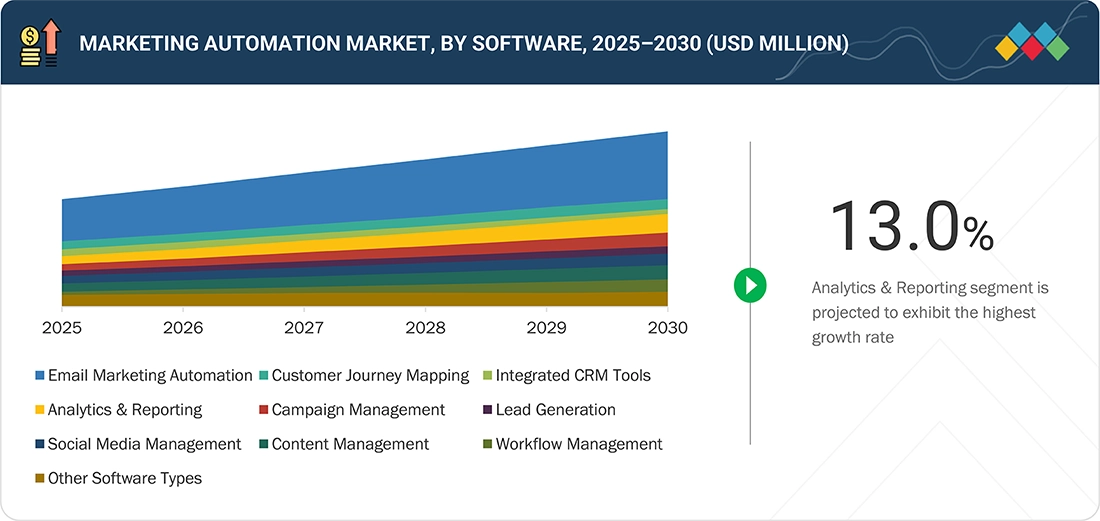
- The Marketing Automation Analytics and Reporting Segment growing at a CAGR of 13.0 %
Key Market Trends and Insights
- Key Drivers : Marketing Automation Market growth is driven by AI-powered personalization, omnichannel engagement, lead nurturing, and ROI optimization.
- By platform : the analytics & reporting segment is projected to be the fastest growing segment, with CAGR of 13.0%, during the forecast period.
- By deployment mode, the cloud segment has the largest market share of 73.6% in 2025.
- Growing Trends: Marketing Automation Market trends include generative AI, hyper-personalization, predictive analytics, and agentic AI.
- Growth Opportunities: Marketing Automation Market supports startup growth through predictive analytics and automated engagement platforms..
- Emerging Technologies : The Marketing Automation Market leverages AI, cloud platforms, and predictive analytics for growth.
KEY TAKEAWAYS
- North America dominates the Marketing Automation market by 35.3% market share in 2025.
- By channel integration type, the mobile segment is projected to be the fastest growing segment, during the forecast period.
- By application, the customer acquisition & retention segment is projected to dominate the market.
- By end user, the healthcare & life sciences segment is expected to be the fastest growing segment, during the forecast period.
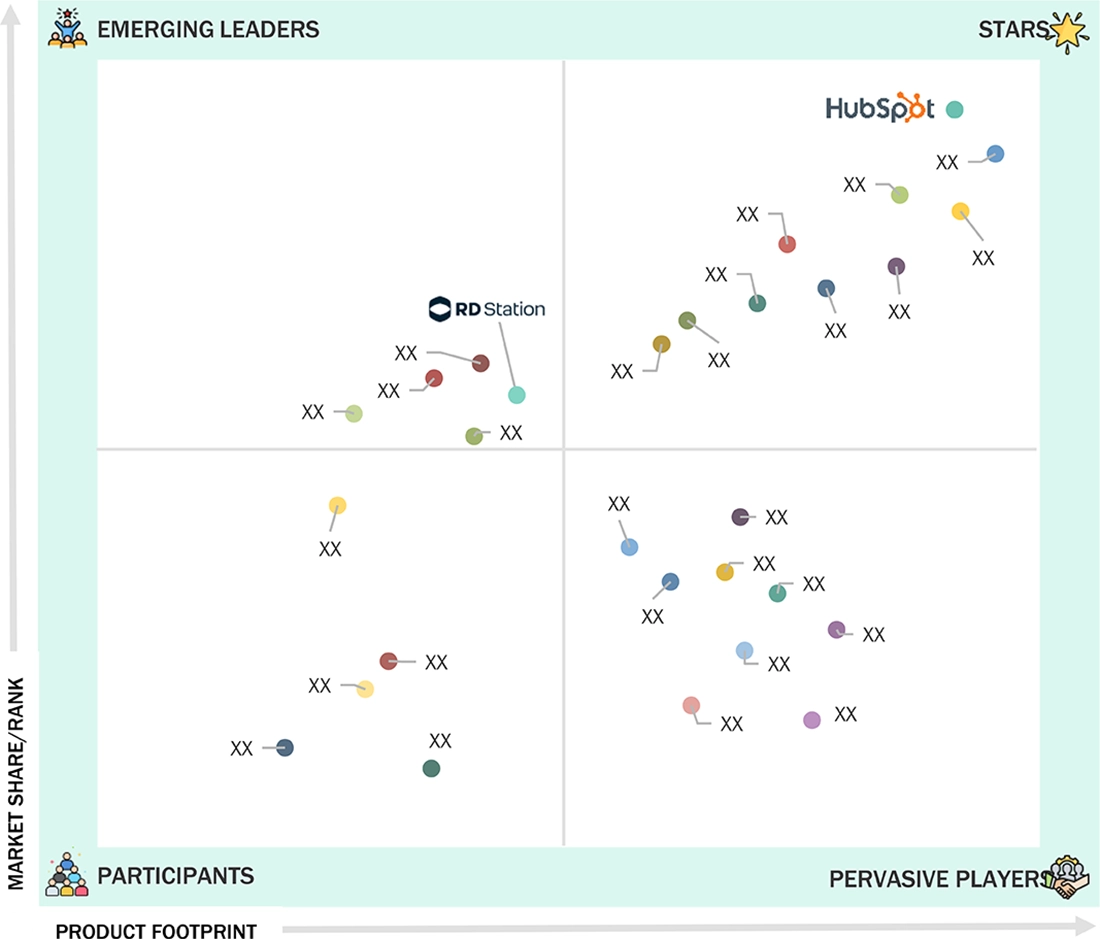
- HubSpot, Adobe and Oracle are identified as some of the star players in the Marketing Automation market, given their strong market share and product footprint.
- GetResponse, ClickDimensions and Maropost, among others, have distinguished themselves among startups and SMEs by securing strong footholds in specialized niche areas, underscoring their potential as emerging leaders.
The Marketing Automation market is witnessing strong adoption as enterprises increasingly rely on data-driven, AI-powered tools to improve customer acquisition, retention, and engagement. For subscribers of market intelligence reports, this reflects how automation is reshaping marketing performance across industries. With AI, predictive analytics, and cloud-based orchestration, businesses can deliver personalized campaigns at scale, automate workflows, and track ROI in real time. The growing focus on measurable outcomes, agile execution, and customer-centric engagement underscores why marketing automation remains a strategic investment priority worldwide.
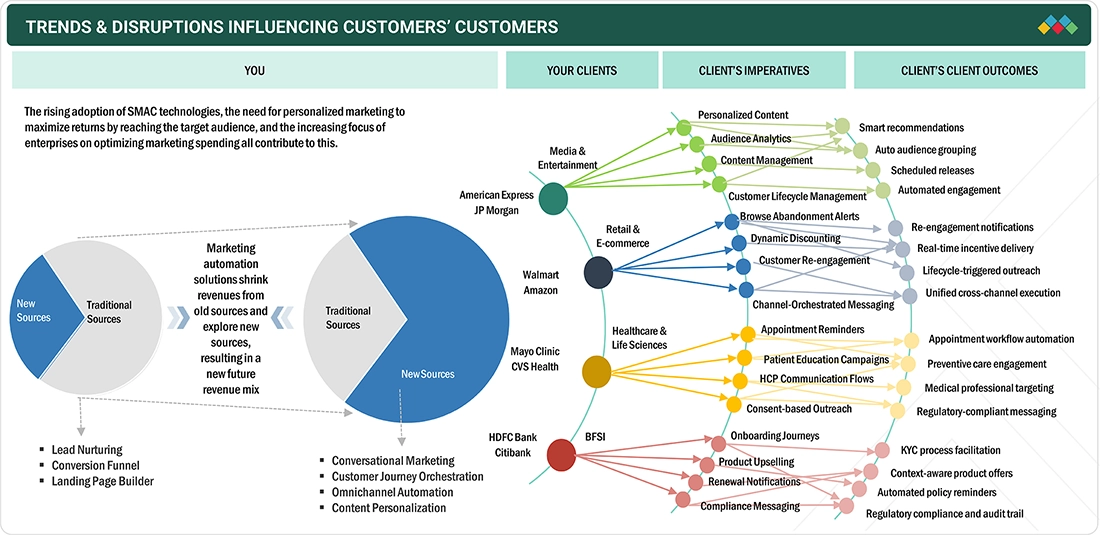
TRENDS & DISRUPTIONS IMPACTING CUSTOMERS' CUSTOMERS
The Marketing Automation market is rapidly evolving, driven by advances in AI-powered personalization, predictive analytics, and generative AI for content creation. Vendors traditionally relied on subscription-based platforms and on-premises licensing, but growing demand for hyper-personalized, data-driven engagement is reshaping business models. Companies now focus on AI-enabled email and SMS campaigns, dynamic customer segmentation, and cross-channel orchestration across mobile, web, and social platforms. Real-time behavioral analytics, automated workflows, and generative AI for personalized content optimize campaign performance, enabling scalable, outcome-driven marketing. These capabilities position vendors as strategic partners delivering measurable value in customer engagement, retention, and digital marketing efficiency.
Source: Secondary Research, Interviews with Experts, MarketsandMarkets Analysis
MARKET DYNAMICS
Level
-
Transforming customer engagement using AI-powered marketing automation

-
Need for personalized marketing to maximize returns by reaching the target audience

Level
-
AI-marketing talent gap restricting scalable automation deployment across enterprises

Level
-
Accelerating real-time hyper-personalization with Generative AI

-
Maximize ROI with predictive analytics and autonomous campaign management

Level
-
Overcoming integration gaps and content bottlenecks in marketing automation systems

Source: Secondary Research, Interviews with Experts, MarketsandMarkets Analysis
Driver: Transforming customer engagement using AI-powered marketing automation
The Marketing Automation market is driven by AI-powered platforms offering behavioral scoring, predictive analytics, dynamic segmentation, and real-time insights. Generative AI enables scalable content creation—personalized emails, product recommendations, landing pages, and ads—while cross-channel orchestration ensures consistent, contextually relevant engagement across email, mobile, web, and social platforms, transforming static automation into agile, outcome-focused marketing. Enterprises leverage these capabilities to enhance customer experiences, optimize campaign performance, and achieve higher ROI in increasingly competitive and experience-driven digital ecosystems.
Restraint: AI-marketing talent gap restricting scalable automation deployment across enterprises
Adoption is restrained by the shortage of professionals combining AI fluency with marketing expertise. Limited ability to leverage predictive analytics, behavioral modeling, and GenAI content creation slows deployment, reduces ROI, and constrains campaign scalability. Bridging this gap requires simplified AI interfaces, low-code/no-code platforms, embedded training, and managed services. Cross-functional collaboration and user-friendly design are critical to accelerating adoption and ensuring broader usage of AI-powered marketing automation in enterprises with fragmented or limited in-house expertise.
Opportunity: Accelerating real-time hyper-personalization with Generative AI
Generative AI presents a major opportunity by enabling hyper-personalization at scale. Real-time user interactions and contextual data power automated, tailored content across emails, landing pages, social media, and product messaging. Continuous learning from engagement data allows campaigns to adapt dynamically, improving conversion rates, reducing production time, and accelerating go-to-market cycles. AI-driven A/B testing, cross-channel orchestration, and analytics enable outcome-focused marketing while minimizing resource constraints. Vendors embedding GenAI and real-time analytics position themselves as essential partners for enterprises seeking scalable, personalized, and data-informed marketing solutions.
Challenge: Overcoming integration gaps and content bottlenecks in marketing automation systems
Marketing automation adoption is challenged by fragmented technology stacks, integration gaps across CRM, CMS, analytics, and automation platforms, and persistent content bottlenecks. Manual content creation delays campaigns and reduces personalization effectiveness. Solutions include modular, API-first platforms, native integrations, smart workflows, and low-code tools. Streamlined onboarding and cross-functional alignment enable faster deployment, data-driven personalization, and automation at scale, allowing enterprises to overcome operational inefficiencies and achieve seamless, agile marketing execution in complex digital environments.
Marketing Automation Market: COMMERCIAL USE CASES ACROSS INDUSTRIES
| COMPANY | USE CASE DESCRIPTION | BENEFITS |
|---|---|---|
 |
Tonies used Braze to implement personalized email and in-app campaigns, re-engaging inactive users, promoting premium content, and leveraging behavioral analytics to deliver targeted messaging across all connected devices. | Achieved a 117% increase in free-to-paid content conversions from 2023 to 2024, activated new users through interactive in-app guides, and enabled targeted, real-time messaging for upsells and personalized promotions. |
 |
PrettyLitter adopted Klaviyo to unify email and SMS marketing, automate workflows, synchronize real-time customer data, and implement lifecycle campaigns targeting lapsed customers, cart abandonment, and subscription management. | Simplified customer data synchronization, improved marketing efficiency by 15%, enabled personalized omnichannel campaigns, and allowed teams to focus on strategic growth while strengthening customer relationships. |
 |
Blue Nile implemented Freshsales CRM to centralize customer data, streamline communication, and provide sales consultants with AI-powered insights, lead scoring, and cross-channel tracking for personalized online engagement. | Enabled sales consultants to prioritize leads with AI insights, reduced response times, increased conversions, delivered consistent omnichannel engagement, and supported mobile access for improved responsiveness and customer support. |
Logos and trademarks shown above are the property of their respective owners. Their use here is for informational and illustrative purposes only.
MARKET ECOSYSTEM
The marketing automation market ecosystem comprises diverse stakeholders. It is bifurcated according to software types such as email marketing automation tools, customer journey mapping, integrated CRM tools, analytics and reporting, campaign management, lead generation, workflow management, content management, social media management, and other software (project and asset management and event and webinar automation). This helps in providing streamlined, personalized customer engagement on a scale, driving efficiency, higher conversions, and improved return on marketing investment.
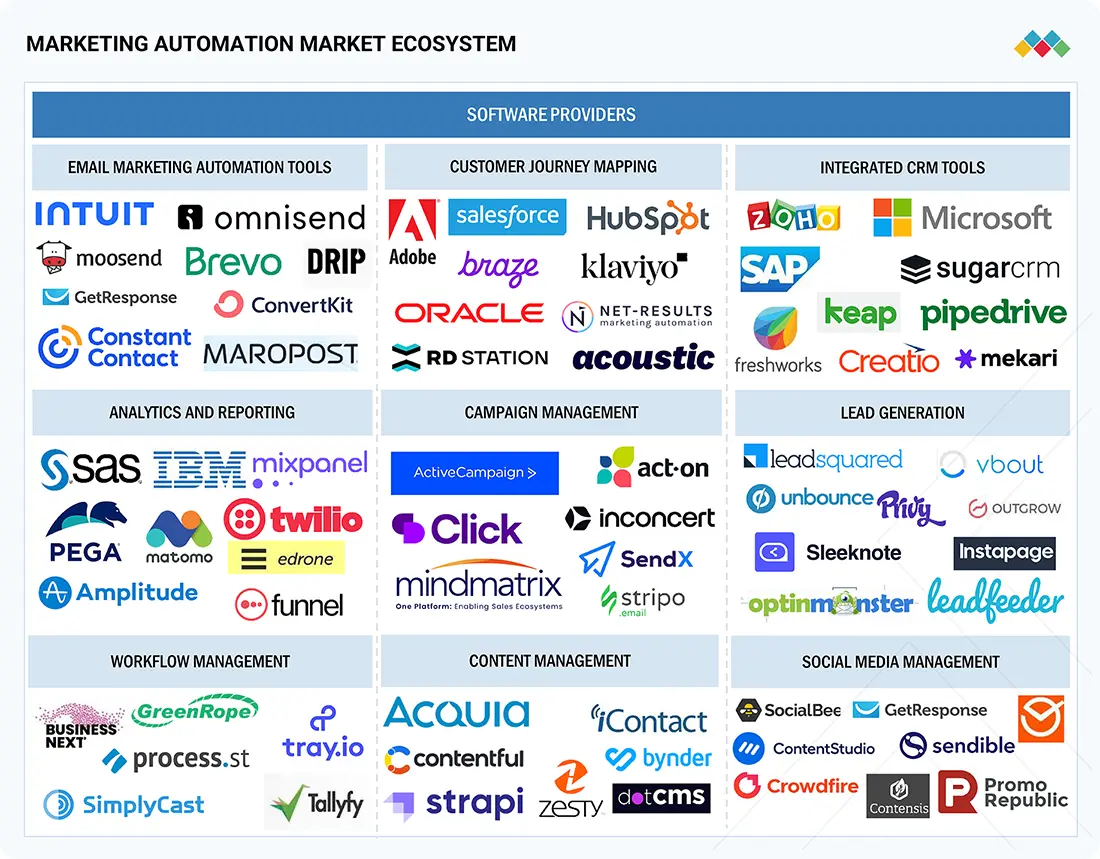
Logos and trademarks shown above are the property of their respective owners. Their use here is for informational and illustrative purposes only.
MARKET SEGMENTS
Source: Secondary Research, Interviews with Experts, MarketsandMarkets Analysis
Marketing Automation Market, By Offering
The Analytics & Reporting segment continues to lead market traction, reflecting growing enterprise investments in AI-driven decision-making and campaign optimization. For report readers, this segment highlights how predictive analytics, automated dashboards, and real-time intelligence are redefining marketing performance. Businesses are channeling higher marketing spend toward advanced measurement tools to enhance ROI visibility and cross-channel orchestration. This evolution signals strong vendor opportunities in data analytics, performance benchmarking, and personalization engines.
Marketing Automation Market, By Channel Integration Type
The Mobile channel remains the fastest-growing integration area, driven by smartphone ubiquity, social commerce, and context-aware customer engagement. Enterprises are using AI-powered push notifications, in-app messaging, and SMS automation to improve immediacy and relevance. For market intelligence subscribers, mobile integration reflects how marketers are aligning automation with customer behavior shifts toward on-the-go interactions—an area ripe for innovation in campaign orchestration, audience analytics, and omnichannel personalization.
Marketing Automation Market, By Application
Customer engagement automation is accelerating as enterprises pursue hyper-personalized, one-to-one experiences across every touchpoint. Predictive analytics, real-time behavioral insights, and loyalty automation are empowering marketers to boost retention, cross-sell, and lifetime value. Report readers can interpret this as a key growth vector, illustrating where investment is flowing into AI-enabled engagement tools that directly impact customer experience metrics and campaign ROI.
Marketing Automation Market, By Enterprise End User
The Healthcare & Life Sciences segment is emerging as one of the most promising adoption areas. Providers and payers are using automation to enhance patient engagement, streamline communication, and ensure compliance with standards such as HIPAA. Platforms supporting personalized messaging, appointment reminders, and digital health outreach are gaining rapid traction. For market report subscribers, this segment highlights scalable, secure, and outcome-driven automation use cases that blend marketing efficiency with patient-centric care delivery.
REGION
Asia Pacific to be the fastest-growing region in the Marketing Automation market during the forecast period
The Asia Pacific Marketing Automation market is witnessing rapid growth, driven by increasing adoption of AI-powered marketing, multi-channel automation, and personalized customer engagement. Countries such as China and India are leading the expansion, with AI-driven email and SMS campaigns, real-time behavioral analytics, and unified CRM solutions gaining prominence. Japan and South Korea are leveraging automation in e-commerce, retail, and digital services to enhance customer experiences and operational efficiency. Rising investments in AI-driven personalization, predictive analytics, and omnichannel campaign management, combined with a large SME base and supportive digital infrastructure, are accelerating demand for scalable, data-compliant, and results-oriented marketing automation solutions.
Marketing Automation Market: COMPANY EVALUATION MATRIX
In the marketing automation market, HubSpot (Star) leads with a robust platform offering AI-powered campaign management, personalized customer journeys, multi-channel automation, and advanced analytics, driving large-scale adoption across SMBs and enterprises. Leveraging integrated CRM capabilities, behavioral segmentation, and real-time reporting, HubSpot enables optimized engagement, lead nurturing, and revenue growth across e-commerce, retail, and digital services. RD Station (Emerging Leader) is gaining traction with automated email and SMS workflows, AI-driven segmentation, and performance analytics, demonstrating strong growth potential while steadily expanding its presence in the Latin American marketing automation ecosystem.
Source: Secondary Research, Interviews with Experts, MarketsandMarkets Analysis
KEY MARKET PLAYERS
MARKET SCOPE
| REPORT METRIC | DETAILS |
|---|---|
| Market Size in 2024 (Value) | USD 41.28 Billion |
| Market Forecast in 2030 | USD 81.01 Billion |
| Growth Rate | CAGR of 11.5% during 2025-2030 |
| Years Considered | 2020-2030 |
| Base Year | 2024 |
| Forecast Period | 2025-2030 |
| Units Considered | Value (USD Billion) |
| Report Coverage | Revenue forecast, company ranking, competitive landscape, growth factors, and trends |
| Segments Covered |
|
| Regions Covered | North America, Asia Pacific, Europe, the Middle East & Africa, and Latin America |
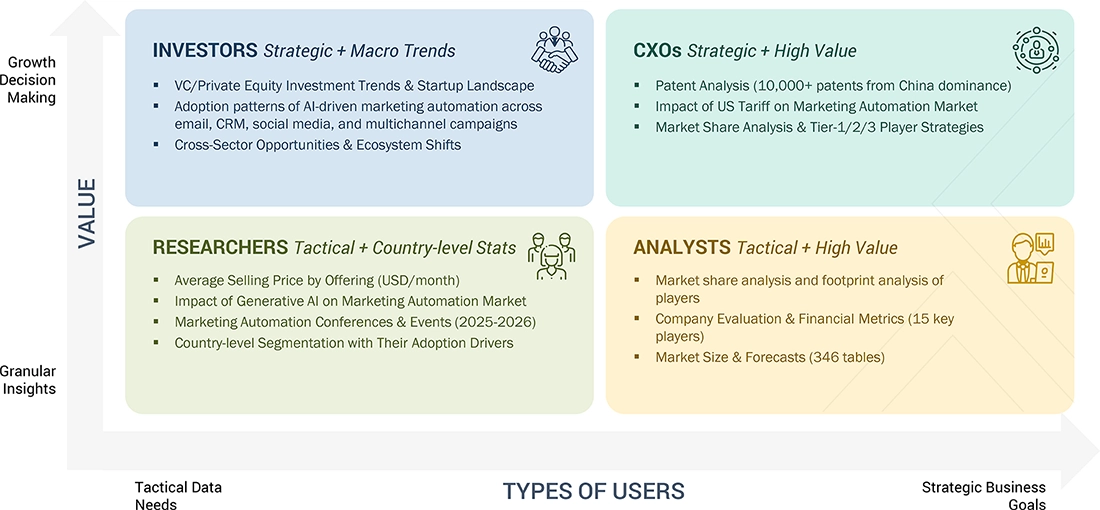
WHAT IS IN IT FOR YOU: Marketing Automation Market REPORT CONTENT GUIDE
DELIVERED CUSTOMIZATIONS
We have successfully delivered the following deep-dive customizations:
| CLIENT REQUEST | CUSTOMIZATION DELIVERED | VALUE ADDS |
|---|---|---|
| Leading Solution Provider (US) | Delivered competitive profiling of additional vendors, brand comparative analysis, and a drill-down of country-level segmentation across key markets. | Enabled competitive positioning insights, product differentiation clarity, and multi-country market intelligence, supporting go-to-market strategy refinement and stakeholder alignment. |
| Leading Solution Provider (Europe) | Provided competitive profiling, brand benchmarking, and segmentation analysis across additional geographies. | Delivered in-depth market insights, comparative brand positioning, and segment-level intelligence, empowering strategic decision-making and regional growth planning. |
RECENT DEVELOPMENTS
- February 2025 : Klaviyo opened a new office in Dublin, Ireland, marking its third international location after London and Sydney. The Dublin office will drive business growth across EMEA, with plans to create over 100 jobs. Initially, the focus will be on building a strong leadership team for sales and business development, followed by expanding other core functions.
- January 2025 : HubSpot completed its acquisition of Frame AI, an AI-powered conversation intelligence platform. Frame AI’s technology will be integrated into HubSpot’s Breeze AI suite, enabling the unification of structured and unstructured data such as emails, calls, and meetings across the customer journey. This empowers the creation of hyper-personalized campaigns, improves segmentation, and enhances marketing automation within Marketing Hub, helping teams deliver more targeted and effective marketing efforts.
- January 2025 : Adobe and Dentsu launched Adobe GenStudio dentsu+, a first-to-market, generative AI-powered integrated marketing ecosystem. This solution merges Adobe’s GenStudio content supply chain suite, including Experience Manager, GenStudio for Performance Marketing, and Firefly AI, with Dentsu’s proprietary services, technology, and Merkury data platform. It empowers marketers to efficiently create, manage, and activate highly personalized, scalable campaigns, optimizing content workflows and audience engagement.
- November 2024 : Sinch and SAP Emarsys partnered to enhance customer engagement by integrating Sinch’s cloud communications, including SMS, MMS, WhatsApp, and Viber, directly into the SAP Emarsys omnichannel platform. This enables brands to deliver highly personalized, real-time interactions on customers’ preferred channels, including those with limited data access. The collaboration ensures secure, data-compliant messaging and supports advanced automation, analytics, and 24/7 AI-powered customer support.
- October 2024 : Thryv Holdings acquired Keap, a leader in CRM and marketing automation for SMBs. This move expands Thryv’s software suite with advanced automation features, enhancing customer engagement and growth tools for small businesses. The combined company now serves over 100,000 SaaS subscribers and strengthens its presence in North America and international markets.
Table of Contents
 Exclusive indicates content/data unique to MarketsandMarkets and not available with any competitors.
Methodology
This research study on the marketing automation market involved extensive secondary sources, directories, IEEE Communication-efficient Algorithms and Systems, International Journal of Innovation and Technology Management, and paid databases. Primary sources were mainly industry experts from the core and related industries, preferred marketing automation providers, third-party service providers, consulting service providers, end users, and other commercial enterprises. In-depth interviews with primary respondents, including key industry participants and subject matter experts, were conducted to obtain and verify critical qualitative and quantitative information and assess the market’s prospects.
Secondary Research
In the secondary research process, various sources were referred to identify and collect information for this study. Secondary sources included annual reports, press releases, and investor presentations of companies; white papers, journals, and certified publications; and articles from recognized authors, directories, and databases. The data was also collected from other secondary sources, such as journals, government websites, blogs, and vendors’ websites. Additionally, the marketing automation spending of various countries was extracted from the respective sources.
Primary Research
In the primary research process, various sources from the supply and demand sides were interviewed to obtain qualitative and quantitative information on the market. The primary sources from the supply side included various industry experts, such as Chief Experience Officers (CXOs), Vice Presidents (VPs), and directors specializing in business development, marketing, and Marketing automation providers. It also included key executives from marketing automation software and service vendors, system integrators (SIs), professional service providers, industry associations, and other key opinion leaders.

Note: Tier 1 companies’ revenues are more than USD 10 billion; tier 2 companies’ revenues
range between USD 1 and 10 billion; and tier 3 companies’ revenues range between USD 500 million and USD 1 billion.
Other designations include sales managers, marketing managers, and product managers.
Source: Industry Experts
To know about the assumptions considered for the study, download the pdf brochure
Market Size Estimation
Multiple approaches were adopted to estimate and forecast the marketing automation market. The first approach involved estimating the market size by companies’ revenue generated through the sale of marketing automation products.
Market Size Estimation Methodology- Top-down approach
In the top-down approach, an exhaustive list of all the vendors offering products in the marketing automation market was prepared. The revenue contribution of the market vendors was estimated through annual reports, press releases, funding, investor presentations, paid databases, and primary interviews. Each vendor’s offerings were evaluated based on platform, degree of customization, type, application, end user, and region. The markets were triangulated through primary and secondary research. The primary procedure included extensive interviews for key insights from industry leaders, such as CIOs, CEOs, VPs, directors, and marketing executives. The market numbers were further triangulated with the existing MarketsandMarkets’ repository for validation.
In the bottom-up approach, the adoption rate of marketing automation products across various verticals in key countries within their respective regions was identified as the main contributor to the market share. Cross-validation revealed the adoption of marketing automation products among enterprises, along with various use cases by region. Weightage was given to use cases identified in different regions for the market size calculation.
Based on the market numbers, the regional split was determined by primary and secondary sources. The procedure included analyzing the marketing automation market’s regional penetration. Based on secondary research, the regional spending on Information and Communications Technology (ICT), socio-economic analysis of each country, strategic vendor analysis of major marketing automation providers, and organic and inorganic business development activities of regional and global players were estimated.
Marketing Automation Market : Top-Down and Bottom-Up Approach

Data Triangulation
After determining the overall market size using the market size estimation processes as explained above, the market was split into several segments and subsegments. Data triangulation and market breakup procedures were employed, wherever applicable, to complete the overall market engineering process and determine the exact statistics of each market segment and subsegment. The overall market size was used in the top-down procedure to estimate the size of other individual markets via percentage splits of the market segmentation.
Market Definition
According to IBM, marketing automation refers to the application of software and technology to systematically manage and optimize routine marketing processes and tasks across diverse channels. This approach enables organizations to efficiently execute marketing activities, segment audiences, and tailor content and experiences throughout the customer journey. Leveraging advancements in artificial intelligence, natural language processing, and machine learning, marketing automation enhances lead generation, improves customer engagement, and drives operational efficiencies. It empowers marketing teams to focus on strategic initiatives while maximizing return on investment through streamlined workflows and data-driven decision-making.
Stakeholders
- Marketing automation providers
- Distributors and value-added resellers (VARs)
- Government agencies
- Independent software vendors (ISV)
- Managed service providers
- Support & maintenance service providers
- System integrators (SIs)
- Technology providers
- Content creators & designers
- Digital marketing managers
Report Objectives
- To define, describe, and forecast the marketing automation market by offering, deployment type, channel integration type, application, end user, and region
- To provide detailed information about major factors (drivers, restraints, opportunities, and industry-specific challenges) influencing market growth
- To analyze opportunities in the market and provide details of the competitive landscape for stakeholders and market leaders
- To forecast the market size of segments for North America, Europe, Asia Pacific, Middle East & Africa, and Latin America
- To profile key players and comprehensively analyze their market rankings and core competencies
- To analyze competitive developments, such as partnerships, new product launches, and mergers & acquisitions, in the marketing automation market
Available Customizations
With the given market data, MarketsandMarkets offers customizations to meet the company’s specific needs. The following customization options are available for the report:
Product Analysis
- The product matrix provides a detailed comparison of each company's product portfolio.
Geographic Analysis as per Feasibility
- Further breakup of the North American marketing automation market
- Further breakup of the European market
- Further breakup of the Asia Pacific market
- Further breakup of the Middle East & Africa market
- Further breakup of the Latin American marketing automation market
Company Information
- Detailed analysis and profiling of additional market players (up to five)
Key Questions Addressed by the Report
What is marketing automation?
According to IBM, marketing automation refers to the application of software and technology to systematically manage and optimize routine marketing processes and tasks across diverse channels. This approach enables organizations to efficiently execute marketing activities, segment audiences, and tailor content and experiences throughout the customer journey. Leveraging advancements in artificial intelligence, natural language processing, and machine learning, marketing automation enhances lead generation, improves customer engagement, and drives operational efficiencies. Ultimately, it empowers marketing teams to focus on strategic initiatives while maximizing return on investment through streamlined workflows and data-driven decision-making.
Which are the key end users adopting marketing automation market solutions and services?
Key end users adopting marketing automation software and services include Media & Entertainment (Gaming & Sports, Broadcasting & Streaming Service Providers, Film & Video Production and Others (Digital Content Publishers & Social Media Platforms), Retail & E-commerce, Advertising & Marketing Agencies, Healthcare & Life Sciences, Education, BFSI, Manufacturing, Travel & Hospitality and Other enterprise users (IT & telecom, transportation & logistics, and real estate & construction) and individual users.
What are the major factors driving the growth of the marketing automation industry?
Key drivers of the marketing automation market include the rising adoption of AI-powered tools that enhance customer engagement through real-time personalization and predictive insights. Businesses increasingly seek personalized marketing strategies to improve targeting and maximize ROI. Additionally, the shift toward omnichannel automation platforms is transforming customer experience by enabling seamless, consistent communication across multiple touchpoints, significantly boosting brand loyalty and campaign effectiveness.
What challenges are hindering the widespread adoption of marketing automation?
Marketing automation faces significant challenges in integrating with business applications such as CRM and CMS, often resulting in data silos and fragmented workflows. Integration gaps and content bottlenecks further restrict the ability to deliver timely, personalized campaigns. These obstacles hinder scalability and campaign effectiveness, emphasizing the need for seamless system interoperability and efficient content management to maximize ROI and operational efficiency.
Who are the key vendors in the marketing automation market?
The key vendors in the global marketing automation market include as HubSpot (US), Adobe (US), Oracle (US), Salesforce (US), Microsoft (US), SAP (Germany), Thryv (US), SAS Institute (US), Klaviyo (US), Intuit (US), Google (US), IBM (US), Zoho (India), Sprinklr (US), Braze (US), SugarCRM (US), CentraHub CRM (India), Mekari (Indonesia), Acoustic (US), RD Station (Brazil), Brevo (France), Pipedrive (US), Creatio (US), Acquia (US), ActiveCampaign (US), LeadSquared (India), Constant Contact (US), BusinessNEXT (India), Sitecore (US), GetResponse (Poland), Inconcert (Spain), Maropost (Canada), ClickDimensions (US), Omnisend (UK), Act-On (US), Edrone (Poland), iContact (US), Ometria (UK), Mindmatrix (US), Drip (US), Kit (US), SimplyCast (Canada), VBOUT (US), Net-Results (US), and GreenRope (US).
Need a Tailored Report?
Customize this report to your needs
Get 10% FREE Customization
Customize This ReportPersonalize This Research
- Triangulate with your Own Data
- Get Data as per your Format and Definition
- Gain a Deeper Dive on a Specific Application, Geography, Customer or Competitor
- Any level of Personalization
Let Us Help You
- What are the Known and Unknown Adjacencies Impacting the Marketing Automation Market
- What will your New Revenue Sources be?
- Who will be your Top Customer; what will make them switch?
- Defend your Market Share or Win Competitors
- Get a Scorecard for Target Partners

Custom Market Research Services
We Will Customise The Research For You, In Case The Report Listed Above Does Not Meet With Your Requirements
Get 10% Free CustomisationTESTIMONIALS
Growth opportunities and latent adjacency in Marketing Automation Market


Daniel
May, 2022
Understanding Marketing Automation Market Share with Geographical Overview .
Abby
Oct, 2017
Interested in the agency perspective on marketing automation and having experts outside of the end users company who can guide them through how to use MA..
Thor
Sep, 2016
Understand the Marketing Automation market in Scandinavia..
Thor
Sep, 2016
Indepth Understanding of the Marketing Automation market in Scandinavia..