This study involved the extensive use of both primary and secondary sources. The research process involved the study of various factors affecting the industry to identify the segmentation types, industry trends, key players, competitive landscape, key market dynamics, and key player strategies.
Secondary Research
This research study involved the use of comprehensive secondary sources; directories and databases such as D&B, Bloomberg Business, and Factiva; and white papers, annual reports, and company house documents. Secondary research was used to identify and collect information for this extensive, technical, market-oriented, and commercial study of the global medical device connectivity market. It was also used to obtain important information about the top players, market classification, and segmentation according to industry trends to the bottom-most level, geographic markets, technology perspectives, and key developments related to the market. A database of the key industry leaders was also prepared using secondary research.
Primary Research
In the primary research process, various sources from both the supply and demand sides were interviewed to obtain qualitative and quantitative information for this report. The primary sources from the supply side include industry experts such as CEOs, vice presidents, marketing and sales directors, technology and innovation directors, and related key executives from various key companies and organizations operating in the medical device connectivity market. The primary sources from the demand side include key executives from hospitals, private health clinics, ambulatory care settings, imaging and diagnostic services, assisted living and long-term care.
A breakdown of the primary respondents is provided below:

*Others include sales managers, marketing managers, and product managers.
Note: Tiers are defined based on a company’s total revenue, as of 2022: Tier 1 = >USD 1 billion, Tier 2 = USD 500 million to USD 1 billion, and Tier 3 = <USD 500 million.
To know about the assumptions considered for the study, download the pdf brochure
|
COMPANY NAME
|
DESIGNATION
|
|
Medtronic
|
Product Manager
|
|
Koninklijke Philips N.V.
|
Chief Technology Officer
|
|
Oracle
|
Vice President of Technology
|
Market Size Estimation
The market size estimates and forecasts provided in this study are derived through a mix of the bottom-up approach (segmental analysis of major segments) and the top-down approach (assessment of utilization/adoption/penetration trends, by product & service, technology, application, end user, and region).
Medical Device Connectivity Market Size: Top Down Approach

To know about the assumptions considered for the study, Request for Free Sample Report
Data Triangulation
After arriving at the market size, the total medical device connectivity market was divided into several segments and subsegments. To complete the overall market engineering process and arrive at the exact statistics for all segments & subsegments, data triangulation, and market breakdown procedures were employed, wherever applicable.
Market Definition
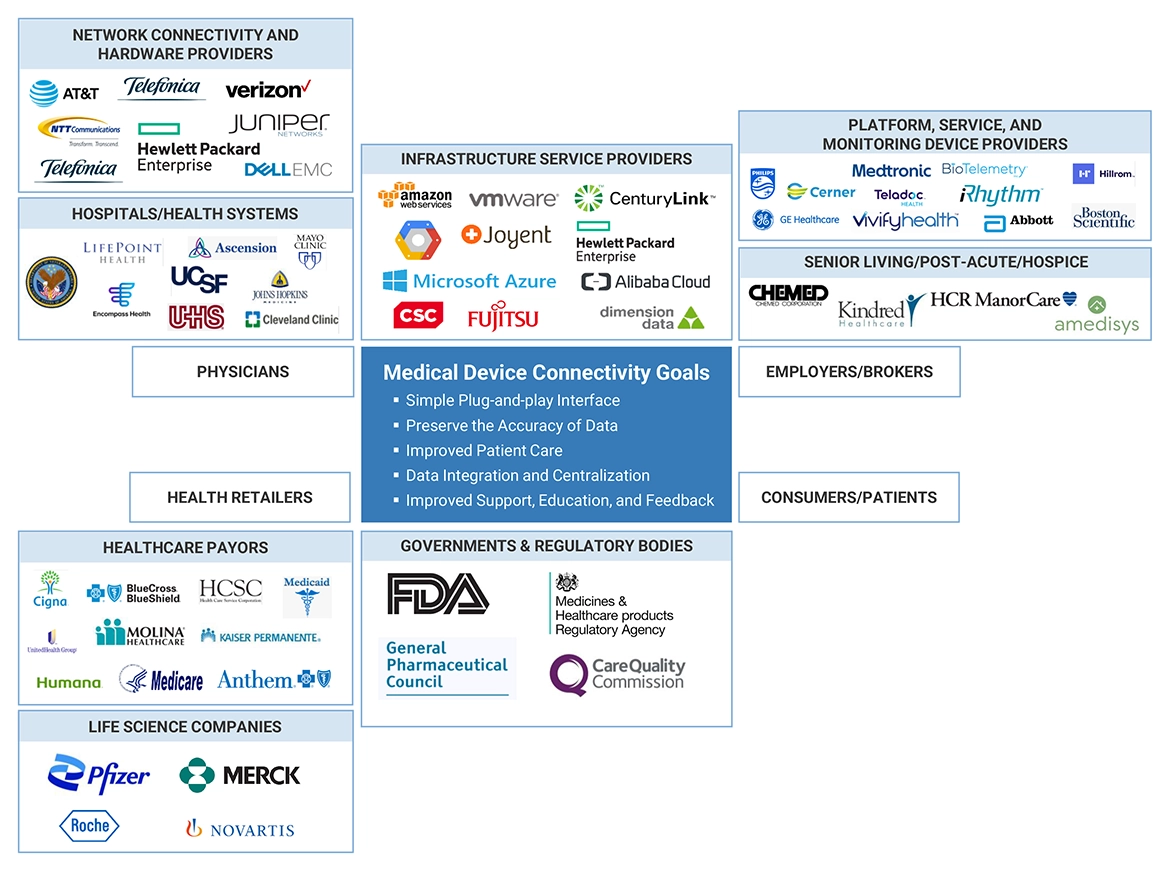
Medical device connectivity solutions provide a framework for the physical interconnections between medical devices through hardware and networking software solutions. These solutions capture data and make it available for use in electronic health records (EHRs) or other clinical applications that build interoperability within the healthcare continuum.
Key Stakeholders
-
Medical device connectivity solutions and service providers
-
Medical device connectivity vendors
-
Hospitals and clinics
-
Wireless device manufacturers
-
Healthcare institutions
-
Healthcare technology suppliers
-
Research institutes
-
Market research and consulting firms
-
Venture capitalists and investors
Objectives of the Study
-
To define, describe, segment, and forecast the medical device connectivity market by product & services, technology, application, end – users and region.
-
To provide detailed information about the factors influencing the market growth (such as drivers, restraints, opportunities, and challenges)
-
To analyze micro markets with respect to individual growth trends, prospects, and contributions to the overall medical device connectivity market
-
To analyze market opportunities for stakeholders and provide details of the competitive landscape for key players
-
To forecast the size of the market device connectivity market in five main regions (along with their respective key countries), namely, North America, Europe, the Asia Pacific, Latin America, and the Middle East & Africa
-
To profile the key players in the medical device connectivity market and comprehensively analyze their core competencies and market shares
-
To track and analyze competitive developments such as acquisitions, product launches, expansions, collaborations, agreements, partnerships, and R&D activities of the leading players in the medical device connectivity market
-
To benchmark players within the medical device connectivity market using the Competitive Leadership Mapping framework, which analyzes market players on various parameters within the broad categories of business strategy, market share, and product offering
Available Customizations
With the given market data, MarketsandMarkets offers customizations as per your company’s specific needs. The following customization options are available for the report:
Company Information
-
Detailed analysis and profiling of additional market players (up to 10)
Geographic Analysis
-
Further breakdown of the Latin American medical device connectivity market into Brazil, Mexico, Argentina and others
-
Further breakdown of the Rest of Asia Pacific medical device connectivity market into South Korea, Australia, and others


Growth opportunities and latent adjacency in Medical Device Connectivity Market