Neuromorphic Computing Market by Offering, Deployment, Application (Image Recognition, Signal Recognition, Data Mining), Vertical (Aerospace, Military, & Defense, Automotive, Medical) and Geography - Global Forecast to 2026
Updated on : March 06, 2023
The Neuromorphic Computing Market size is projected to reach USD 550,593 thousand by 2026, growing at a CAGR of 89.1% during the forecase period.
The need for better performing ICs, increase in demand for artificial intelligence and machine learning, and increasing number of cross-industry partnerships and collaborations are key factors driving the growth of the market. Artificial Intelligence (AI) is being adopted by various organizations across key industry verticals such as automotive, aerospace and defense, consumer electronics, healthcare, and piping.
AI and machine learning used in tandem revolutionizing several industry sector from the period of last 5 years. However, several factors, such as lack of knowledge about neuromorphic computing and complex algorithms increasing complexity of designing hardware of neuromorphic chips are hindering the growth of neuromorphic computing market. Moreover, matching a human’s flexibility and ability to learn from unstructured stimuli data can act as a key challenge in the market during the forecast period.
Global Neuromorphic Computing Market Trends
To know about the assumptions considered for the study, Request for Free Sample Report
Neuromorphic Computing Market Dynamics
Drivers : New ways of computation possible due to end of Moore’s law
Moore’s law states that the number of transistors per square inch on integrated circuits will double about every eighteen months until at least 2020. In April 2015, Intel stated that it could keep Moore’s law going for another 10 years by developing 7nm and 5nm fabrication technologies. This indicates that beyond 2023 or 2025, the size of an IC cannot be shrunk with transistor count also doubling, as this would result in reduced space between electron and holes, and lead to problems such as current leakage and overheating in ICs.
These problems would lead to slower performance, high power consumption by ICs, and reduced durability. Thus, the need for finding an alternate way to increase the computational power of chips has fueled the development of neuromorphic chips. Biologically inspired models of neuromorphic chips would further offer computational solutions to the electronics industry.
Cross-industry partnerships and collaborations
AI in healthcare market, as several companies, including Graphen (New York, US), Alibaba (China), and Google DeepMind (UK), have started developing AI tools to help detect and diagnose the virus. These tools can also track the geographical footprint of the virus and project its future and ribonucleic acid (RNA) sequence to find a vaccine for it. Major industry players, organizations, and healthcare & life science researchers have also come together to find solutions and prepare the way for AI tools to take a larger role in patient care.
Restraints : Lack of R&D investments is slowing down deployment of real world applications.
Neuromorphic computing was first discovered in the late 1980s; it has been developing at a low rate since then. Extensive R&D for the development of software and hardware is required to manufacture neuromorphic computers. However, existing technologies have put several limitations on the development of hardware and software. Algorithms can only be written for specific hardware. Any new architecture in hardware makes the existing algorithms void. Moreover, scientists are exploring multiple types of neural hardware architecture, such as spin-based, phase-change, and memristor. Each type of development requires specific algorithms to run programs.
Due to these limitations, neuromorphic computing has been developing at a very slow speed over the last four decades. Basic issues such as hardware and software compatibility for large-scale neuromorphic hardware are yet to be resolved by scientists. Hence, to ensure continuity of interest in research initiatives, it is essential to develop and market small-scale neuromorphic chips for immediate market applications such as image processing and speech processing to gain interest and investments from research organizations and business entities.
Software segment is expected to record the highest CAGR during the forecast period.
The software segment for neuromorphic computing market is expected to grow at the highest rate during the forecast period. The neuromorphic computing software is used in a spectrum of applications such as real-time data streaming, data modelling & prediction analysis, continuous e-learning etc. Also, with the deployment of neuromorphic computing capabilities available on cloud several companies across key industry verticals are rapidly adopting the use of neuromorphic computing
Aerospace, Military & Defense segment to account for largest share of market.
High speed computation is a crticial requirement in aerospace, military and defense sectors due to sensitivity of data being handled. Neuromorphic computing can handle processing of data faster than any processor currently available in the market. In battlefield, whether or ground or in air, neuromorphic computing helps in processing enemy movement data and develop simulations based on the data processed. It also helps in accessing capabilities of weapons and other critical equipment being used, giving a better insights about the on-ground situation. Neuromorphic computing is also more secure in transmitting and receiving data due to use of superior encryption algorithms. Hence, the aerospace, military and defense segment is expected to hold largest market share during forecast period.
APAC to witness the highest growth in neuromorphic computing market during the forecast period.
APAC region is mix of developed economies such China, South Korea, and Japan as well as developing economies such as India, Vietnam, Bangladesh etc. The market in China, Japan, and South Korea will contribute a significant market share in the APAC region. Increasing adoption of AI and machine learning technologies in countries across the region, as well as development and expansion of data centers across several cities in the region will propel the growth of the market. In densely populated countries such as China and India, there is a rapid penetration of wearables among youth population living in the urban areas. This is also expected to boost the growth of market in this region.
To know about the assumptions considered for the study, download the pdf brochure
Key Market Players
The neuromorphic computing market was dominated by, Intel Corporation (US), IBM Corporation (US), BrainChip Holdings Ltd. (US), Qualcomm Technologies, Inc. (US) and HP Enterprise (US).
IBM (US) inside:
IBM is one of the leading players in market in 2020. IBM is an information technology giant. It provides integrated solutions that leverage information technology and knowledge of business processes. In 2011, IBM (US) unveiled TrueNorth, a custom-made, brain-like chip that builds on a simpler experimental system. TrueNorth is equipped with 4,096 processor cores, and it replicates 1 million human neurons and 256 million synapses—two of the fundamental biological building blocks that make up the human brain. It is the largest chip IBM has ever built, having 5.4 billion transistors and an on-chip network of 4,096 neurosynaptic cores.
Neuromorphic Computing Market Report Scope
Report Metric |
Details |
Estimated Market Size | USD 22,743 Thousand |
Projected Market Size | USD 550,593 Thousand |
Growth Rate | CAGR of 89.1% |
Market size available for years |
2021–2026 |
On Demand Data Available |
2030 |
Report Coverage |
|
Segments covered |
|
Geographies covered |
|
Companies covered |
|
Key Market Driver | New Ways Of Computation |
Largest Growing Region | Asia Pacific (APAC) |
Largest Market Share Segment | Hardware Segment |
Highest CAGR Segment | Software Segment |
This report categorizes the neuromorphic computing market based on offering, deployment, application, vertical and region
Based on Offering, the Neuromorphic Computing Market been Segmented as follows:
-
Hardware
- Processor
- Memory
- Software
Based on Deployment, the Neuromorphic Computing Market been Segmented as follows:
- Edge Computing
- Cloud Computing
Based on Application, the Neuromorphic Computing Market been Segmented as follows:
- Image Recognition
- Signal Recognition
- Data Mining
Based on Vertical, the Neuromorphic Computing Market been Segmented as follows:
- Aerospace, Military, & Defense
- Automotive
- Consumer Electronics
- Industrial
- Medical
- IT & Telecommunication
- Others (Smart Infrastructure & Education)
Based on Geographic Analysis, the Neuromorphic Computing Market been Segmented as follows:
- Introduction
-
North America
- US
- Canada
- Mexico
-
Europe
- Germany
- UK
- France
- Italy
- Spain
- Rest of Europe (RoE)
-
Asia Pacific (APAC)
- China
- Japan
- South Korea
- India
- Rest of APAC (RoAPAC)
-
Rest of the World (RoW)
- South America
- Middle East & Africa
Recent Developments
- In January 2023, IBM launched an energy-efficient AI chip built with 7nm technology. The AI hardware accelerator chip supports a variety of model types while achieving leading-edge power efficiency. The chip technology can be scaled and used for commercial applications to train large-scale models in the cloud to security and privacy efforts by bringing training closer to the edge and data closer to the source.
- In October 2022, Intel announced a three-year agreement with Sandia National Laboratories (Sandia), US, to explore the value of neuromorphic computing for scaled-up computational problems. This agreement includes continued large-scale neuromorphic research on Intel’s upcoming next-generation neuromorphic architecture and the delivery of Intel’s largest neuromorphic research system to date, which could exceed more than 1 billion neurons in computational capacity.
Frequently Asked Questions (FAQ):
What is the current market size of the neuromorphic computing market ?
The size of the neuromorphic computing market is anticipated to increase from $22,743 thousand in 2021 to $550,593 thousand by 2026, growing at a CAGR of 89.1%.
What are the future growth prospects of the neuromorphic computing market ?
The future growth prospects of the neuromorphic computing market are promising, with increasing demand from industries such as healthcare, finance, and cybersecurity.
Who are the key players in the neuromorphic computing market ?
Key players in the microwave devices market include Intel Corp., IBM Corporation, BrainChip Holdings Ltd., Qualcomm and HP Enterprise.
What are the applications of neuromorphic computing ?
Applications of neuromorphic computing include image and speech recognition, autonomous systems, and smart sensors.
How does neuromorphic computing differ from traditional computing ?
Neuromorphic computing differs from traditional computing in its focus on low power consumption, high parallelism, and real-time processing of sensory information. It also uses different architectures and algorithms compared to traditional computing.
To speak to our analyst for a discussion on the above findings, click Speak to Analyst
TABLE OF CONTENTS
1 INTRODUCTION (Page No. - 27)
1.1 STUDY OBJECTIVES
1.2 MARKET DEFINITION
1.2.1 INCLUSIONS AND EXCLUSIONS
1.3 STUDY SCOPE
1.3.1 MARKETS COVERED
FIGURE 1 NEUROMORPHIC COMPUTING MARKET
1.3.2 GEOGRAPHIC SCOPE
1.3.3 YEARS CONSIDERED
1.4 CURRENCY
1.5 VOLUME UNIT
1.6 LIMITATIONS
1.7 STAKEHOLDERS
1.8 SUMMARY OF CHANGES
2 RESEARCH METHODOLOGY (Page No. - 32)
2.1 RESEARCH DATA
FIGURE 2 MARKET: RESEARCH DESIGN
2.1.1 SECONDARY DATA
2.1.1.1 Major secondary sources
2.1.1.2 Key data from secondary sources
2.1.2 PRIMARY DATA
2.1.2.1 Primary interviews with experts
2.1.2.2 Key data from primary sources
2.1.2.3 Key industry insights
2.1.2.4 Breakdown of primaries
2.1.3 SECONDARY AND PRIMARY RESEARCH
2.2 MARKET SIZE ESTIMATION
FIGURE 3 RESEARCH FLOW OF MARKET SIZE ESTIMATION
2.2.1 BOTTOM-UP APPROACH
FIGURE 4 MARKET SIZE ESTIMATION METHODOLOGY (SUPPLY SIDE): REVENUE FROM SALES OF NEUROMORPHIC COMPUTING PRODUCTS AND SOLUTIONS
FIGURE 5 MARKET SIZE ESTIMATION METHODOLOGY: BOTTOM-UP APPROACH
2.2.2 TOP-DOWN APPROACH
FIGURE 6 MARKET SIZE ESTIMATION METHODOLOGY: TOP-DOWN APPROACH
2.3 MARKET BREAKDOWN AND DATA TRIANGULATION
FIGURE 7 DATA TRIANGULATION
2.4 RESEARCH ASSUMPTIONS
2.5 RISK ASSESSMENT
TABLE 1 RISK FACTOR ANALYSIS
2.6 FORECASTING ASSUMPTIONS
2.7 COMPETITIVE LEADERSHIP MAPPING METHODOLOGY
TABLE 2 EVALUATION CRITERIA
2.7.1 VENDOR INCLUSION CRITERIA
2.8 LIMITATIONS OF THE STUDY
3 EXECUTIVE SUMMARY (Page No. - 46)
FIGURE 8 HARDWARE OFFERING SEGMENT TO LEAD NEUROMORPHIC COMPUTING MARKET DURING 2021–2026
FIGURE 9 IMAGE RECOGNITION APPLICATION IS EXPECTED TO HOLD LARGEST SHARE OF MARKET DURING 2021–2026
FIGURE 10 AEROSPACE, MILITARY & DEFENSE VERTICAL TO HOLD LARGEST OF MARKET DURING FORECAST PERIOD
FIGURE 11 EDGE COMPUTING TO LEAD MARKET, BY DEPLOYMENT, DURING FORECAST PERIOD
FIGURE 12 MARKET IN ASIA PACIFIC TO REGISTER HIGHEST CAGR DURING FORECAST PERIOD
3.1 IMPACT ANALYSIS OF COVID-19 ON MARKET
FIGURE 13 MARKET SIZE IN OPTIMISTIC, PESSIMISTIC, AND REALISTIC SCENARIOS
TABLE 3 NEUROMORPHIC MARKET, BY SCENARIO, 2018–2026 (USD THOUSAND)
3.1.1 OPTIMISTIC SCENARIO
3.1.2 REALISTIC SCENARIO
3.1.3 PESSIMISTIC SCENARIO
4 PREMIUM INSIGHTS (Page No. - 53)
4.1 ATTRACTIVE OPPORTUNITIES IN MARKET
FIGURE 14 MARKET TO WITNESS SIGNIFICANT GROWTH BETWEEN 2021 AND 2026
4.2 MARKET, BY OFFERING
FIGURE 15 HARDWARE IS EXPECTED TO DOMINATE MARKET BETWEEN 2021 AND 2026
4.3 MARKET, BY APPLICATION
FIGURE 16 IMAGE RECOGNITION EXPECTED TO HOLD LARGEST SHARE OF MARKET BY 2026
4.4 NEUROMORPHIC COMPUTING MARKET, BY INDUSTRY
FIGURE 17 AEROSPACE, MILITARY & DEFENSE TO HOLD LARGEST SHARE OF MARKET BY 2026
4.5 MARKET, BY REGION (2021)
FIGURE 18 NORTH AMERICA IS LIKELY TO HOLD LARGEST SHARE OF MARKET BETWEEN 2021 AND 2026
5 MARKET OVERVIEW (Page No. - 56)
5.1 INTRODUCTION
5.2 EVOLUTION
FIGURE 19 ARCHITECTURAL DIFFERENCE: VON NEUMANN VS. NEURAL NETWORK
FIGURE 20 BIOLOGICAL INSPIRATION OF NEUROMORPHIC DESIGN BY CARVER MEAD IN 1990
5.3 MARKET DYNAMICS
FIGURE 21 NEUROMORPHIC COMPUTING: MARKET DYNAMICS
5.3.1 DRIVERS
5.3.1.1 New ways of computation possible due to end of Moore’s Law
FIGURE 22 COST PER TRANSISTOR FOR A SINGLE IC CHIP HAS INCREASED AFTER LAUNCH OF 28NM SEMICONDUCTOR DEVICE FABRICATION TECHNOLOGY
5.3.1.2 Need for better-performing ICs
5.3.1.3 Increase in demand for artificial intelligence and machine learning
FIGURE 23 MACHINE-TO-MACHINE CONNECTIONS MARKET, 2014–2026
FIGURE 24 ARTIFICIAL INTELLIGENCE MARKET, 2014–2026 (USD MILLION)
5.3.1.4 Cross-industry partnerships and collaborations
5.3.2 RESTRAINTS
5.3.2.1 Lack of R&D and investments is slowing down development of real-world applications
5.3.2.2 Complex algorithms increase complexity of designing hardware of neuromorphic chips
5.3.2.3 Lack of knowledge about neuromorphic computing
5.3.3 OPPORTUNITIES
5.3.3.1 Emerging applications pertaining to automation
FIGURE 25 MACHINE LEARNING MARKET, 2014–2026 (USD MILLION)
5.3.3.2 Adoption of neuromorphic computing for security purposes
5.3.3.3 Growing potential of AI and neuromorphic computing in medical science and medical imaging
5.3.4 CHALLENGES
5.3.4.1 Applications dependent on software compatibility of neural hardware
TABLE 4 SOFTWARE COMPARISON: CONVENTIONAL VS NEUROMORPHIC CHIPS
5.3.4.2 Matching a human’s flexibility and ability to learn from unstructured stimuli data
5.4 VALUE CHAIN ANALYSIS
FIGURE 26 DESIGN AND FABRICATION, TESTING, AND PACKAGING PHASES CONTRIBUTE MAJOR VALUE TO NEUROMORPHIC COMPUTING MARKET
5.4.1 CORE INDUSTRY SEGMENTS
5.4.1.1 Research and product development
5.4.1.2 Design
5.4.1.3 Fabrication, packaging, and testing
5.4.1.4 Manufacturing and assembly
5.4.1.5 Marketing and sales
5.4.1.6 End users
5.5 PORTER’S FIVE FORCES ANALYSIS OF MARKET, 2021
FIGURE 27 OVERVIEW OF PORTER’S FIVE FORCES ANALYSIS FOR MARKET (2021)
FIGURE 28 MARKET: PORTER’S FIVE FORCES ANALYSIS
TABLE 5 IMPACT OF PORTER’S FIVE FORCE ON MARKET
5.5.1 BARGAINING POWER OF SUPPLIERS
FIGURE 29 MEDIUM IMPACT OF BARGAINING POWER OF SUPPLIERS ON MARKET
5.5.2 BARGAINING POWER OF BUYERS
FIGURE 30 LOW IMPACT OF BARGAINING POWER OF BUYERS ON MARKET
5.5.3 THREAT OF SUBSTITUTES
FIGURE 31 MEDIUM IMPACT OF THREAT OF SUBSTITUTES ON MARKET
5.5.4 THREAT OF NEW ENTRANTS
FIGURE 32 LOW IMPACT OF THREAT OF NEW ENTRANTS ON NEUROMORPHIC COMPUTING MARKET
5.5.5 DEGREE OF COMPETITION
FIGURE 33 HIGH IMPACT OF DEGREE OF COMPETITION ON MARKET
5.6 MARKET ECOSYSTEM
TABLE 6 MARKET ECOSYSTEM
FIGURE 34 MARKET ECOSYSTEM
5.7 USE CASE ANALYSIS
5.7.1 INTEL’S POHOIKI’S SPRINGS SYSTEM SHOWED HOW A NEUROMORPHIC CHIP CAN PICK OUT SMELLS WITH A SMALL TRAINING SAMPLE
5.7.2 IBM LAUNCHED TRUENORTH SYNAPSE NEUROMORPHIC INTEGRATED CHIP HAVING 256 PROGRAMMABLE NEURONS
5.7.3 BRAINCHIP INC DEVELOPED A HARDWARE VERSION OF BIOLOGICAL NEURON
5.7.4 APPLIED BRAIN RESEARCH STUDIED ENERGY-EFFICIENCY OF NENGO DEEP LEARNING TOOLKIT
5.7.5 NEUROMORPHIC TECHNOLOGY USED TO MAKE EFFICIENT ARTIFICIAL INTELLIGENCE ONBOARD FOR SELF-DRIVING AND SELF-PARKING IN AUTOMOBILES
5.8 INDUSTRY TRENDS
FIGURE 35 EMERGING TRENDS IN MARKET
5.9 PRICING ANALYSIS
FIGURE 36 AVERAGE SELLING PRICE OF NEUROMORPHIC CHIPS
5.10 PATENTS ANALYSIS
TABLE 7 IMPORTANT PATENTS RELATED TO NEUROMORPHIC COMPUTING SOLUTIONS
5.11 TRADE ANALYSIS
TABLE 8 EXPORTS DATA, BY COUNTRY, 2015–2019 (USD MILLION)
FIGURE 37 EXPORTS DATA FOR HS CODE 854231 FOR TOP FIVE COUNTRIES IN MARKET, 2015–2019 (THOUSAND UNITS)
TABLE 9 IMPORTS DATA, BY COUNTRY, 2015–2019 (USD MILLION)
FIGURE 38 IMPORTS DATA FOR HS CODE 854231 FOR TOP FIVE COUNTRIES IN MARKET, 2015–2019 (THOUSAND UNITS)
6 NEUROMORPHIC COMPUTING MARKET, BY OFFERING (Page No. - 83)
6.1 INTRODUCTION
FIGURE 39 MARKET, BY OFFERING
FIGURE 40 NEUROMORPHIC COMPUTING HARDWARE MARKET TO GROW AT A HIGHER RATE BETWEEN 2021 AND 2026
TABLE 10 MARKET, BY OFFERING, 2018–2020 (USD THOUSAND)
TABLE 11 MARKET, BY OFFERING, 2021–2026 (USD THOUSAND)
6.2 HARDWARE
6.2.1 HIGH PARALLEL PROCESSING CAPABILITIES AND IMPROVED COMPUTING POWER HAVE RESULTED IN ADOPTION OF PROCESSORS
FIGURE 41 NEUROMORPHIC COMPUTING HARDWARE CHIP MARKET, 2018–2026 (THOUSAND UNITS)
TABLE 12 NEUROMORPHIC COMPUTING HARDWARE CHIP MARKET, 2018–2020 (THOUSAND UNITS)
TABLE 13 NEUROMORPHIC COMPUTING HARDWARE CHIP MARKET, 2021–2026 (THOUSAND UNITS)
6.3 SOFTWARE
6.3.1 SOFTWARE ARE TIME-BASED LEARNING ALGORITHMS THAT COMPLEMENT NEUROMORPHIC CHIPS BY STORING AND RECALLING SPATIAL AND TEMPORAL PATTERNS.
7 MARKET, BY DEPLOYMENT (Page No. - 88)
7.1 INTRODUCTION
FIGURE 42 MARKET, BY DEPLOYMENT
FIGURE 43 EDGE COMPUTING SEGMENT TO ACCOUNT FOR LARGER MARKET SHARE BY 2026
TABLE 14 MARKET, BY DEPLOYMENT, 2018–2020 (USD THOUSAND)
TABLE 15 MARKET, BY DEPLOYMENT, 2021–2026 (USD THOUSAND)
7.2 EDGE COMPUTING
7.2.1 NEUROMORPHIC DEPLOYMENT AT EDGE IS BEST SUITED FOR LOW-POWER AND LOW-LATENCY APPLICATIONS, AND ON-DEVICE ADAPTATION
7.3 CLOUD COMPUTING
7.3.1 CLOUD COMPUTING INVOLVES DECENTRALIZED APPLICATIONS RUNNING IN DATA CENTERS
8 NEUROMORPHIC COMPUTING MARKET, BY APPLICATION (Page No. - 92)
8.1 INTRODUCTION
FIGURE 44 MARKET, BY APPLICATION
FIGURE 45 MARKET FOR DATA MINING APPLICATION TO GROW AT HIGHEST CAGR BETWEEN 2021 AND 2026
TABLE 16 MARKET, BY APPLICATION, 2018–2020 (USD THOUSAND)
TABLE 17 MARKET, BY APPLICATION, 2021–2026 (USD THOUSAND)
8.2 IMAGE RECOGNITION
TABLE 18 MARKET FOR IMAGE RECOGNITION, BY APPLICATION TYPE, 2018–2020 (USD THOUSAND)
TABLE 19 MARKET FOR IMAGE RECOGNITION, BY APPLICATION TYPE, 2021–2026 (USD THOUSAND)
TABLE 20 MARKET FOR IMAGE RECOGNITION, BY OFFERING, 2018–2020 (USD THOUSAND)
TABLE 21 MARKET FOR IMAGE RECOGNITION, BY OFFERING, 2021–2026 (USD THOUSAND)
TABLE 22 MARKET FOR IMAGE RECOGNITION, BY INDUSTRY, 2018–2020 (USD THOUSAND)
TABLE 23 MARKET FOR IMAGE RECOGNITION, BY INDUSTRY, 2021–2026 (USD THOUSAND)
8.3 SIGNAL RECOGNITION
TABLE 24 MARKET FOR SIGNAL RECOGNITION, BY APPLICATION TYPE, 2018–2020 (USD THOUSAND)
TABLE 25 MARKET FOR SIGNAL RECOGNITION, BY APPLICATION TYPE, 2021–2026 (USD THOUSAND)
TABLE 26 MARKET FOR SIGNAL RECOGNITION, BY OFFERING, 2018–2020 (USD THOUSAND)
TABLE 27 MARKET FOR SIGNAL RECOGNITION, BY OFFERING, 2021–2026 (USD THOUSAND)
TABLE 28 MARKET FOR SIGNAL RECOGNITION, BY INDUSTRY, 2018–2020 (USD THOUSAND)
TABLE 29 MARKET FOR SIGNAL RECOGNITION, BY INDUSTRY, 2021–2026 (USD THOUSAND)
8.4 DATA MINING
TABLE 30 MARKET FOR DATA MINING, BY APPLICATION TYPE, 2018–2020 (USD THOUSAND)
TABLE 31 MARKET FOR DATA MINING, BY APPLICATION TYPE, 2021–2026 (USD THOUSAND)
TABLE 32 MARKET FOR DATA MINING, BY OFFERING, 2018–2020 (USD THOUSAND)
TABLE 33 MARKET FOR DATA MINING, BY OFFERING, 2021–2026 (USD THOUSAND)
TABLE 34 MARKET FOR DATA MINING, BY INDUSTRY, 2018–2020 (USD THOUSAND)
TABLE 35 MARKET FOR DATA MINING, BY INDUSTRY, 2021–2026 (USD THOUSAND)
9 NEUROMORPHIC COMPUTING MARKET, BY VERTICAL (Page No. - 104)
9.1 INTRODUCTION
FIGURE 46 MARKET, BY VERTICAL
FIGURE 47 AEROSPACE, MILITARY & DEFENSE VERTICAL TO HOLD LARGEST SHARE OF MARKET BETWEEN 2021 AND 2026
TABLE 36 MARKET, BY VERTICAL, 2018–2020 (USD THOUSAND)
TABLE 37 MARKET, BY VERTICAL, 2021–2026 (USD THOUSAND)
9.2 AEROSPACE, MILITARY & DEFENSE
9.2.1 GROWING USE OF NEUROMORPHIC CHIPS IN PROCESSING OF BATTLEFIELD DATA TO DRIVE GROWTH OF MARKET
TABLE 38 MARKET FOR AEROSPACE MILITARY & DEFENSE VERTICAL, BY APPLICATION, 2018–2020 (USD THOUSAND)
TABLE 39 MARKET FOR AEROSPACE, MILITARY & DEFENSE VERTICAL, BY APPLICATION, 2021–2026 (USD THOUSAND)
TABLE 40 MARKET FOR AEROSPACE, MILITARY & DEFENSE VERTICAL, BY REGION, 2018–2020 (USD THOUSAND)
TABLE 41 MARKET FOR AEROSPACE, MILITARY & DEFENSE VERTICAL, BY REGION, 2021–2026 (USD THOUSAND)
9.3 AUTOMOTIVE
9.3.1 AUTOMATED DRIVING USING AI IS TRENDING IN AUTOMOTIVE VERTICAL
9.3.1.1 Advanced driver assistance system (ADAS)
9.3.1.2 Autonomous vehicle
TABLE 42 MARKET FOR AUTOMOTIVE VERTICAL, BY APPLICATION, 2018–2020 (USD THOUSAND)
TABLE 43 MARKET FOR AUTOMOTIVE VERTICAL, BY APPLICATION, 2021–2026 (USD THOUSAND)
TABLE 44 MARKET FOR AUTOMOTIVE VERTICAL, BY REGION, 2018–2020 (USD THOUSAND)
TABLE 45 MARKET FOR AUTOMOTIVE VERTICAL, BY REGION, 2021–2026 (USD THOUSAND)
9.4 CONSUMER ELECTRONICS
9.4.1 REAL-TIME APPLICATIONS IN CONSUMER DRONES AND SMART HOMES ARE DRIVING GROWTH OF MARKET FOR CONSUMER ELECTRONICS VERTICAL
9.4.1.1 Consumer drones and smart homes
TABLE 46 MARKET FOR CONSUMER ELECTRONICS VERTICAL, BY APPLICATION, 2018–2020 (USD THOUSAND)
TABLE 47 MARKET FOR CONSUMER ELECTRONICS VERTICAL, BY APPLICATION, 2021–2026 (USD THOUSAND)
TABLE 48 MARKET FOR CONSUMER ELECTRONICS VERTICAL, BY REGION, 2018–2020 (USD THOUSAND)
TABLE 49 MARKET FOR CONSUMER ELECTRONICS VERTICAL, BY REGION, 2021–2026 (USD THOUSAND)
9.5 INDUSTRIAL
9.5.1 BENEFITS ASSOCIATED WITH NEUROMORPHIC COMPUTING IN DESIGNING AND PLANNING STAGES OF MANUFACTURING PROCESSES TO BOOST MARKET GROWTH
9.5.1.1 Machine vision
9.5.1.2 Manufacturing
TABLE 50 MARKET FOR INDUSTRIAL VERTICAL, BY APPLICATION, 2018–2020 (USD THOUSAND)
TABLE 51 NEUROMORPHIC COMPUTING MARKET FOR INDUSTRIAL VERTICAL, BY APPLICATION, 2021–2026 (USD THOUSAND)
TABLE 52 MARKET FOR INDUSTRIAL VERTICAL, BY REGION, 2018–2020 (USD THOUSAND)
TABLE 53 MARKET FOR INDUSTRIAL VERTICAL, BY REGION, 2021–2026 (USD THOUSAND)
9.6 MEDICAL
9.6.1 INCREASING PATIENT DATA IS FUELING ADOPTION RATE OF NEUROMORPHIC COMPUTING IN MEDICAL VERTICAL
9.6.1.1 Diagnostic imaging
9.6.1.2 Physical simulation and computation biology
TABLE 54 MARKET FOR MEDICAL VERTICAL, BY APPLICATION, 2018–2020 (USD THOUSAND)
TABLE 55 MARKET FOR MEDICAL VERTICAL, BY APPLICATION, 2021–2026 (USD THOUSAND)
TABLE 56 MARKET FOR MEDICAL VERTICAL, BY REGION, 2018–2020 (USD THOUSAND)
TABLE 57 MARKET FOR MEDICAL VERTICAL, BY REGION, 2021–2026 (USD THOUSAND)
9.7 IT & TELECOMMUNICATION
9.7.1 GROWING USE OF NEUROMORPHIC COMPUTING IN APPLICATIONS SUCH AS IMAGE RECOGNITION, DATA MINING, AND DATA ANALYTICS TO DRIVE GROWTH OF IT & TELECOMMUNICATION VERTICAL
9.7.1.1 Enterprise content management
9.7.1.2 Intelligent character recognition
TABLE 58 MARKET FOR IT & TELECOMMUNICATION VERTICAL, BY APPLICATION, 2018–2020 (USD THOUSAND)
TABLE 59 MARKET FOR IT & TELECOMMUNICATION VERTICAL, BY APPLICATION, 2021–2026 (USD THOUSAND)
TABLE 60 MARKET FOR IT & TELECOMMUNICATION VERTICAL, BY REGION, 2018–2020 (USD THOUSAND)
TABLE 61 MARKET FOR IT & TELECOMMUNICATION VERTICAL, BY REGION, 2021–2026 (USD THOUSAND)
9.8 OTHERS
TABLE 62 MARKET FOR OTHERS VERTICAL, BY APPLICATION, 2018–2020 (USD THOUSAND)
TABLE 63 MARKET FOR OTHERS VERTICAL, BY APPLICATION, 2021–2026 (USD THOUSAND)
TABLE 64 MARKET FOR OTHERS VERTICAL, BY REGION, 2018–2020 (USD THOUSAND)
TABLE 65 MARKET FOR OTHERS VERTICAL, BY REGION, 2021–2026 (USD THOUSAND)
10 GEOGRAPHIC ANALYSIS (Page No. - 121)
10.1 INTRODUCTION
FIGURE 48 GEOGRAPHIC SNAPSHOT: INDIA, CHINA, CANADA, MEXICO, AND FRANCE TO WITNESS HIGHEST GROWTH FROM 2021 TO 2026
FIGURE 49 MARKET IN APAC TO GROW AT HIGHEST CAGR FROM 2020 TO 2026
TABLE 66 MARKET, BY REGION, 2018–2020 (USD THOUSAND)
TABLE 67 MARKET, BY REGION, 2021–2026 (USD THOUSAND)
10.2 NORTH AMERICA
FIGURE 50 SNAPSHOT OF NEUROMORPHIC COMPUTING MARKET IN NORTH AMERICA
TABLE 68 MARKET IN NORTH AMERICA, BY COUNTRY, 2018–2020 (USD THOUSAND)
TABLE 69 MARKET IN NORTH AMERICA, BY COUNTRY, 2021–2026 (USD THOUSAND)
TABLE 70 MARKET IN NORTH AMERICA, BY VERTICAL, 2018–2020 (USD THOUSAND)
TABLE 71 MARKET IN NORTH AMERICA, BY VERTICAL, 2021–2026 (USD THOUSAND)
10.2.1 US
10.2.1.1 US leads in terms of adoption of neuromorphic computing in various end-user industries
TABLE 72 MARKET IN US, BY VERTICAL, 2018–2020 (USD THOUSAND)
TABLE 73 MARKET IN US, BY VERTICAL, 2021–2026 (USD THOUSAND)
10.2.2 CANADA
10.2.2.1 Government funding and extensive startup activities, especially in AI, are supporting growth of AI in Canada
TABLE 74 MARKET IN CANADA, BY VERTICAL, 2018–2020 (USD THOUSAND)
TABLE 75 MARKET IN CANADA, BY VERTICAL, 2021–2026 (USD THOUSAND)
10.2.3 MEXICO
10.2.3.1 Increase in productivity and reduction in cost are leading to adoption of neuromorphic computing in various end-use industries in Mexico
TABLE 76 MARKET IN MEXICO, BY VERTICAL, 2018–2020 (USD THOUSAND)
TABLE 77 MARKET IN MEXICO, BY VERTICAL, 2021–2026 (USD THOUSAND)
10.3 EUROPE
FIGURE 51 SNAPSHOT OF MARKET IN EUROPE
TABLE 78 MARKET IN EUROPE, BY COUNTRY, 2018–2020 (USD THOUSAND)
TABLE 79 MARKET IN EUROPE, BY COUNTRY, 2021–2026 (USD THOUSAND)
TABLE 80 MARKET IN EUROPE, BY VERTICAL, 2018–2020 (USD THOUSAND)
TABLE 81 MARKET IN EUROPE, BY VERTICAL, 2021–2026 (USD THOUSAND)
10.3.1 GERMANY
10.3.1.1 Medical and automotive industries are attractive markets for neuromorphic computing in Germany
TABLE 82 MARKET IN GERMANY, BY VERTICAL, 2018–2020 (USD THOUSAND)
TABLE 83 EUROMORPHIC COMPUTING MARKET IN GERMANY, BY VERTICAL, 2021–2026 (USD THOUSAND)
10.3.2 UK
10.3.2.1 Aerospace, military & defense, IT & telecom, and automotive are major verticals for neuromorphic computing in UK
TABLE 84 MARKET IN UK, BY VERTICAL, 2018–2020 (USD THOUSAND)
TABLE 85 MARKET IN UK, BY VERTICAL, 2021–2026 (USD THOUSAND)
10.3.3 FRANCE
10.3.3.1 Increasing funding and rising number of AI startups are expected to boost penetration of AI in France
TABLE 86 MARKET IN FRANCE, BY VERTICAL, 2018–2020 (USD THOUSAND)
TABLE 87 MARKET IN FRANCE, BY VERTICAL, 2021–2026 (USD THOUSAND)
10.3.4 ITALY
10.3.4.1 Automotive vertical is driving adoption of AI in Italy
TABLE 88 NEUROMORPHIC COMPUTING MARKET IN ITALY, BY VERTICAL, 2018–2020 (USD THOUSAND)
TABLE 89 MARKET IN ITALY, BY VERTICAL, 2021–2026 (USD THOUSAND)
10.3.5 SPAIN
10.3.5.1 Automotive vertical is expected to contribute significantly to market in Spain
TABLE 90 MARKET IN SPAIN, BY VERTICAL, 2018–2020 (USD THOUSAND)
TABLE 91 MARKET IN SPAIN, BY VERTICAL, 2021–2026 (USD THOUSAND)
10.3.6 REST OF EUROPE
TABLE 92 MARKET IN REST OF EUROPE, BY VERTICAL, 2018–2020 (USD THOUSAND)
TABLE 93 MARKET IN REST OF EUROPE, BY VERTICAL, 2021–2026 (USD THOUSAND)
10.4 APAC
FIGURE 52 SNAPSHOT OF MARKET IN ASIA PACIFIC
TABLE 94 MARKET IN APAC, BY COUNTRY, 2018–2020 (USD THOUSAND)
TABLE 95 MARKET IN APAC, BY COUNTRY, 2021–2026 (USD THOUSAND)
TABLE 96 MARKET IN APAC, BY VERTICAL, 2018–2020 (USD THOUSAND)
TABLE 97 MARKET IN APAC, BY VERTICAL, 2021–2026 (USD THOUSAND)
10.4.1 CHINA
10.4.1.1 China is largest market globally for image recognition and signal recognition applications
TABLE 98 MARKET IN CHINA, BY VERTICAL, 2018–2020 (USD THOUSAND)
TABLE 99 MARKET IN CHINA, BY VERTICAL, 2021–2026 (USD THOUSAND)
10.4.2 JAPAN
10.4.2.1 Aerospace, military & defense and IT & telecom are key industries in Japan for market
TABLE 100 MARKET IN JAPAN, BY VERTICAL, 2018–2020 (USD THOUSAND)
TABLE 101 MARKET IN JAPAN, BY VERTICAL, 2021–2026 (USD THOUSAND)
10.4.3 SOUTH KOREA
10.4.3.1 South Korean economy is majorly driven by consumer electronics and automotive industries
TABLE 102 NEUROMORPHIC COMPUTING MARKET IN SOUTH KOREA, BY VERTICAL, 2018–2020 (USD THOUSAND)
TABLE 103 MARKET IN SOUTH KOREA, BY VERTICAL, 2021–2026 (USD THOUSAND)
10.4.4 INDIA
10.4.4.1 Potential market for neuromorphic computing with rapid progression toward becoming a manufacturing hub
TABLE 104 MARKET IN INDIA, BY VERTICAL, 2018–2020 (USD THOUSAND)
TABLE 105 MARKET IN INDIA, BY VERTICAL, 2021–2026 (USD THOUSAND)
10.4.5 REST OF APAC
TABLE 106 MARKET IN REST OF APAC, BY VERTICAL, 2018–2020 (USD THOUSAND)
TABLE 107 MARKET IN REST OF APAC, BY VERTICAL, 2021–2026 (USD THOUSAND)
10.5 ROW
TABLE 108 MARKET IN ROW, BY REGION, 2018–2020 (USD THOUSAND)
TABLE 109 MARKET IN ROW, BY REGION, 2021–2026 (USD THOUSAND)
TABLE 110 MARKET IN ROW, BY VERTICAL, 2018–2020 (USD THOUSAND)
TABLE 111 MARKET IN ROW, BY VERTICAL, 2021–2026 (USD THOUSAND)
10.5.1 MIDDLE EAST & AFRICA
10.5.1.1 Countries such as South Africa and UAE are contributing to growth of market in MEA
TABLE 112 MARKET IN MIDDLE EAST & AFRICA, BY VERTICAL, 2018–2020 (USD THOUSAND)
TABLE 113 MARKET IN MIDDLE EAST & AFRICA, BY VERTICAL, 2021–2026 (USD THOUSAND)
10.5.2 SOUTH AMERICA
10.5.2.1 Increasing adoption of image and signal recognition applications for security and surveillance purposes is driving market growth in South America
TABLE 114 MARKET IN IN SOUTH AMERICA, BY VERTICAL, 2018–2020 (USD THOUSAND)
TABLE 115 MARKET IN IN SOUTH AMERICA, BY VERTICAL, 2021–2026 (USD THOUSAND)
11 COMPETITIVE LANDSCAPE (Page No. - 158)
11.1 OVERVIEW
11.2 REVENUE ANALYSIS FOR MARKET, 2020
TABLE 116 TOP FIVE PLAYERS IN MARKET, 2016–2020 (USD BILLION)
11.3 MARKET SHARE ANALYSIS, 2020
FIGURE 53 SHARE OF MAJOR PLAYERS IN MARKET, 2020
TABLE 117 NEUROMORPHIC COMPUTING MARKET: MARKET SHARE ANALYSIS (2020)
11.4 RANKING OF KEY PLAYERS IN MARKET
FIGURE 54 MARKET: RANKING OF KEY PLAYERS, 2020
11.5 COMPANY EVALUATION QUADRANT
11.5.1 STAR
11.5.2 PERVASIVE
11.5.3 EMERGING LEADER
11.5.4 PARTICIPANT
FIGURE 55 MARKET: COMPANY EVALUATION QUADRANT, 2020
11.6 STARTUP/SME EVALUATION QUADRANT
11.6.1 PROGRESSIVE COMPANY
11.6.2 RESPONSIVE COMPANY
11.6.3 DYNAMIC COMPANY
11.6.4 STARTING BLOCK
FIGURE 56 MARKET: STARTUP/SME EVALUATION QUADRANT, 2020
11.7 MARKET: COMPANY FOOTPRINT
TABLE 118 FOOTPRINT OF COMPANIES
TABLE 119 APPLICATION FOOTPRINT OF COMPANIES
TABLE 120 PRODUCT FOOTPRINT OF COMPANIES
TABLE 121 REGIONAL FOOTPRINT OF COMPANIES
11.8 COMPETITIVE SCENARIO
FIGURE 57 MARKET EVALUATION FRAMEWORK: PRODUCT LAUNCHES/DEVELOPMENTS, COLLABORATIONS, AND ACQUISITIONS WERE MAJORLY ADOPTED BY MARKET PLAYERS FROM 2017 TO 2021
11.9 COMPETITIVE SITUATIONS AND TRENDS
11.9.1 PRODUCT LAUNCHES
TABLE 122 MARKET: PRODUCT LAUNCHES, 2017–2021
11.9.2 DEALS
TABLE 123 MARKET: DEALS, 2017–2021
12 COMPANY PROFILES (Page No. - 176)
(Business Overview, Products Offered, Recent Developments, and MnM View (Key strengths/Right to Win, Strategic Choices Made, and Weaknesses and Competitive Threats))*
12.1 KEY PLAYERS
12.1.1 INTEL CORPORATION
TABLE 124 INTEL CORPORATION: BUSINESS OVERVIEW
FIGURE 58 INTEL CORPORATION: COMPANY SNAPSHOT
12.1.2 IBM CORPORATION
TABLE 125 IBM CORPORATION: BUSINESS OVERVIEW
FIGURE 59 IBM CORPORATION: COMPANY SNAPSHOT
12.1.3 BRAINCHIP HOLDINGS LTD.
TABLE 126 BRAINCHIP HOLDINGS LTD: BUSINESS OVERVIEW
FIGURE 60 BRAINCHIP HOLDINGS LTD: COMPANY SNAPSHOT
12.1.4 QUALCOMM
TABLE 127 QUALCOMM: BUSINESS OVERVIEW
FIGURE 61 QUALCOMM: COMPANY SNAPSHOT
12.1.5 HEWLETT PACKARD ENTERPRISE
TABLE 128 HEWLETT PACKARD ENTERPRISE: BUSINESS OVERVIEW
FIGURE 62 HEWLETT PACKARD ENTERPRISE: COMPANY SNAPSHOT
12.1.6 SAMSUNG ELECTRONICS LIMITED
TABLE 129 SAMSUNG ELECTRONICS LIMITED: BUSINESS OVERVIEW
FIGURE 63 SAMSUNG ELECTRONICS LIMITED: COMPANY SNAPSHOT
12.1.7 HRL LABORATORIES, LLC
12.1.8 GENERAL VISION INC.
12.1.9 APPLIED BRAIN RESEARCH, INC.
12.1.10 VICARIOUS
12.2 OTHER COMPANIES
12.2.1 NUMENTA
12.2.2 ASPINITY INC
12.2.3 BRAINCO, INC
12.2.4 BITBRAIN TECHNOLOGIES
12.2.5 HALO NEUROSCIENCE
12.2.6 KERNEL
12.2.7 NEXTMIND SRL
12.2.8 COGNIXION
12.2.9 NEUROPACE
12.2.10 MINDMAZE
12.2.11 INNATERA NANOSYSTEMS
12.2.12 MEMCOMPUTING
12.2.13 NATURAL INTELLIGENCE SYSTEMS
12.2.14 CERYX MEDICAL
12.2.15 KONIKU
*Details on Business Overview, Products Offered, Recent Developments, and MnM View (Key strengths/Right to Win, Strategic Choices Made, and Weaknesses and Competitive Threats) might not be captured in case of unlisted companies.
13 APPENDIX (Page No. - 212)
13.1 DISCUSSION GUIDE
13.2 KNOWLEDGE STORE: MARKETSANDMARKETS’ SUBSCRIPTION PORTAL
13.3 AVAILABLE CUSTOMIZATIONS
13.4 RELATED REPORTS
13.5 AUTHOR DETAILS
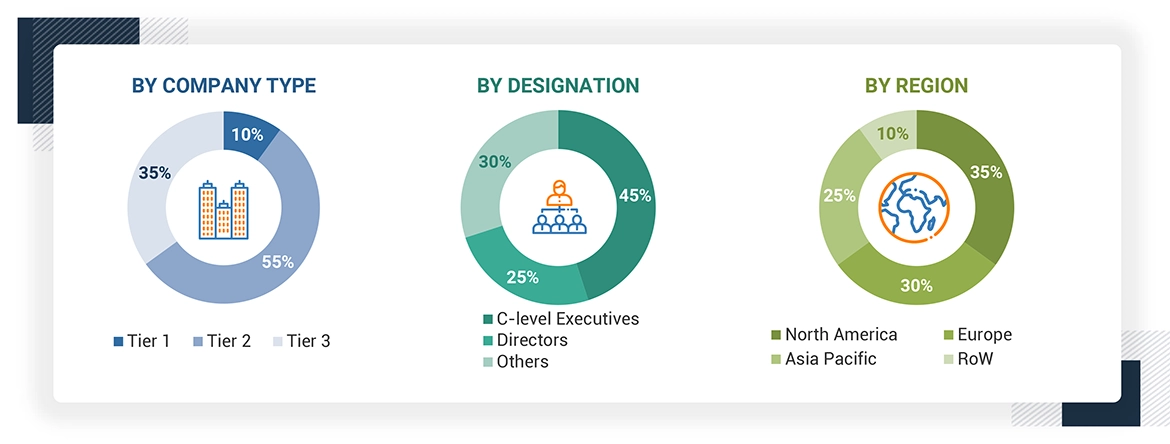
The study involved 4 major activities in estimating the current size of the neuromorphic computing market. Exhaustive secondary research has been conducted to collect information about the market, the peer market, and the parent market. Validating findings, assumptions, and sizing with industry experts across the value chain through primary research has been the next step. Both top-down and bottom-up approaches have been employed to estimate the complete market size. After that, market breakdown and data triangulation methods have been used to estimate the market size of segments and subsegments.
Secondary Research
The research methodology used to estimate and forecast the market begins with capturing the data on revenues of the key vendors in the market through secondary research. This study involves the use of extensive secondary sources, directories, and databases, such as Hoovers, Bloomberg Businessweek, Factiva, and OneSource, to identify and collect information useful for the technical and commercial study of the neuromorphic computing market. Secondary sources also include annual reports, press releases, and investor presentations of companies; white papers, certified publications, and articles from recognized authors; directories; and databases. Secondary research has been mainly done to obtain key information about the industry’s supply chain, market’s value chain, total pool of key players, market classification and segmentation according to industry trends, geographic markets, and key developments from both market- and technology oriented perspectives.
Primary Research
In the primary research process, various primary sources from both supply and demand sides were interviewed to obtain the qualitative and quantitative information relevant to the market. Primary sources from the supply side include experts such as CEOs, vice presidents, marketing directors, technology and innovation directors, application developers, application users, and related executives from various key companies and organizations operating in the ecosystem of the neuromorphic computing market.
Market Size Estimation
Both top-down and bottom-up approaches have been used to estimate and validate the overall size of the neuromorphic computing market. These methods have also been used extensively to estimate the size of various market subsegments. The research methodology used to estimate the market size includes the following:
- Key players in major applications and markets have been identified through extensive secondary research.
- The industry’s supply chain and market size, in terms of value, have been determined through primary and secondary research processes.
- All percentage shares, splits, and breakdowns have been determined using secondary sources and verified through primary sources.
Data Triangulation
After arriving at the overall market size using the estimation processes as explained above, the market was split into several segments and subsegments. To complete the overall market engineering process and arrive at the exact statistics of each market segment and subsegment, data triangulation, and market breakdown procedures have been employed, wherever applicable. The data have been triangulated by studying various factors and trends from both the demand and supply sides.
Neuromorphic Computing and Chips Market Set to Witness Strong Growth in Coming Years
Neuromorphic computing and neuromorphic chip market is expected to see significant growth in the coming years. Neuromorphic computing is a type of computing that is modeled on the way the human brain works, and it has the potential to revolutionize the field of artificial intelligence (AI). This growth is driven by several factors, including the increasing demand for AI and machine learning (ML) applications, the need for faster and more efficient computing systems, and the rising demand for neuromorphic computing in the defense and aerospace industries.
Neuromorphic chips are also becoming more popular in the field of robotics, as they can help robots to mimic human-like behavior and decision-making processes. Additionally, neuromorphic computing and neuromorphic chips are increasingly being used in the healthcare industry, for applications such as medical imaging and drug discovery.
Improving Accuracy and Reliability: Neuromorphic Computing's Impact on Industrial Computers
Neuromorphic computing has the potential to revolutionize industrial computers by providing a more efficient and effective way to process data. Industrial computers are used in a wide range of applications, including manufacturing, automation, and robotics, where they need to process large amounts of data in real-time. Neuromorphic computing can provide a solution to the limitations of traditional computing systems by mimicking the way the human brain works.
One of the key benefits of neuromorphic computing in industrial computers is the ability to process data faster and more efficiently. Traditional computing systems rely on sequential processing, which can be slow and inefficient for processing large amounts of data. Neuromorphic computing, on the other hand, can process data in parallel, allowing for faster and more efficient processing.
Another benefit of neuromorphic computing in industrial computers is the ability to handle complex and diverse data types. Traditional computing systems are limited in their ability to process complex data types, such as images, video, and audio. Neuromorphic computing, however, can process these data types more effectively, which is particularly important in applications such as machine vision and autonomous vehicles.
Transforming Industries: The Futuristic Growth Potential of Neuromorphic Computing
The potential use-cases for neurocomputing market are vast and varied, with the technology offering the potential to revolutionize a number of different industries. Here are some futuristic growth use-cases of neurocomputing market:
-
Autonomous vehicles: Neuromorphic computing can play a crucial role in the development of autonomous vehicles by enabling faster and more accurate decision-making. By mimicking the way the human brain works, neuromorphic computing can help autonomous vehicles better navigate complex and unpredictable environments.
-
Healthcare: Neuromorphic computing has the potential to transform healthcare by enabling faster and more accurate diagnosis and treatment of diseases. For example, the technology can be used to analyze medical images and detect abnormalities more accurately and quickly than traditional computing systems.
-
Energy management: Neuromorphic computing can be used to improve energy management by optimizing energy usage and reducing waste. For example, the technology can be used to analyze energy usage patterns and predict future energy demands, allowing for more efficient energy usage.
-
Robotics: Neuromorphic computing can help to improve the capabilities of robots by enabling them to better understand and interact with their environment. By mimicking the way the human brain works, neuromorphic computing can help robots to recognize objects and navigate complex environments.
Unleashing the Power of Brain-Inspired Computing: The Future of Healthcare, Aerospace, Manufacturing, and Finance
Brain-inspired computing has the potential to revolutionize several industries in the future by enabling faster, more efficient, and more accurate data processing. Here are some of the industries that are likely to be impacted by brain-inspired computing in the future:
-
Healthcare: Brain-inspired computing can help transform healthcare by enabling faster and more accurate diagnosis and treatment of diseases. The technology can be used to analyze medical images, detect abnormalities, and assist in surgical procedures.
-
Aerospace: Brain-inspired computing can be used in aerospace to enable faster and more efficient data processing. The technology can help to analyze complex data sets from satellites and other spacecraft, allowing for more accurate and efficient space exploration.
-
Manufacturing: Brain-inspired computing can help improve the efficiency and accuracy of manufacturing processes by enabling better automation and decision-making. The technology can be used to analyze data from sensors and other sources to optimize production and reduce waste.
-
Finance: Brain-inspired computing can help to improve risk management and fraud detection in the finance industry. The technology can be used to analyze large amounts of financial data and detect patterns that may indicate fraudulent activity or other risks.
Growth Opportunities and Key Challenges for Neurocomputing Market in the Future
Neurocomputing, also known as brain-inspired computing, is a rapidly growing field that offers a range of exciting opportunities and challenges for the future. Here are some of the key growth opportunities and challenges facing the neurocomputing market in the years ahead:
Growth Opportunities:
-
Increasing demand for faster and more efficient computing: As data processing needs continue to grow across a range of industries, there is an increasing demand for faster and more efficient computing technologies. Neurocomputing has the potential to meet this demand by enabling more efficient and intelligent data processing.
-
Advancements in AI and machine learning: The growth of AI and machine learning technologies is also driving the demand for neurocomputing. By mimicking the way the human brain works, neurocomputing can help to improve the accuracy and efficiency of these technologies.
-
Potential for new and innovative applications: The versatility of neurocomputing means that there are numerous potential applications for the technology in a range of industries, from healthcare and finance to aerospace and manufacturing.
Key Challenges:
-
Complexity of the technology: Neurocomputing is a complex technology that requires specialized knowledge and expertise to develop and implement. This can make it challenging for companies to adopt the technology, particularly smaller organizations with limited resources.
-
Limited availability of skilled professionals: As neurocomputing is a relatively new and rapidly evolving field, there is a limited pool of skilled professionals with the necessary expertise to develop and implement the technology.
-
High costs of development and implementation: The development and implementation of neurocomputing technologies can be expensive, particularly for smaller organizations. This can make it challenging for companies to justify the investment in the technology.
Report Objectives
- To define, describe, and forecast the market on the basis of offering, deployment, application, vertical, and region
- To forecast the size of the market segments for four main regions—North America, Europe, Asia Pacific (APAC), and Rest of the World (RoW)
- To provide detailed information regarding the major factors influencing the growth of the market (drivers, restraints, opportunities, and industry-specific challenges)
- To strategically analyze micromarkets1 with respect to individual growth trends, prospects, and contributions to the total market
- To study the complete value chain and allied industry segments, and perform a value chain analysis of the market
- To strategically profile key players and comprehensively analyze their market shares and core competencies2
- To analyze the opportunities in the market for stakeholders and describe the competitive landscape of the market
- To analyze competitive developments such as joint ventures, collaborations, agreements, contracts, partnerships, mergers & acquisitions, new product developments, and research & development (R&Ds) activities in the market
- To analyze the impact of COVID-19 on the neuromorphic computing market and provide market estimates for both pre-and post-COVID-19 scenarios
Available Customizations
With the given market data, MarketsandMarkets offers customizations according to the company’s specific needs. The following customization options are available for the report:
Company Information
- Detailed analysis and profiling of additional market players (up to 5)
Growth opportunities and latent adjacency in Neuromorphic Computing Market