
Night Vision Device Market Size, Share & Trends

Night Vision Device Market Size, Share & Trends by Device Type (Cameras, Goggles, Scopes, Binoculars & Monoculars), Technology (Thermal Imaging, Image Intensification, Infrared Illumination, Digital Imaging), Mounting Type (Stationary, Portable) - Global Forecast to 2030


NIGHT VISION DEVICE MARKET SIZE, SHARE & TRENDS
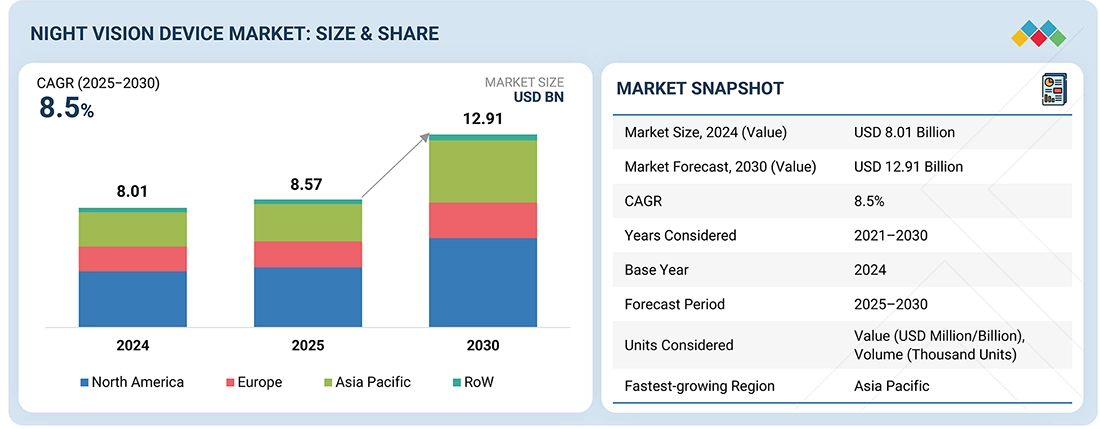
The global night vision device market size was valued at USD 8.57 billion in 2025 and is projected to USD 12.91 billion by 2030, growing at a CAGR of 8.5% from 2025 to 2030. Market growth is driven by rising defense budgets, increasing security concerns, and growing demand for surveillance systems. Advances in image enhancement, thermal imaging, and digital night vision are improving clarity, range, and real-time situational awareness across defense, law enforcement, security, and wildlife sectors. The trend toward miniaturization and integration with AI and IoT is expanding applications across handheld, vehicle-based, and aerial platforms.
MARKET SNAPSHOT TABLE
| REPORT METRIC | DETAILS |
|---|---|
| Market Size, 2025 (Value) | USD 8.57 Billion |
| Market Forecast, 2030 (Value) | USD 12.91 Billion |
| Growth Rate | CAGR of 8.5% from 2025 to 2030 |
| Years Considered | 2021–2030 |
| Base Year | 2024 |
| Forecast Period | 2025–2030 |
| Units Considered | Value (USD Million/Billion), Volume (Thousand Units) |
| Report Coverage | Revenue Forecast, Company Ranking, Competitive Landscape, Growth Factors, and Trends |
| Top Companies |
|
| Growth Drivers |
|
| Segments Covered |
|
| Regional Scope | North America, Asia Pacific, Europe, Middle East & Africa, Latin America |
Market Size & Forecast
KEY TAKEAWAYS
-
BY DEVICE TYPENight vision goggles are estimated to hold a dominant market share, due to their prevalent application in defense, law enforcement, and security missions. These devices offer hands-free, head-mounted solutions that enable users to operate efficiently in low-light or dark settings while preserving mobility and situational awareness.
-
BY TECHNOLOGYBased on technology, the thermal imaging segment accounted for a significant market share, owing to several factors, such as its capability to identify heat signatures and offer visibility in complete darkness or during poor weather conditions. It is frequently utilized in military scenarios, surveillance, and search & rescue missions, contributing to the expansion of the thermal imaging sector.
-
BY APPLICATIONThe night vision device market is expected to grow significantly during the forecast period, with the commercial surveillance segment projected to record the highest CAGR. This growth is driven by rising security concerns, rapid urbanization, and the increasing need for 24/7 surveillance in indoor and outdoor settings.
-
BY MOUNTING TYPEStationary night vision devices are estimated to be the larger segment, supported by rising installations in border security, infrastructure surveillance, and perimeter monitoring applications.
-
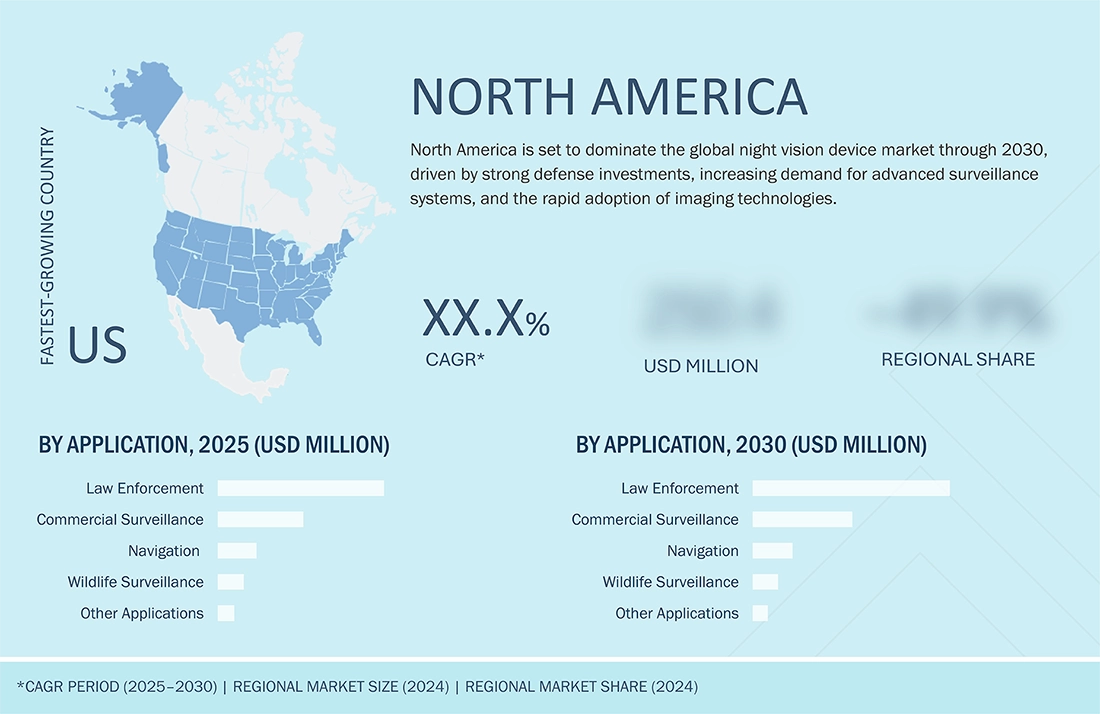
BY REGIONNorth America is estimated to lead the global night vision device market, driven by strong defense investments, increasing demand for advanced surveillance systems, and the rapid adoption of imaging technologies.
-
COMPETITIVE LANDSCAPEKey players such as Teledyne FLIR LLC (US), L3Harris Technologies, Inc. (US), BAE Systems plc (UK), Elbit Systems Ltd. (Israel), Thales Group (France), and ATN Corp. (US) are leading the market with extensive portfolios of night vision cameras, goggles, and thermal imaging systems. These companies focus on R&D investments, strategic partnerships, and product innovations to enhance image performance, integration capabilities, and overall operational effectiveness across military and commercial applications.
The night vision device market share is influenced by evolving defense, security, and surveillance requirements. Trends such as thermal imaging integration, digital night vision, and lightweight multi-sensor systems directly affect mission efficiency and safety outcomes. These advancements drive end-user demand for enhanced visibility and target detection, shaping procurement strategies and accelerating the growth of night vision device manufacturers and solution providers.
Source: Secondary Research, Interviews with Experts, MarketsandMarkets Analysis
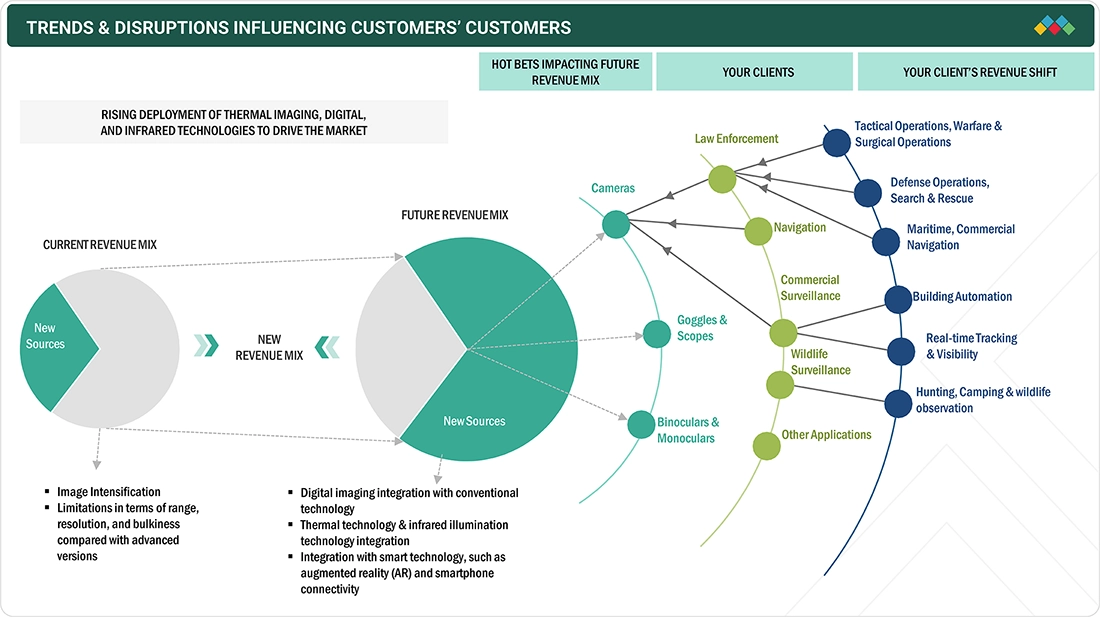
TRENDS & DISRUPTIONS IMPACTING CUSTOMERS' CUSTOMERS
The night vision device market trends is influenced by evolving defense, security, and surveillance requirements. Military forces, law enforcement agencies, and commercial security operators increasingly adopt advanced imaging technologies to enhance situational awareness and operational capability in low-light conditions. Trends such as thermal imaging integration, digital night vision, and lightweight multi-sensor systems directly affect mission efficiency.
Source: Secondary Research, Interviews with Experts, MarketsandMarkets Analysis
MARKET DYNAMICS
Level
-
Rising need for situational awareness and target identification in military & defense operations

-
Rapid advancements in optics and thermal imaging technologies

Level
-
Low budget allocation for developing innovative night vision devices

Level
-
Increasing government spending on security and surveillance systems to prevent terrorism

-
Rising adoption of night vision devices in diverse applications

Level
-
Lack of substantial investments in R&D of night vision devices

Source: Secondary Research, Interviews with Experts, MarketsandMarkets Analysis
Driver: Rising need for situational awareness and target identification in military & defense operations
The extensive use of night vision devices in military & defense and law enforcement applications is driven by the need for heightened situational awareness, target identification, and operational effectiveness in low-light and nighttime conditions.
Restraint: Low budget allocation for developing innovative night vision devices
Night vision devices, particularly advanced ones with cutting-edge technology, such as thermal imaging and high-resolution image intensifiers, can be quite expensive. This high cost poses a significant barrier to widespread adoption, especially for smaller law enforcement agencies, security firms, and individuals.
Opportunity: Increasing government spending on security and surveillance systems to prevent terrorism
The night vision device market is experiencing a favorable and opportunistic environment due to the increasing allocation of government budgets for security and surveillance purposes. Governments worldwide recognize the imperative need to enhance their security measures in the face of evolving threats, including terrorism and criminal activities.
Challenge: Lack of substantial investments in R&D of night vision devices
Night vision device manufacturers face constant pressure to innovate and develop new products that offer improved performance, better image quality, increased durability, and enhanced features. Staying at the forefront of technology requires substantial investments in research & development (R&D), which can strain resources.
Night Vision Device Market: COMMERCIAL USE CASES ACROSS INDUSTRIES
| COMPANY | USE CASE DESCRIPTION | BENEFITS |
|---|---|---|
 |
Integration of thermal imaging and image intensification technologies in night vision goggles and weapon sights for defense forces | Enhanced target detection in low-light conditions, improved operational effectiveness, multi-environment adaptability |
 |
Development of handheld and vehicle-mounted thermal imaging systems for military and law enforcement | Long-range detection in total darkness or obscured conditions, real-time threat identification, and improved situational awareness |
 |
Production of fusion night vision goggles combining infrared and image intensification for special operations | Increased depth perception, faster target acquisition, reduced eye strain for operators in prolonged missions |
 |
Manufacture of night vision modules with integrated augmented reality overlays for armored vehicle crews | Real-time data integration into vision systems, improved navigation in no-light environments, and enhanced crew coordination |
 |
Supply of advanced pilot night vision systems with head-mounted displays for rotary- and fixed-wing aircraft | Clear visibility during night flights, safe low-altitude maneuvering, enhanced mission success rates in adverse conditions |
Logos and trademarks shown above are the property of their respective owners. Their use here is for informational and illustrative purposes only.
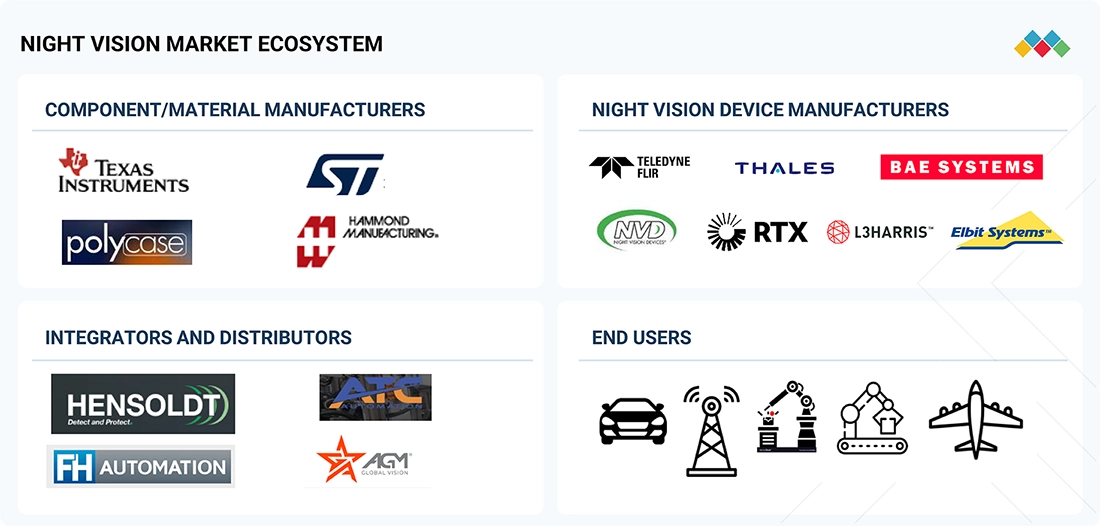
NIGHT VISION DEVICE MARKET ECOSYSTEM
The night vision device market growth is supported by a robust ecosystem of manufacturers, component suppliers, and technology integrators. Leading players include Thales (France), Teledyne FLIR LLC (US), L3Harris Technologies Inc. (US), BAE Systems (UK), and Elbit Systems Ltd. (Israel). These companies provide a diverse range of night vision solutions incorporating image intensification, thermal imaging, and digital night vision technologies for defense, law enforcement, surveillance, and commercial applications. The presence of these global defense and optics leaders underscores the increasing demand for enhanced situational awareness, target acquisition, and security operations in low-light and nighttime conditions.
Logos and trademarks shown above are the property of their respective owners. Their use here is for informational and illustrative purposes only.
NIGHT VISION DEVICE MARKET SEGMENTS
Source: Secondary Research, Interviews with Experts, MarketsandMarkets Analysis
Night Vision Device Market, by Device Type
The cameras segment is projected to account for a significant market share during the forecast period. Night vision cameras are specialized imaging devices widely utilized across diverse sectors. They excel in capturing clear images and videos in low-light conditions and total darkness. Their applications are extensive, including security and surveillance for homes, businesses, and public spaces, enhancing law enforcement’s nighttime operations, supporting military reconnaissance and navigation, aiding search & rescue missions, and enabling wildlife observation without disturbing natural behavior.
Night Vision Device Market, by Technology
The thermal imaging segment is projected to account for a significant market share in 2030. This is propelled by various factors, including its ability to detect heat signatures and provide visibility in complete darkness or adverse weather conditions. It is often used in military applications, surveillance, and search & rescue operations, fueling the growth of the thermal imaging segment.
Night Vision Device Market, by Application
The law enforcement application segment is projected to grow at the highest CAGR during the forecast period. Law enforcement applications include military activities, defense operations, and aviation across critical application scenarios. Night vision devices enhance visibility and situational awareness in low-light and nighttime conditions, empowering infantry and special operations forces for offensive and defensive missions.
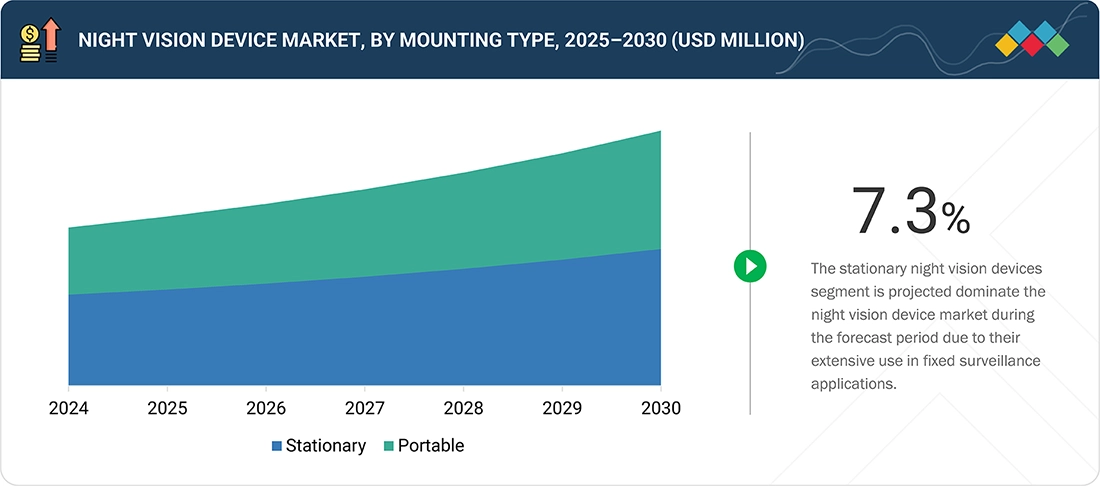
Night Vision Device Market, by Mounting Type
Stationary night vision devices are estimated to hold a dominant position in the night vision device market in terms of market share due to their extensive use in fixed surveillance applications. They are crucial for protecting high-security areas such as borders, industrial facilities, and government sites, where continuous monitoring is essential.
REGION
North America is projected to lead the global night vision device market during the forecast period
North America is projected to dominate the global night vision device market through 2030, fueled by strong defense investments and a rising demand for advanced surveillance systems. The focus on national security has led to increased funding for military and law enforcement operations, which in turn drives the adoption of improved imaging technologies. Major players in the industry, located in this region, are continuously innovating, enhancing device capabilities such as resolution and low-light performance. This combination of defense spending, technological advancement, and collaboration between tech firms and defense contractors positions North America as a leader in the night vision market, with growth anticipated across various sectors.
The North America night vision device market is projected to grow from USD 4.02 billion in 2025 to USD 5.98 billion by 2030, registering a CAGR of 8.3%. Market expansion is driven by increasing procurement of night vision and thermal imaging systems for defense modernization, border surveillance, and tactical law enforcement missions across North America. Advancements in digital night-vision, sensor fusion, and AI-assisted threat detection are enhancing situational awareness, targeting accuracy, and mission safety. Additionally, growing federal spending, homeland security programs, and the rising adoption of night-vision technology in commercial security, wildlife monitoring, and outdoor activities continue to accelerate market growth across the region.
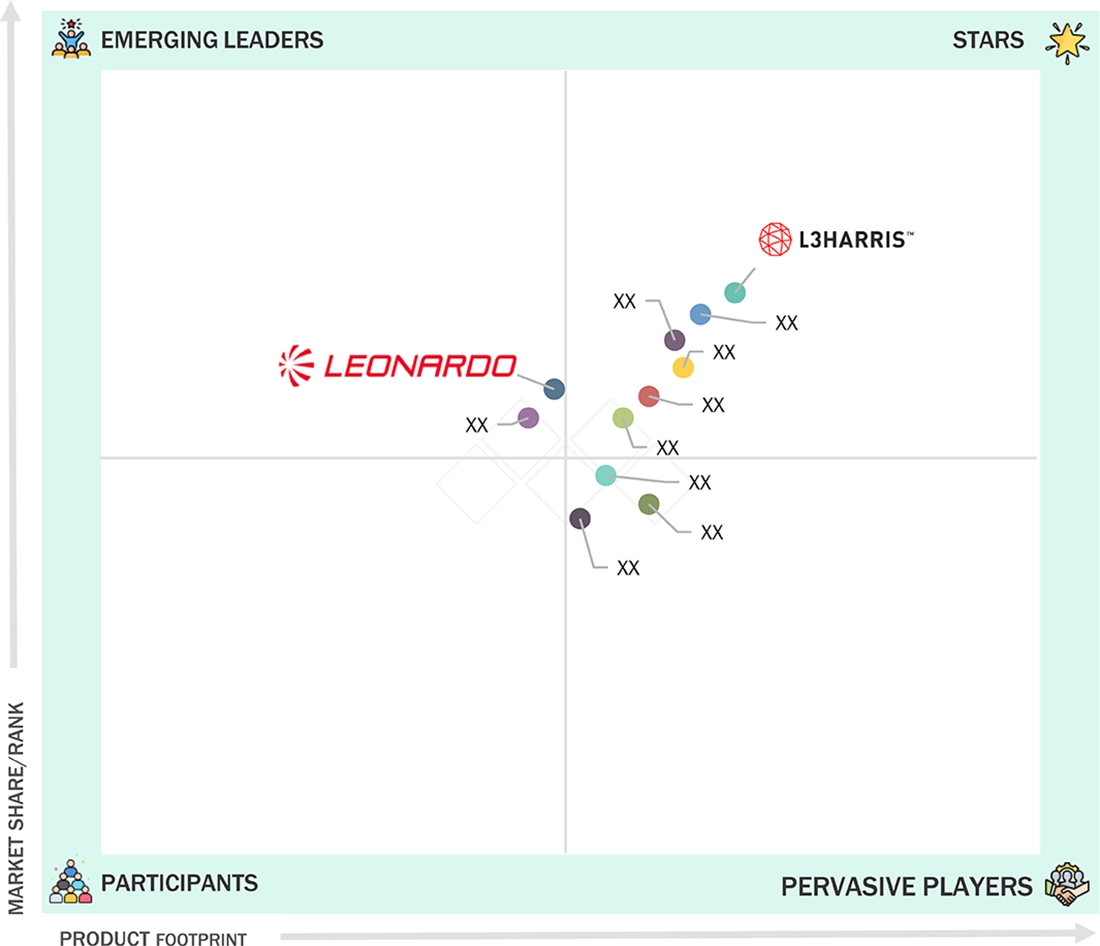
Night Vision Device Market: COMPANY EVALUATION MATRIX
In the night vision device market matrix, L3Harris (Star) and Leonardo (Emerging Leader) hold strong positions with their broad product portfolios, global presence, and robust financial capabilities. Their continuous innovation and brand equity enable them to lead large-scale adoption of night vision devices worldwide.
Source: Secondary Research, Interviews with Experts, MarketsandMarkets Analysis
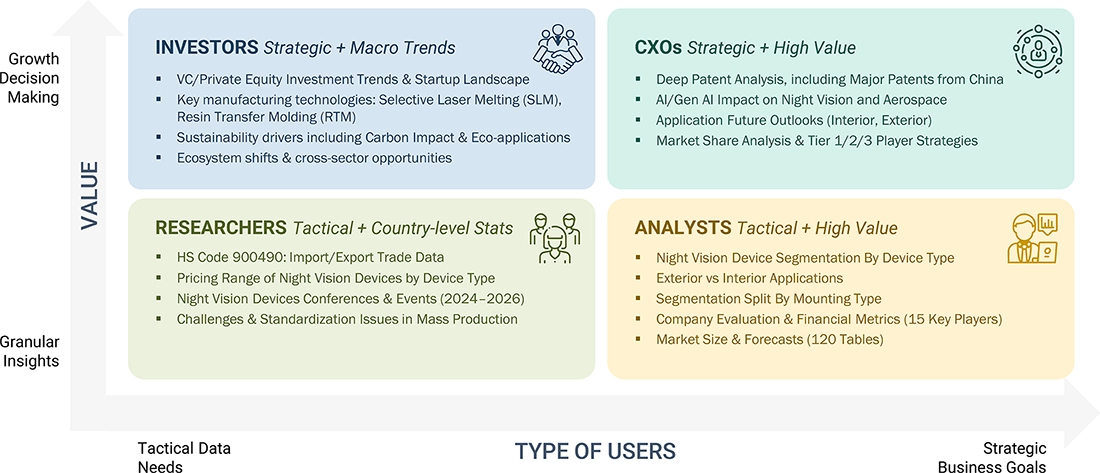
WHAT IS IN IT FOR YOU: Night Vision Device Market REPORT CONTENT GUIDE
DELIVERED CUSTOMIZATIONS
We have successfully delivered the following deep-dive customizations:
| CLIENT REQUEST | CUSTOMIZATION DELIVERED | VALUE ADDS |
|---|---|---|
| European Defense OEM |
|
|
| North American Homeland Security Contractor |
|
|
| APAC Law Enforcement Equipment Distributor |
|
|
RECENT DEVELOPMENTS
- January 2025 : Elbit Systems of America received a delivery order exceeding USD 139 million for the continued production of Enhanced Night Vision Goggle – Binocular (ENVG-B) systems, including spare parts and logistics support. Under a 2023 IDIQ contract, the order would be completed from the Roanoke, Virginia, facility, with deliveries continuing through December 2026.
- January 2025 : The US Army awarded L3Harris Technologies, Inc., a USD 263 million order for continued ENVG-B production under the second IDIQ order. The system would enhance situational awareness and enable connectivity to the Integrated Tactical Network, providing advanced night-vision capabilities.
- October 2024 : L3Harris and Palantir entered a strategic partnership to accelerate advanced technology development and drive digital transformation. The collaboration combined L3Harris’ sensors and software-defined systems with Palantir’s Artificial Intelligence Platform (AIP), enhancing resilient connectivity and enabling faster, informed decision-making across joint all-domain operations.
- June 2024 : Teledyne FLIR LLC launched the Hadron 640+ and radiometric Hadron 640R+ dual camera modules with enhanced thermal sensitivity. These ITAR-free, SWaP-optimized systems were designed for integration into unmanned aerial systems (UAS), unmanned ground vehicles (UGVs), and robotic platforms, supporting day and night vision capabilities via dual thermal and visible imaging.
- April 2024 : L3Harris received a USD 256 million order from the US Army for full-scale production of ENVG-B under its Program of Record IDIQ. This order marked the first in a nearly USD 1 billion, 10-year contract to equip warfighters with advanced night-vision capabilities.
Table of Contents
 Exclusive indicates content/data unique to MarketsandMarkets and not available with any competitors.
Methodology
The research has involved four major steps in estimating the night vision device market size. Exhaustive secondary research has been done to collect important information about the market and peer markets. The next step has been to validate these findings and assumptions and size them with the help of primary research with industry experts across the value chain. Both top-down and bottom-up approaches have been used to estimate the market size. After this, the market breakdown and data triangulation approaches have been adopted to estimate the market sizes of segments and subsegments.
Secondary Research
Various secondary sources have been referred to in the secondary research process to identify and collect the information required for this study. These sources include annual reports, press releases, investor presentations of companies, white papers, and articles from recognized authors. Secondary research has been done to obtain key information about the market’s value chain, the pool of key market players, market segmentation according to industry trends, regional outlook, and developments from market and technology perspectives.
In the night vision device market report, the global market size has been estimated using top-down and bottom-up approaches and several other dependent submarkets. The major players in the market have been identified using extensive secondary research, and their presence in the market has been determined using secondary and primary research. All the percentage splits and breakdowns have been determined using secondary sources and verified through primary sources.
Primary Research
Extensive primary research has been conducted after understanding the night vision device market scenario through secondary research. Several primary interviews have been conducted with key opinion leaders from demand- and supply-side vendors across four major regions—North America, Europe, Asia Pacific, and RoW. Approximately 40% of the primary interviews have been conducted with the demand-side vendors and 60% with the supply-side vendors. Primary data has been collected mainly through telephonic interviews, which consist of 80% of the total primary interviews; questionnaires and emails have also been used to collect the data.
After successful interaction with industry experts, brief sessions have also been conducted with highly experienced independent consultants to reinforce the findings of our primary research. This, along with the in-house subject-matter experts’ opinions, has led us to the findings as described in the report. The breakdown of primary respondents is as follows:

Note: Others include sales, marketing, and product managers.
To know about the assumptions considered for the study, download the pdf brochure
Market Size Estimation
In the complete market engineering process, top-down and bottom-up approaches and several data triangulation methods have been used to estimate and forecast the overall market segments and subsegments listed in this report. The key players in the market have been identified through secondary research, and their market shares in the respective regions have been determined through primary and secondary research. This entire procedure includes the study of annual and financial reports of the top market players and extensive interviews for key insights (quantitative and qualitative) with industry experts (CEOs, VPs, directors, and marketing executives).
All percentage shares, splits, and breakdowns have been determined using secondary sources and verified through primary sources. All the parameters affecting the markets covered in this research study have been accounted for, viewed in detail, verified through primary research, and analyzed to obtain the final quantitative and qualitative data. This data has been consolidated and supplemented with detailed inputs and analysis from MarketsandMarkets and presented in this report.
Bottom-Up Approach
- Companies offering night vision devices have been identified, and their product mapping with respect to different parameters, such as technology, device type, mounting type, and application, has been carried out.
- The market size has been estimated based on the demand for different types of night vision devices from different industries. The anticipated change in demand for night vision devices offered by these companies and company revenues have been analyzed and estimated.
- Primary research has been conducted with a few major players operating in the night vision device market to validate the global market size.
- The size of the night vision device market has then been validated through secondary sources, which include the International Trade Centre (ITC), the World Trade Organization, and the World Economic Forum.
- The CAGR at which the night vision device market is estimated to grow has been calculated considering the historical and future market trends and understanding the adoption rate of night vision devices from different industries.
- The estimates at every level have been verified and cross-checked through discussions with key opinion leaders, such as corporate executives (CXOs), directors, sales heads, and domain experts in MarketsandMarkets.
- Various paid and unpaid information sources, such as company websites, annual reports, press releases, research journals, magazines, white papers, and databases, have also been studied.
Top-Down Approach
- Focusing initially on the R&D investments and expenditures made in the night vision devices ecosystem, and further splitting the market based on technology, device type, mounting type, application, and region and listing the key developments
- Identifying leading players in the night vision device market through secondary research and verifying them through brief discussions with industry experts
- Analyzing revenue, product mix, geographic presence, and key industries for which all identified players serve products to estimate and arrive at percentage splits for all key segments
- Discussing splits with industry experts to validate the information and identify key growth pockets across all key segments
- Breaking down the total market based on verified splits and key growth pockets across all segments
Night Vision Device Market : Top-Down and Bottom-Up Approach

Data Triangulation
After arriving at the overall market size from the estimation process explained above, the overall market has been split into several segments and subsegments. The data triangulation procedure has been employed wherever applicable to complete the overall market engineering process and arrive at the exact statistics for all segments and subsegments. The data has been triangulated by studying various factors and trends from both the demand and supply sides. Additionally, the market size has been validated using top-down and bottom-up approaches.
Market Definition
A night vision device is an electro-optic instrument designed to enhance a person's ability to see in low-light or night-time conditions, where natural light is insufficient for human vision. These devices capture and amplify available light or other forms of electromagnetic radiation, such as infrared or thermal radiation, to make objects and scenes visible in the dark. They utilize various technologies, including image intensification, thermal imaging, and digital and infrared illumination, to capture and amplify existing ambient light or thermal radiation, making objects visible in the dark. Examples of night vision devices include night vision goggles, monoculars, binoculars, scopes, and cameras. They are used in various fields, such as night driving or flying, night security & surveillance, law enforcement, military, navigation, entertainment, hidden-object detection, wildlife observation, and search & rescue.
Key Stakeholders
- Night vision device manufacturers
- Night vision device suppliers
- Night vision device integrators
- Night vision device distributors
- Technology investors
- Governments and financial institutions
- Research organizations
- Analysts and strategic business planners
- Venture capitalists, private equity firms, and startups
- Aerospace & defense institutes and universities
- Component suppliers and distributors
- Logistics and shipment companies
Report Objectives
- To define, describe, and forecast the night vision device market based on technology, device type, mounting type, application, and region, in terms of value
- To forecast the night vision device market based on technology, device type, and application, in terms of volume
- To forecast the size of the market segments for four major regions—North America, Europe, Asia Pacific, and the Rest of the World (RoW)
- To provide detailed information regarding the major drivers, restraints, opportunities, and challenges influencing market growth
- To strategically analyze micromarkets with respect to individual growth trends, prospects, and contributions to the total market
- To study the complete value chain and allied industry segments, and perform a market value chain analysis
- To strategically profile the key players and comprehensively analyze their market shares and core competencies
- To provide ecosystem analysis, case study analysis, patent analysis, technology analysis, pricing analysis, Porter’s five forces analysis, key stakeholders and buying criteria, key conferences and events, regulatory landscape, and US tariff impact analysis
- To analyze the opportunities for stakeholders and describe the competitive landscape of the market
- To analyze competitive developments, such as collaborations, agreements, contracts, partnerships, mergers and acquisitions, and product launches in the market
Available Customizations
With the given market data, MarketsandMarkets offers customizations according to the specific requirements of companies. The following customization options are available for the report:
- Detailed analysis and profiling of additional market players based on various blocks of the supply chain
Key Questions Addressed by the Report
What is the current size of the Night Vision Device Market?
The global Night Vision Device Market is estimated at USD 8.31 billion in 2025.
What is the projected market size by 2030?
The market is expected to reach USD 12.31 billion by 2030, driven by increasing defense spending and security applications.
What is the CAGR of the Night Vision Device Market from 2025 to 2030?
The market is projected to grow at a CAGR of 8.2% during the forecast period.
What are the major growth drivers of the Night Vision Device Market?
Key drivers include defense modernization programs, rising border security concerns, increasing military operations at night, and advancements in thermal imaging technologies.
Which technology segment dominates the Night Vision Device Market?
Image Intensification technology holds a significant market share due to its widespread adoption in military and law enforcement applications.
Which application segment generates the highest demand?
Military and defense applications account for the largest share, driven by the need for enhanced situational awareness and target identification during nighttime operations.
Which region holds the largest market share in the Night Vision Device Market?
North America leads the market due to high defense budgets, military modernization initiatives, and strong adoption of advanced surveillance technologies.
Which region is expected to witness the fastest growth?
Asia Pacific is projected to register the highest growth due to rising defense expenditures in China, India, South Korea, and Japan.
Who are the leading companies in the Night Vision Device Market?
Major players include L3Harris Technologies, Elbit Systems, RTX Corporation, Teledyne FLIR, BAE Systems, Thales Group, Safran, Hensoldt AG, and Bharat Electronics Limited.
What are the key trends shaping the Night Vision Device Market?
Key trends include AI-enabled night vision systems, fusion of thermal and image intensification technologies, lightweight wearable devices, enhanced soldier modernization programs, and integration with unmanned systems.
Need a Tailored Report?
Customize this report to your needs
Get 10% FREE Customization
Customize This ReportPersonalize This Research
- Triangulate with your Own Data
- Get Data as per your Format and Definition
- Gain a Deeper Dive on a Specific Application, Geography, Customer or Competitor
- Any level of Personalization
Let Us Help You
- What are the Known and Unknown Adjacencies Impacting the Night Vision Device Market
- What will your New Revenue Sources be?
- Who will be your Top Customer; what will make them switch?
- Defend your Market Share or Win Competitors
- Get a Scorecard for Target Partners

Custom Market Research Services
We Will Customise The Research For You, In Case The Report Listed Above Does Not Meet With Your Requirements
Get 10% Free CustomisationTESTIMONIALS

Tetsuya Ohhira
Business Development Manager-Technology Business
Nikon Corporation,
Leading Japanese MNC specializing in optics and imaging productswww.nikon.com
MarketsandMarkets™ response
is quick. Their attitude is flexible and positive. Analyst Insights are globally considered and
significant. Client Services quickly respond to our inquiry and demand. Their wide range of global
surveys help us make our strategic plan.
We hope Knowledge Store will be easier to search
for a report.
VP - Marketing & Business Development
Leading Provider of Process Control Solutions
We engaged with MarketsandMarkets on a study to perform an analysis and recommend a Go-To-Market strategy for metrology and process control in the semiconductor market. The study was tailored to our targets and needs with well-defined milestones. Our overall experience with the MarketsandMarkets team was very good throughout the project in all aspects including the analysis methodologies used, the quality and depth of primary and secondary data sets, the professionalism and flexibility of the team and the ability to meet the target schedule and milestones. We want to thank MarketsandMarkets team for a job well done.


Growth opportunities and latent adjacency in Night Vision Device Market