Patient Monitoring Devices Market

Patient Monitoring Devices Market by Product (EEG, MEG, TCD, Pulse Oximeter, Spirometer, Fetal Monitor, Temperature Monitor, MCOT, ECG, ICP, ILRs, Multi-parameter Monitoring, Weight Monitoring), End-User (Hospital, ASCs) - Global Forecast to 2027

Report Code: MD 2436 Sep, 2022, by marketsandmarkets.com

The global patient monitoring devices market in terms of revenue was estimated to be worth $42.3 billion in 2022 and is poised to reach $65.4 billion by 2027, growing at a CAGR of 9.1% from 2022 to 2027. Greater availability of integrated monitoring technologies such as smartphones and wireless devices is a key industry trend supporting the growth of the market , resulting in the introduction of remote monitoring systems, mobile cardiac telemetry devices, mobile personal digital assistant (PDA) systems, ambulatory wireless EEG recorders, and ambulatory event monitors.

Patient Monitoring Devices Market

To know about the assumptions considered for the study, Request for Free Sample Report

Patient Monitoring Devices Market Dynamics

Drivers: Growing preference for wearable patient monitoring devices

Continuous glucose monitoring, temperature monitoring, blood pressure monitoring, and pulse oximetry are a few applications of wearable patient monitoring devices, biosensors, and smart implants. Improvements in and the increased availability of wireless data transmission networks will facilitate the development of platforms for telehealth and enhanced patient monitoring. New-generation wearable devices are equipped with the Internet of Things technology. Vital signs such as electrocardiography (ECG), blood sugar, and blood pressure are measured using wearable biosensors and transmitted over mobile wireless networks to a central server. Listed below are regulatory approvals in recent years:

  • In June 2022, GE Healthcare launched a new wireless patient monitoring device. It supports in oxygen saturation capturing respiration rate, and pulse rate for post-surgery patients continuously and general ward, thereby giving clinicians to act early and avert serious adverse events.
  • In April 2022, LivaNova commenced the targeted commercial launch of its Essenz Patient Monitor, following receipt of required regulatory approvals. The system received 510(k) clearance from the US Food and Drug Administration (FDA) as well as CE Mark. It was initially launched in the US and Europe for use in hospitals that were involved in the device’s user-centric design and development program.

Opportunities: Growing demand for patient monitoring devices in non-hospital settings

The sustainability of the current healthcare system is a key area of concern for governments across the globe. In recent years, the rising healthcare expenditure, especially in hospital settings, has shifted the focus towards alternative methods of treatment, such as home healthcare. Moreover, the number of hospital readmissions has decreased considerably due to the rising use of remote and home monitoring devices. This, in turn, has ensured a growing demand for effective home-use devices such as event monitors, ECG monitors, temperature monitors, pulse oximeters, EEG recorders, and fetal and neonatal monitors.

Restraints: Risk associated with system failures

Often, system failures are a result of equipment malfunction or insufficient planning, indicating that it is important to develop techniques for predicting and addressing a system failure. Particularly for safety–critical applications such as patient monitoring devices, which are dealing with human health, risk analysis associated with system failures should be considered a necessity.

Challenges: Increasing pricing pressure on market players

Various initiatives are being taken to curtail healthcare costs through price regulations, competitive pricing, bidding and tender mechanics, coverage and payment policies, comparative effectiveness of therapies, technology assessments, and managed-care arrangements globally. In response to the increasing pressure to reduce healthcare costs, healthcare providers have aligned themselves with group purchasing organisations and integrated health networks, negotiating for the bulk purchase of medical devices. In 2018, the Indian government increased import duties on medical devices from 5% to 7.5% of the overall product costs and imposed an additional excise duty of 4% on previously exempted medical devices. Such taxes are expected to increase operational costs and negatively affect the cash flow of medical monitoring companies across major healthcare markets worldwide.

By product segment, the blood glucose monitoring systems dominated the global patient monitoring devices market in 2021

Based on the product, the global market is segmented into temperature monitoring devices, hemodynamic/pressure monitoring devices, blood glucose monitoring systems, fetal and neonatal monitoring devices, neuromonitoring devices, weight monitoring devices, cardiac monitoring devices, multiparameter monitoring devices, respiratory monitoring devices, and other patient monitoring devices. The blood glucose monitoring products segment dominated the market in 2021. Blood glucose monitoring systems include continuous monitoring systems and self-monitoring glucose systems. Novel product launches and the rising adoption of blood glucose monitoring devices in emerging countries, coupled with the growing incidence and prevalence of diabetes, are expected to boost segment growth.

The hospital segment accounted for the largest share of the patient monitoring devices market in 2021, by the end-user segment

Based on end-user, the market has been segmented into the ambulatory surgery centers, hospitals, home care settings and other end users. Among these, the hospitals segment is reported to account for the highest market share in 2021. The large share of this segment is attributed to the growing emphasis on early and effective disease diagnosis in hospital setup along with availability for sepcialised physicians, large target patient population base (especially in emerging economies) preferring hospitals, the growing procedural volume in hospital settings, and the financial backup of hospitals for introducing various technologically advanced patient monitoring devices products.

Patient Monitoring Devices Market by Region

By Region, Asia Pacific Patient Monitoring Devices Market is anticipated to grow at the highest CAGR by 2027.

The Asia Pacific market will grow at the highest CAGR during the forecast period, primarily due to the rising healthcare expenditure, heavy burden of infectious diseases, and increasing geriatric population, along with favourable public and private contributions to overall healthcare infrastructure. Apart from this, the increase in the number of ambulatory surgical centers and the development of infrastructure in hospitals in the APAC region are expected to propel the global market.

To know about the assumptions considered for the study, download the pdf brochure

The major players in the patient monitoring devices market are Abbott Laboratories (US), HILL-ROM HOLDINGS, INC. (US), Drägerwerk AG & Co. KGaA (Germany), Edwards Lifesciences Corporation (US), OMRON Corporation (Japan), Masimo Corporation (US), Compumedics Limited (Australia), Shenzhen Mindray Bio-Medical Electronics Co., Ltd. (China), Nihon Kohden Corporation (Japan), Natus Medical (US), Medtronic plc (Ireland), Koninklijke Philips N.V. (Netherlands), GE Healthcare (US), Getinge AB (Sweden), Boston Scientific Corporation (US), Dexcom, Inc. (US), Nonin (US), BIOTRONIK (Germany), SCHILLER (Switzerland), and BioTelemetry, Inc. (US), among others.

Medtronic plc is a leader in the global market. Medtronic plc (US) has a wide range of product offerings in the patient monitoring devices market, including neuromonitoring, respiratory monitoring devices, cardiac monitoring devices, and blood glucose monitoring products. The company’s flagship product-BIS the brain monitoring system–is among the most widely used systems in the global market. The company is focused on innovations and improving the quality of its products with increasing investment in its R&D department. Medtronic’s global footprint allows it to cater to a customer base across 150+ countries such as Germany, the UK, New Zealand, Australia, and the US.

Patient Monitoring Devices Market Report Scope

Report Metric

Details

Market Revenue in 2022

$42.3 billion

Estimated Value by 2027

$65.4 billion

Growth Rate

Poised to grow at a CAGR of 9.1%

Largest Share Segments

  • Blood glucose monitoring systems
  • Hospital segment

Market Report Segmentation

Product, End-User and Regional Level

Growth Drivers

  • Growing preference for wearable patient monitoring devices

Growth Opportunities

  • Growing demand for patient monitoring devices in non-hospital settings

Geographies covered

North America, Europe, APAC, MEA, and Latin America

Patient Monitoring Devices Market Report Segmentation

By Product

  • Blood Glucose Monitoring Systems
    • Self-monitoring Blood Glucose Systems
    • Continuous Glucose Monitoring Systems
  • Cardiac Monitoring Devices
    • ECG Devices
    • Implantable Loop Recorders
    • Event Monitors
    • Mobile Cardiac Telemetry Monitors
    • Smart/Wearable ECG Monitors
  • Multi-parameter Monitoring Devices
    • Low-acuity Monitoring Devices
    • Mid-acuity Monitoring Devices
    • High-acuity Monitoring Devices
  • Respiratory Monitoring Devices
    • Pulse Oximeters
    • Spirometers
    • Capnographs
    • Peak Flow Meters
  • Temperature Monitoring Devices
    • Handheld Temperature Monitoring Devices
    • Table-top Temperature Monitoring Devices
    • Wearable Continuous Monitoring Devices
    • Invasive Temperature Monitoring Devices
    • Smart Temperature Monitoring Devices
  • Hemodynamic/Pressure Monitoring Devices
    • Hemodynamic Monitors
    • Blood Pressure Monitors
    • Disposables
  • Fetal & Neonatal Monitoring Devices
    • Fetal Monitoring Devices
    • Neonatal Monitoring Devices
  • Neuromonitoring Devices
    • Electroencephalograph Machines
    • Electromyography Machines
    • Cerebral Oximeters
    • Intracranial Pressure Monitors
    • Magnetoencephalograph Machines
    • Transcranial Doppler Machines
  • Weight Monitoring Devices
    • Digital
    • Analog
  • Other Patient Monitoring Devices

By End User

  • Hospitals
  • Ambulatory Surgery Centers
  • Home Care Settings
  • Other End Users

By Region

  • North America
    • US
    • Canada
  • Europe
    • Germany
    • France
    • UK
    • Italy
    • Spain
    • Rest of Europe (RoE)
  • Asia Pacific
    • Japan
    • China
    • India
    • Australia
    • South Korea
    • RoAPAC
  • Latin America
    • Brazil
    • Mexico
    • RoLA
  • Middle East & Africa

Recent Developments

  • In 2020, Medtronic received US FDA approval for its LINQ II Insertable Cardiac Monitor (ICM). It is an implantable device for determining the irregular heart rythm.
  • In 2020, Medtronic and Tandem Diabetes Care, Inc underwent a patent cross-license agreement, in which both medical monitoring companies can cross-license each other’s patent portfolio for five years and jointly focus on innovating new products and services for diabetes management.
  • In 2020, Masimo Corporation acquired the connected care business from NantHealth, which helped strengthen its position in the connected care market.

Frequently Asked Questions (FAQs):

To speak to our analyst for a discussion on the above findings, click Speak to Analyst

TABLE OF CONTENTS

1 INTRODUCTION (Page No. - 45)
    1.1 STUDY OBJECTIVES
    1.2 MARKET DEFINITION
          TABLE 1 INCLUSIONS AND EXCLUSIONS
    1.3 STUDY SCOPE
          FIGURE 1 PATIENT MONITORING DEVICES MARKET
          FIGURE 2 GLOBAL MARKET, BY GEOGRAPHY
    1.4 YEARS CONSIDERED
    1.5 CURRENCY CONSIDERED
    1.6 STAKEHOLDERS
    1.7 SUMMARY OF CHANGES

2 RESEARCH METHODOLOGY (Page No. - 49)
    2.1 RESEARCH DATA
    2.2 RESEARCH DESIGN
          FIGURE 3 GLOBAL MARKET: RESEARCH DESIGN
           2.2.1 SECONDARY DATA
           2.2.2 PRIMARY DATA
                    FIGURE 4 PRIMARY SOURCES
                    2.2.2.1 Key data from primary sources
                    2.2.2.2 Insights from primary experts
                                FIGURE 5 BREAKDOWN OF PRIMARY INTERVIEWS: SUPPLY SIDE AND DEMAND SIDE PARTICIPANTS
                                FIGURE 6 BREAKDOWN OF PRIMARY INTERVIEWS: BY COMPANY TYPE,  DESIGNATION, AND REGION
    2.3 MARKET SIZE ESTIMATION
          FIGURE 7 SUPPLY SIDE MARKET SIZE ESTIMATION: REVENUE SHARE ANALYSIS
          FIGURE 8 TOP-DOWN APPROACH
    2.4 DATA TRIANGULATION
          FIGURE 9 DATA TRIANGULATION METHODOLOGY
    2.5 MARKET SHARE ESTIMATION
    2.6 RESEARCH ASSUMPTIONS
    2.7 LIMITATIONS
    2.8 RISK ASSESSMENT
          TABLE 2 LIMITATIONS AND ASSOCIATED RISKS

3 EXECUTIVE SUMMARY (Page No. - 60)
    FIGURE 10 PATIENT MONITORING DEVICES MARKET, BY PRODUCT,  2022 VS. 2027 (USD MILLION)
    FIGURE 11 GLOBAL MARKET, BY END USER,  2022 VS. 2027 (USD MILLION)
    FIGURE 12 ASIA PACIFIC MEDICAL MONITORING MARKET TO GROW AT THE HIGHEST CAGR DURING  THE FORECAST PERIOD

4 PREMIUM INSIGHTS (Page No. - 63)
    4.1 PATIENT MONITORING DEVICES MARKET OVERVIEW
          FIGURE 13 TECHNOLOGICAL ADVANCEMENTS AND RISING DISEASE INCIDENCE TO DRIVE DEMAND FOR PATIENT MONITORING DEVICES
    4.2 ASIA PACIFIC: MARKET SHARE,  BY COUNTRY & PRODUCT
          FIGURE 14 JAPAN HOLDS LARGEST HIGHEST SHARE OF APAC MARKET
    4.3 GLOBAL MARKET SHARE, BY END USER
          FIGURE 15 HOSPITALS TO ACCOUNT FOR LARGEST MARKET SHARE DURING 2022–2027
    4.4 GEOGRAPHICAL SNAPSHOT OF THE GLOBAL MARKET
          FIGURE 16 MEDICAL MONITORING MARKET IN CHINA TO GROW AT HIGHEST RATE DURING 2022–2027

5 MARKET OVERVIEW (Page No. - 66)
    5.1 INTRODUCTION
    5.2 MARKET DYNAMICS
          FIGURE 17 PATIENT MONITORING DEVICES MARKET: DRIVERS, RESTRAINTS, OPPORTUNITIES, AND CHALLENGES
           5.2.1 DRIVERS
                    5.2.1.1 Increasing technological advancements and innovations
                               5.2.1.1.1 Increased user-centric designs for wearable devices
                               5.2.1.1.2 Growing use of non-invasive hemodynamic monitoring
                               5.2.1.1.3 Rising use of digital data sensors
                               5.2.1.1.4 Growing use of mobile-grade EEG devices
                    5.2.1.2 Rising prevalence of chronic diseases
                    5.2.1.3 Availability of wireless monitoring devices
                                TABLE 3 RECENT PRODUCT INNOVATIONS IN GLOBAL MARKET
                    5.2.1.4 Growing preference for wearable patient monitoring devices, biosensors, and smart implants
                    5.2.1.5 Growing investments, funds, and grants in healthcare systems
           5.2.2 RESTRAINTS
                    5.2.2.1 Risks associated with invasive monitoring devices
                    5.2.2.2 High cost of patient monitoring products and inadequate reimbursement
           5.2.3 OPPORTUNITIES
                    5.2.3.1 Increasing demand for non-invasive and minimally invasive devices
                    5.2.3.2 Growing demand for patient monitoring devices in non-hospital settings
           5.2.4 CHALLENGES
                    5.2.4.1 Lack of skilled healthcare professionals
                    5.2.4.2 Increased pricing pressure on market players
    5.3 VALUE CHAIN ANALYSIS
          FIGURE 18 VALUE CHAIN ANALYSIS—MAXIMUM VALUE ADDED DURING  MANUFACTURING PHASE
    5.4 ECOSYSTEM ANALYSIS
    5.5 REGULATORY ANALYSIS
           5.5.1 NORTH AMERICA
                    5.5.1.1 US
                                TABLE 4 US FDA: MEDICAL DEVICE CLASSIFICATION
                                TABLE 5 US: MEDICAL DEVICE REGULATORY APPROVAL PROCESS
                    5.5.1.2 Canada
                                TABLE 6 CANADA: MEDICAL DEVICE REGULATORY APPROVAL PROCESS
                                FIGURE 19 CANADA: REGULATORY APPROVAL PROCESS FOR MEDICAL DEVICES
           5.5.2 EUROPE
                    FIGURE 20 EUROPE: REGULATORY APPROVAL PROCESS FOR MEDICAL DEVICES (MDR)
           5.5.3 ASIA PACIFIC
                    5.5.3.1 Japan
                                TABLE 7 JAPAN: MEDICAL DEVICE CLASSIFICATION UNDER PMDA
                    5.5.3.2 China
                                TABLE 8 CHINA: CLASSIFICATION OF MEDICAL DEVICES
                    5.5.3.3 India
    5.6 TRADE ANALYSIS
          TABLE 9 IMPORT DATA FOR PATIENT MONITORS (HS CODE 901890), BY COUNTRY,  2017- 2021 (USD MILLION)
          TABLE 10 EXPORT DATA FOR PATIENT MONITORS (HS CODE 901890), BY COUNTRY,  2017- 2021 (USD MILLION)
    5.7 KEY CONFERENCES AND EVENTS IN 2022–2023
          TABLE 11 DETAILED LIST OF MAJOR CONFERENCES AND EVENTS

6 PATIENT MONITORING DEVICES MARKET, BY PRODUCT (Page No. - 89)
    6.1 INTRODUCTION
          TABLE 12 GLOBAL MEDICAL MONITORING MARKET, BY PRODUCT, 2020–2027 (USD MILLION)
    6.2 BLOOD GLUCOSE MONITORING SYSTEMS
          TABLE 13 BLOOD GLUCOSE MONITORING SYSTEMS MARKET, BY TYPE, 2020–2027 (USD MILLION)
          TABLE 14 BLOOD GLUCOSE MONITORING SYSTEMS MARKET, BY REGION,  2020–2027 (USD MILLION)
          TABLE 15 BLOOD GLUCOSE MONITORING SYSTEMS MARKET, BY END USER,  2020–2027 (USD MILLION)
           6.2.1 SELF-MONITORING BLOOD GLUCOSE SYSTEMS
                    6.2.1.1 Rising adoption of integrated glucose monitoring systems to drive growth
                                TABLE 16 SELF-MONITORING BLOOD GLUCOSE SYSTEMS MARKET, BY REGION,  2020–2027 (USD MILLION)
           6.2.2 CONTINUOUS GLUCOSE MONITORING SYSTEMS
                    6.2.2.1 Product launches and evolving reimbursement scenarios for continuous monitoring systems to drive market growth
                                TABLE 17 CONTINUOUS GLUCOSE MONITORING SYSTEMS MARKET, BY REGION,  2020–2027 (USD MILLION)
    6.3 CARDIAC MONITORING DEVICES
          TABLE 18 CARDIAC MONITORING DEVICES MARKET, BY TYPE, 2020–2027 (USD MILLION)
          TABLE 19 CARDIAC MONITORING DEVICES MARKET, BY REGION, 2020–2027 (USD MILLION)
          TABLE 20 CARDIAC MONITORING DEVICES MARKET, BY END USER, 2020–2027 (USD MILLION)
           6.3.1 ECG DEVICES
                    6.3.1.1 Low cost and wide applications of ECG devices to drive market growth
                                TABLE 21 ECG DEVICES MARKET, BY REGION, 2020–2027 (USD MILLION)
           6.3.2 IMPLANTABLE LOOP RECORDERS
                    6.3.2.1 High cost and limited applications limit growth
                                TABLE 22 IMPLANTABLE LOOP RECORDERS MARKET, BY REGION, 2020–2027 (USD MILLION)
           6.3.3 EVENT MONITORS
                    6.3.3.1 Emergence of portable and wireless event monitors to drive market growth
                                TABLE 23 EVENT MONITORS MARKET, BY REGION, 2020–2027 (USD MILLION)
           6.3.4 MCT MONITORS
                    6.3.4.1 Availability of alternate technologies likely to hinder market growth
                                TABLE 24 MCT MONITORS MARKET, BY REGION, 2020–2027 (USD MILLION)
           6.3.5 SMART/WEARABLE ECG MONITORS
                    6.3.5.1 Need to minimize treatment costs for CVD patients to increase adoption of smart/wearable ECG monitors
                                TABLE 25 SMART/WEARABLE ECG MONITORS OFFERED BY MARKET PLAYERS
                                TABLE 26 SMART/WEARABLE ECG MONITORS MARKET, BY REGION, 2020–2027 (USD MILLION)
    6.4 MULTI-PARAMETER MONITORING DEVICES
          TABLE 27 MULTI-PARAMETER MONITORING DEVICES MARKET, BY TYPE,  2020–2027 (USD MILLION)
          TABLE 28 MULTI-PARAMETER MONITORING DEVICES MARKET, BY REGION,  2020–2027 (USD MILLION)
          TABLE 29 MULTI-PARAMETER MONITORING DEVICES MARKET, BY END USER,  2020–2027 (USD MILLION)
           6.4.1 LOW-ACUITY MONITORING DEVICES
                    6.4.1.1 Increasing adoption of low-acuity monitoring devices to improve care in general wards drives market growth
                                TABLE 30 LOW-ACUITY MONITORING DEVICES MARKET, BY REGION, 2020–2027 (USD MILLION)
           6.4.2 MID-ACUITY MONITORING DEVICES
                    6.4.2.1 Rising geriatric population is likely to increase market growth
                                TABLE 31 MID-ACUITY MONITORING DEVICES MARKET, BY REGION, 2020–2027 (USD MILLION)
           6.4.3 HIGH-ACUITY MONITORING DEVICES
                    6.4.3.1 Increasing partnerships between manufacturers and hospitals drive device sales
                                TABLE 32 HIGH-ACUITY MONITORING DEVICES MARKET, BY REGION, 2020–2027 (USD MILLION)
    6.5 RESPIRATORY MONITORING DEVICES
          TABLE 33 RESPIRATORY MONITORING DEVICES MARKET, BY TYPE, 2020–2027 (USD MILLION)
          TABLE 34 RESPIRATORY MONITORING DEVICES MARKET, BY REGION, 2020–2027 (USD MILLION)
          TABLE 35 RESPIRATORY MONITORING DEVICES MARKET, BY END USER,  2020–2027 (USD MILLION)
           6.5.1 PULSE OXIMETERS
                    6.5.1.1 Rising adoption of pulse oximeters in home care settings to drive market growth
                                TABLE 36 PULSE OXIMETERS MARKET, BY REGION, 2020–2027 (USD MILLION)
           6.5.2 SPIROMETERS
                    6.5.2.1 Technological advancements to increase the adoption of spirometers
                                TABLE 37 SPIROMETERS MARKET, BY REGION, 2020–2027 (USD MILLION)
           6.5.3 CAPNOGRAPHS
                    6.5.3.1 Product development and growing commercial acceptance to drive market growth
                                TABLE 38 CAPNOGRAPHS MARKET, BY REGION, 2020–2027 (USD MILLION)
           6.5.4 PEAK FLOW METERS
                    6.5.4.1 Low preference for peak flow meters due to high variability in measurements from different devices hinders market growth
                                TABLE 39 PEAK FLOW METERS MARKET, BY REGION, 2020–2027 (USD MILLION)
    6.6 TEMPERATURE MONITORING DEVICES
          TABLE 40 TEMPERATURE MONITORING DEVICES MARKET, BY TYPE, 2020–2027 (USD MILLION)
          TABLE 41 TEMPERATURE MONITORING DEVICES MARKET, BY REGION, 2020–2027 (USD MILLION)
          TABLE 42 TEMPERATURE MONITORING DEVICES MARKET, BY END USER,  2020–2027 (USD MILLION)
           6.6.1 HANDHELD TEMPERATURE MONITORING DEVICES
                    6.6.1.1 Advantages associated with handheld temperature monitoring devices to drive market growth
                                TABLE 43 HANDHELD TEMPERATURE MONITORING DEVICES OFFERED BY MARKET PLAYERS
                                TABLE 44 HANDHELD TEMPERATURE MONITORING DEVICES MARKET, BY REGION,  2020–2027 (USD MILLION)
           6.6.2                TABLE-TOP TEMPERATURE MONITORING DEVICES
                    6.6.2.1 Increasing risks associated with hypothermia during surgeries to drive demand for                                 TABLE-top devices
                                TABLE 45                                 TABLE-TOP TEMPERATURE MONITORING DEVICES MARKET, BY REGION,  2020–2027 (USD MILLION)
           6.6.3 WEARABLE CONTINUOUS MONITORING DEVICES
                    6.6.3.1 Versatile functionalities offered by wearable continuous monitoring devices to drive demand
                                TABLE 46 WEARABLE CONTINUOUS MONITORING DEVICES OFFERED BY MARKET PLAYERS
                                TABLE 47 WEARABLE CONTINUOUS MONITORING DEVICES MARKET, BY REGION,  2020–2027 (USD MILLION)
           6.6.4 INVASIVE TEMPERATURE MONITORING DEVICES
                    6.6.4.1 Risk of bloodstream infections associated with catheter usage hinders market for invasive devices
                                TABLE 48 INVASIVE TEMPERATURE MONITORING DEVICES MARKET, BY REGION,  2020–2027 (USD MILLION)
           6.6.5 SMART TEMPERATURE MONITORING PATCHES
                    6.6.5.1 Long-term monitoring capabilities of smart patches to drive market growth
                                TABLE 49 SMART TEMPERATURE MONITORING PATCHES OFFERED BY MARKET PLAYERS
                                TABLE 50 SMART TEMPERATURE MONITORING PATCHES MARKET, BY REGION,  2020–2027 (USD MILLION)
    6.7 HEMODYNAMIC/PRESSURE MONITORING DEVICES
          TABLE 51 HEMODYNAMIC/PRESSURE MONITORING DEVICES MARKET, BY TYPE,  2020–2027 (USD MILLION)
          TABLE 52 HEMODYNAMIC/PRESSURE MONITORING DEVICES MARKET, BY REGION,  2020–2027 (USD MILLION)
          TABLE 53 HEMODYNAMIC/PRESSURE MONITORING DEVICES MARKET, BY END USER,  2020–2027 (USD MILLION)
           6.7.1 HEMODYNAMIC MONITORS
                    6.7.1.1 Influx of VC funding to drive market growth
                                TABLE 54 HEMODYNAMIC MONITORS MARKET, BY REGION, 2020–2027 (USD MILLION)
           6.7.2 BLOOD PRESSURE MONITORS
                    6.7.2.1 Development of wearable blood pressure monitors to drive  market growth
                                TABLE 55 WEARABLE BLOOD PRESSURE MONITORS OFFERED BY MARKET PLAYERS
                                TABLE 56 BLOOD PRESSURE MONITORS MARKET, BY REGION, 2020–2027 (USD MILLION)
           6.7.3 DISPOSABLES
                    6.7.3.1 Growing number of surgical procedures to drive growth in disposables market
                                TABLE 57 HEMODYNAMIC/PRESSURE MONITORING DISPOSABLES MARKET, BY REGION,  2020–2027 (USD MILLION)
    6.8 FETAL & NEONATAL MONITORING DEVICES
          TABLE 58 FETAL & NEONATAL MONITORING DEVICES MARKET, BY TYPE,  2020–2027 (USD MILLION)
          TABLE 59 FETAL & NEONATAL MONITORING DEVICES MARKET, BY REGION,  2020–2027 (USD MILLION)
          TABLE 60 FETAL & NEONATAL MONITORING DEVICES MARKET, BY END USER,  2020–2027 (USD MILLION)
           6.8.1 FETAL MONITORING DEVICES
                    6.8.1.1 Rising prevalence of obstetric complications, growing pre-term birth rate drive market growth
                                TABLE 61 WEARABLE FETAL MONITORING & OBSTETRIC DEVICES OFFERED BY MARKET PLAYERS
                                TABLE 62 FETAL MONITORING DEVICES MARKET, BY REGION, 2020–2027 (USD MILLION)
           6.8.2 NEONATAL MONITORING DEVICES
                    6.8.2.1 Rising number of neonatal care facilities worldwide to drive market
                                TABLE 63 NEONATAL MONITORING DEVICES MARKET, BY REGION, 2020–2027 (USD MILLION)
    6.9 NEUROMONITORING DEVICES
          TABLE 64 NEUROMONITORING DEVICES MARKET, BY TYPE, 2020–2027 (USD MILLION)
          TABLE 65 NEUROMONITORING DEVICES MARKET, BY REGION, 2020–2027 (USD MILLION)
          TABLE 66 NEUROMONITORING DEVICES MARKET, BY END USER, 2020–2027 (USD MILLION)
           6.9.1 EEG MACHINES
                    6.9.1.1 Growing applications and technological advancements form key market growth drivers
                                TABLE 67 EEG MACHINES MARKET, BY REGION, 2020–2027 (USD MILLION)
           6.9.2 EMG MACHINES
                    6.9.2.1 Availability of reimbursements for EMG-assisted surgeries boosts product demand
                                TABLE 68 EMG MACHINES MARKET, BY REGION, 2020–2027 (USD MILLION)
           6.9.3 CEREBRAL OXIMETERS
                    6.9.3.1 Growing cases of hypoxia during surgical procedures to drive market growth
                                TABLE 69 CEREBRAL OXIMETERS MARKET, BY REGION, 2020–2027 (USD MILLION)
           6.9.4 ICP MONITORS
                    6.9.4.1 Growing incidence of post-surgical cerebrovascular complications and TBIs support adoption of ICP monitors
                                TABLE 70 ICP MONITORS MARKET, BY REGION, 2020–2027 (USD MILLION)
           6.9.5 MEG MACHINES
                    6.9.5.1 High implementation and maintenance costs of MEG devices likely to hinder market growth
                                TABLE 71 MEG MACHINES MARKET, BY REGION, 2020–2027 (USD MILLION)
           6.9.6 TCD MACHINES
                    6.9.6.1 Rising prevalence of strokes and cerebrovascular disorders will contribute to market growth
                                TABLE 72 TCD MACHINES MARKET, BY REGION, 2020–2027 (USD MILLION)
    6.10 WEIGHT MONITORING DEVICES
           TABLE 73 WEIGHT MONITORING DEVICES MARKET, BY TYPE, 2020–2027 (USD MILLION)
           TABLE 74 WEIGHT MONITORING DEVICES MARKET, BY REGION, 2020–2027 (USD MILLION)
           TABLE 75 WEIGHT MONITORING DEVICES MARKET, BY END USER, 2020–2027 (USD MILLION)
           6.10.1 DIGITAL WEIGHT MONITORING DEVICES
                    6.10.1.1 Consumer preference for digital scales—a key market driver
                                 TABLE 76 DIGITAL WEIGHT MONITORING DEVICES MARKET, BY REGION,  2020–2027 (USD MILLION)
           6.10.2 ANALOG WEIGHT MONITORING DEVICES
                    6.10.2.1 Rising prevalence of obesity and low cost of analog scales support market growth
                                 TABLE 77 ANALOG WEIGHT MONITORING DEVICES MARKET, BY REGION,  2020–2027 (USD MILLION)
    6.11 OTHER PATIENT MONITORING DEVICES
           TABLE 78 POLYSOMNOGRAPHY DEVICES OFFERED BY VARIOUS PLAYERS
           TABLE 79 WEARABLE SLEEP MONITORING DEVICES OFFERED BY MARKET PLAYERS
           TABLE 80 OTHER GLOBAL MARKET, BY REGION, 2020–2027 (USD MILLION)
           TABLE 81 OTHER PATIENT MONITORING DEVICES MARKET, BY END USER,  2020–2027 (USD MILLION)

7 PATIENT MONITORING DEVICES MARKET, BY END USER (Page No. - 143)
    7.1 INTRODUCTION
          TABLE 82 GLOBAL MEDICAL MONITORING MARKET, BY END USER, 2020–2027 (USD MILLION)
    7.2 HOSPITALS
           7.2.1 HOSPITALS TO DOMINATE END-USER MARKET
                    TABLE 83 GLOBAL MARKET FOR HOSPITALS, BY REGION,  2020–2027 (USD MILLION)
    7.3 AMBULATORY SURGERY CENTERS
           7.3.1 COST-EFFECTIVENESS AND CONVENIENCE DRIVE DEMAND FOR AMBULATORY CARE
                    TABLE 84 GLOBAL MARKET FOR AMBULATORY SURGERY CENTERS,  BY REGION, 2020–2027 (USD MILLION)
    7.4 HOME CARE SETTINGS
           7.4.1 REDUCED COST AND CONTINUOUS MONITORING OF VITAL INFORMATION IN HOME SETTINGS TO BOOST GROWTH
                    TABLE 85 GLOBAL MARKET FOR HOME CARE SETTINGS, BY REGION,  2020–2027 (USD MILLION)
    7.5 OTHER END USERS
          TABLE 86 GLOBAL MARKET FOR OTHER END USERS, BY REGION,  2020–2027 (USD MILLION)

8 PATIENT MONITORING DEVICES MARKET, BY REGION (Page No. - 149)
    8.1 INTRODUCTION
          TABLE 87 PATIENT MONITORING DEVICES MARKET, BY REGION, 2020–2027 (USD MILLION)
    8.2 NORTH AMERICA
          FIGURE 21 NORTH AMERICA: PATIENT MONITORING DEVICES MARKET SNAPSHOT
          TABLE 88 NORTH AMERICA: MARKET, BY COUNTRY,  2020–2027 (USD MILLION)
          TABLE 89 NORTH AMERICA: MARKET, BY PRODUCT,  2020–2027 (USD MILLION)
          TABLE 90 NORTH AMERICA: BLOOD GLUCOSE MONITORING SYSTEMS MARKET, BY TYPE,  2020–2027 (USD MILLION)
          TABLE 91 NORTH AMERICA: CARDIAC MONITORING DEVICES MARKET, BY TYPE,  2020–2027 (USD MILLION)
          TABLE 92 NORTH AMERICA: MULTI-PARAMETER MONITORING DEVICES MARKET, BY TYPE,  2020–2027 (USD MILLION)
          TABLE 93 NORTH AMERICA: RESPIRATORY MONITORING DEVICES MARKET, BY TYPE,  2020–2027 (USD MILLION)
          TABLE 94 NORTH AMERICA: TEMPERATURE MONITORING DEVICES MARKET, BY TYPE,  2020–2027 (USD MILLION)
          TABLE 95 NORTH AMERICA: HEMODYNAMIC/PRESSURE MONITORING DEVICES MARKET,  BY TYPE, 2020–2027 (USD MILLION)
          TABLE 96 NORTH AMERICA: FETAL & NEONATAL MONITORING DEVICES MARKET, BY TYPE,  2020–2027 (USD MILLION)
          TABLE 97 NORTH AMERICA: NEUROMONITORING DEVICES MARKET, BY TYPE,  2020–2027 (USD MILLION)
          TABLE 98 NORTH AMERICA: WEIGHT MONITORING DEVICES MARKET, BY TYPE,  2020–2027 (USD MILLION)
          TABLE 99 NORTH AMERICA: MARKET, BY END USER,  2020–2027 (USD MILLION)
           8.2.1 US
                    8.2.1.1 Growing number of FDA approvals for patient monitoring devices to support market growth
                                TABLE 100 VC FUNDING IN THE PATIENT MONITORING DEVICES MARKET IN THE US
                                TABLE 101 US: MARKET, BY PRODUCT, 2020–2027 (USD MILLION)
                                TABLE 102 US: BLOOD GLUCOSE MONITORING SYSTEMS MARKET, BY TYPE,  2020–2027 (USD MILLION)
                                TABLE 103 US: CARDIAC MONITORING DEVICES MARKET, BY TYPE, 2020–2027 (USD MILLION)
                                TABLE 104 US: MULTI-PARAMETER MONITORING DEVICES MARKET, BY TYPE,  2020–2027 (USD MILLION)
                                TABLE 105 US: RESPIRATORY MONITORING DEVICES MARKET, BY TYPE, 2020–2027 (USD MILLION)
                                TABLE 106 US: TEMPERATURE MONITORING DEVICES MARKET, BY TYPE, 2020–2027 (USD MILLION)
                                TABLE 107 US: HEMODYNAMIC/PRESSURE MONITORING DEVICES MARKET, BY TYPE,  2020–2027 (USD MILLION)
                                TABLE 108 US: FETAL & NEONATAL MONITORING DEVICES MARKET, BY TYPE,  2020–2027 (USD MILLION)
                                TABLE 109 US: NEUROMONITORING DEVICES MARKET, BY TYPE, 2020–2027 (USD MILLION)
                                TABLE 110 US: WEIGHT MONITORING DEVICES MARKET, BY TYPE, 2020–2027 (USD MILLION)
           8.2.2 CANADA
                    8.2.2.1 Growing public-private funding for research to drive market growth
                                TABLE 111 RESEARCH GRANTS IN THE PATIENT MONITORING DEVICES MARKET IN CANADA
                                TABLE 112 RECENT DEVELOPMENTS IN THE CANADIAN MARKET
                                TABLE 113 CANADA: MEDICAL MONITORING MARKET, BY PRODUCT,  2020–2027 (USD MILLION)
                                TABLE 114 CANADA: BLOOD GLUCOSE MONITORING SYSTEMS MARKET, BY TYPE,  2020–2027 (USD MILLION)
                                TABLE 115 CANADA: CARDIAC MONITORING DEVICES MARKET, BY TYPE,  2020–2027 (USD MILLION)
                                TABLE 116 CANADA: MULTI-PARAMETER MONITORING DEVICES MARKET, BY TYPE,  2020–2027 (USD MILLION)
                                TABLE 117 CANADA: RESPIRATORY MONITORING DEVICES MARKET, BY TYPE,  2020–2027 (USD MILLION)
                                TABLE 118 CANADA: TEMPERATURE MONITORING DEVICES MARKET, BY TYPE,  2020–2027 (USD MILLION)
                                TABLE 119 CANADA: HEMODYNAMIC/PRESSURE MONITORING DEVICES MARKET,  BY TYPE, 2020–2027 (USD MILLION)
                                TABLE 120 CANADA: FETAL & NEONATAL MONITORING DEVICES MARKET, BY TYPE,  2020–2027 (USD MILLION)
                                TABLE 121 CANADA: NEUROMONITORING DEVICES MARKET, BY TYPE,  2020–2027 (USD MILLION)
                                TABLE 122 CANADA: WEIGHT MONITORING DEVICES MARKET, BY TYPE,  2020–2027 (USD MILLION)
    8.3 EUROPE
          TABLE 123 PRODUCT APPROVALS IN THE EUROPEAN PATIENT MONITORING DEVICES MARKET
          TABLE 124 EUROPE: MARKET, BY COUNTRY,  2020–2027 (USD MILLION)
          TABLE 125 EUROPE: MARKET, BY PRODUCT,  2020–2027 (USD MILLION)
          TABLE 126 EUROPE: BLOOD GLUCOSE MONITORING SYSTEMS MARKET, BY TYPE,  2020–2027 (USD MILLION)
          TABLE 127 EUROPE: CARDIAC MONITORING DEVICES MARKET, BY TYPE,  2020–2027 (USD MILLION)
          TABLE 128 EUROPE: MULTI-PARAMETER MONITORING DEVICES MARKET, BY TYPE,  2020–2027 (USD MILLION)
          TABLE 129 EUROPE: RESPIRATORY MONITORING DEVICES MARKET, BY TYPE,  2020–2027 (USD MILLION)
          TABLE 130 EUROPE: TEMPERATURE MONITORING DEVICES MARKET, BY TYPE,  2020–2027 (USD MILLION)
          TABLE 131 EUROPE: HEMODYNAMIC/PRESSURE MONITORING DEVICES MARKET, BY TYPE,  2020–2027 (USD MILLION)
          TABLE 132 EUROPE: FETAL & NEONATAL MONITORING DEVICES MARKET, BY TYPE,  2020–2027 (USD MILLION)
          TABLE 133 EUROPE: NEUROMONITORING DEVICES MARKET, BY TYPE,  2020–2027 (USD MILLION)
          TABLE 134 EUROPE: WEIGHT MONITORING DEVICES MARKET, BY TYPE,  2020–2027 (USD MILLION)
          TABLE 135 EUROPE: MARKET, BY END USER,  2020–2027 (USD MILLION)
           8.3.1 GERMANY
                    8.3.1.1 Rising healthcare expenditure and manufacturer expansion to boost market growth
                                TABLE 136 GERMANY: PATIENT MONITORING DEVICES MARKET, BY PRODUCT,  2020–2027 (USD MILLION)
                                TABLE 137 GERMANY: BLOOD GLUCOSE MONITORING SYSTEMS MARKET, BY TYPE,  2020–2027 (USD MILLION)
                                TABLE 138 GERMANY: CARDIAC MONITORING DEVICES MARKET, BY TYPE,  2020–2027 (USD MILLION)
                                TABLE 139 GERMANY: MULTI-PARAMETER MONITORING DEVICES MARKET, BY TYPE,  2020–2027 (USD MILLION)
                                TABLE 140 GERMANY: RESPIRATORY MONITORING DEVICES MARKET, BY TYPE,  2020–2027 (USD MILLION)
                                TABLE 141 GERMANY: TEMPERATURE MONITORING DEVICES MARKET, BY TYPE,  2020–2027 (USD MILLION)
                                TABLE 142 GERMANY: HEMODYNAMIC/PRESSURE MONITORING DEVICES MARKET, BY TYPE,  2020–2027 (USD MILLION)
                                TABLE 143 GERMANY: FETAL & NEONATAL MONITORING DEVICES MARKET, BY TYPE,  2020–2027 (USD MILLION)
                                TABLE 144 GERMANY: NEUROMONITORING DEVICES MARKET, BY TYPE,  2020–2027 (USD MILLION)
                                TABLE 145 GERMANY: WEIGHT MONITORING DEVICES MARKET, BY TYPE,  2020–2027 (USD MILLION)
           8.3.2 UK
                    8.3.2.1 Increasing public & private investments contribute to market growth
                                TABLE 146 UK: MEDICAL MONITORING MARKET, BY PRODUCT, 2020–2027 (USD MILLION)
                                TABLE 147 UK: BLOOD GLUCOSE MONITORING SYSTEMS MARKET, BY TYPE,  2020–2027 (USD MILLION)
                                TABLE 148 UK: CARDIAC MONITORING DEVICES MARKET, BY TYPE,  2020–2027 (USD MILLION)
                                TABLE 149 UK: MULTI-PARAMETER MONITORING DEVICES MARKET, BY TYPE,  2020–2027 (USD MILLION)
                                TABLE 150 UK: RESPIRATORY MONITORING DEVICES MARKET, BY TYPE,  2020–2027 (USD MILLION)
                                TABLE 151 UK: TEMPERATURE MONITORING DEVICES MARKET, BY TYPE,  2020–2027 (USD MILLION)
                                TABLE 152 UK: HEMODYNAMIC/PRESSURE MONITORING DEVICES MARKET, BY TYPE,  2020–2027 (USD MILLION)
                                TABLE 153 UK: FETAL & NEONATAL MONITORING DEVICES MARKET, BY TYPE,  2020–2027 (USD MILLION)
                                TABLE 154 UK: NEUROMONITORING DEVICES MARKET, BY TYPE,  2020–2027 (USD MILLION)
                                TABLE 155 UK: WEIGHT MONITORING DEVICES MARKET, BY TYPE,  2020–2027 (USD MILLION)
           8.3.3 FRANCE
                    8.3.3.1 Statutory health insurance system to support market growth
                                TABLE 156 FRANCE: PATIENT MONITORING DEVICES MARKET, BY PRODUCT,  2020–2027 (USD MILLION)
                                TABLE 157 FRANCE: BLOOD GLUCOSE MONITORING SYSTEMS MARKET, BY TYPE,  2020–2027 (USD MILLION)
                                TABLE 158 FRANCE: CARDIAC MONITORING DEVICES MARKET, BY TYPE,  2020–2027 (USD MILLION)
                                TABLE 159 FRANCE: MULTI-PARAMETER MONITORING DEVICES MARKET, BY TYPE,  2020–2027 (USD MILLION)
                                TABLE 160 FRANCE: RESPIRATORY MONITORING DEVICES MARKET, BY TYPE,  2020–2027 (USD MILLION)
                                TABLE 161 FRANCE: TEMPERATURE MONITORING DEVICES MARKET, BY TYPE,  2020–2027 (USD MILLION)
                                TABLE 162 FRANCE: HEMODYNAMIC/PRESSURE MONITORING DEVICES MARKET, BY TYPE,  2020–2027 (USD MILLION)
                                TABLE 163 FRANCE: FETAL & NEONATAL MONITORING DEVICES MARKET, BY TYPE,  2020–2027 (USD MILLION)
                                TABLE 164 FRANCE: NEUROMONITORING DEVICES MARKET, BY TYPE,  2020–2027 (USD MILLION)
                                TABLE 165 FRANCE: WEIGHT MONITORING DEVICES MARKET, BY TYPE,  2020–2027 (USD MILLION)
           8.3.4 ITALY
                    8.3.4.1 Rising incidence of lifestyle diseases to drive adoption of patient monitoring devices
                                TABLE 166 ITALY: MARKET, BY PRODUCT,  2020–2027 (USD MILLION)
                                TABLE 167 ITALY: BLOOD GLUCOSE MONITORING SYSTEMS MARKET, BY TYPE,  2020–2027 (USD MILLION)
                                TABLE 168 ITALY: CARDIAC MONITORING DEVICES MARKET, BY TYPE,  2020–2027 (USD MILLION)
                                TABLE 169 ITALY: MULTI-PARAMETER MONITORING DEVICES MARKET, BY TYPE,  2020–2027 (USD MILLION)
                                TABLE 170 ITALY: RESPIRATORY MONITORING DEVICES MARKET, BY TYPE,  2020–2027 (USD MILLION)
                                TABLE 171 ITALY: TEMPERATURE MONITORING DEVICES MARKET, BY TYPE,  2020–2027 (USD MILLION)
                                TABLE 172 ITALY: HEMODYNAMIC/PRESSURE MONITORING DEVICES MARKET, BY TYPE,  2020–2027 (USD MILLION)
                                TABLE 173 ITALY: FETAL & NEONATAL MONITORING DEVICES MARKET, BY TYPE,  2020–2027 (USD MILLION)
                                TABLE 174 ITALY: NEUROMONITORING DEVICES MARKET, BY TYPE,  2020–2027 (USD MILLION)
                                TABLE 175 ITALY: WEIGHT MONITORING DEVICES MARKET, BY TYPE,  2020–2027 (USD MILLION)
           8.3.5 SPAIN
                    8.3.5.1 Growing number of surgical procedures to drive market growth  in Spain
                                TABLE 176 SPAIN: PATIENT MONITORING DEVICES MARKET, BY PRODUCT,  2020–2027 (USD MILLION)
                                TABLE 177 SPAIN: BLOOD GLUCOSE MONITORING SYSTEMS MARKET, BY TYPE,  2020–2027 (USD MILLION)
                                TABLE 178 SPAIN: CARDIAC MONITORING DEVICES MARKET, BY TYPE,  2020–2027 (USD MILLION)
                                TABLE 179 SPAIN: MULTI-PARAMETER MONITORING DEVICES MARKET, BY TYPE,  2020–2027 (USD MILLION)
                                TABLE 180 SPAIN: RESPIRATORY MONITORING DEVICES MARKET, BY TYPE,  2020–2027 (USD MILLION)
                                TABLE 181 SPAIN: TEMPERATURE MONITORING DEVICES MARKET, BY TYPE,  2020–2027 (USD MILLION)
                                TABLE 182 SPAIN: HEMODYNAMIC/PRESSURE MONITORING DEVICES MARKET, BY TYPE,  2020–2027 (USD MILLION)
                                TABLE 183 SPAIN: FETAL & NEONATAL MONITORING DEVICES MARKET, BY TYPE,  2020–2027 (USD MILLION)
                                TABLE 184 SPAIN: NEUROMONITORING DEVICES MARKET, BY TYPE,  2020–2027 (USD MILLION)
                                TABLE 185 SPAIN: WEIGHT MONITORING DEVICES MARKET, BY TYPE,  2020–2027 (USD MILLION)
           8.3.6 REST OF EUROPE
                    TABLE 186 KEY MERGERS & ACQUISITIONS AND PARTNERSHIPS IN THE PATIENT MONITORING DEVICES MARKET IN THE ROE
                    TABLE 187 ROE: MEDICAL MONITORING MARKET, BY PRODUCT, 2020–2027 (USD MILLION)
                    TABLE 188 ROE: BLOOD GLUCOSE MONITORING SYSTEMS MARKET, BY TYPE,  2020–2027 (USD MILLION)
                    TABLE 189 ROE: CARDIAC MONITORING DEVICES MARKET, BY TYPE,  2020–2027 (USD MILLION)
                    TABLE 190 ROE: MULTI-PARAMETER MONITORING DEVICES MARKET, BY TYPE,  2020–2027 (USD MILLION)
                    TABLE 191 ROE: RESPIRATORY MONITORING DEVICES MARKET, BY TYPE,  2020–2027 (USD MILLION)
                    TABLE 192 ROE: TEMPERATURE MONITORING DEVICES MARKET, BY TYPE,  2020–2027 (USD MILLION)
                    TABLE 193 ROE: HEMODYNAMIC/PRESSURE MONITORING DEVICES MARKET, BY TYPE,  2020–2027 (USD MILLION)
                    TABLE 194 ROE: FETAL & NEONATAL MONITORING DEVICES MARKET, BY TYPE,  2020–2027 (USD MILLION)
                    TABLE 195 ROE: NEUROMONITORING DEVICES MARKET, BY TYPE,  2020–2027 (USD MILLION)
                    TABLE 196 ROE: WEIGHT MONITORING DEVICES MARKET, BY TYPE,  2020–2027 (USD MILLION)
    8.4 ASIA PACIFIC
          FIGURE 22 ASIA PACIFIC: PATIENT MONITORING DEVICES MARKET SNAPSHOT
          TABLE 197 ASIA PACIFIC: MARKET, BY COUNTRY,  2020–2027 (USD MILLION)
          TABLE 198 ASIA PACIFIC: MEDICAL MONITORING MARKET, BY PRODUCT,  2020–2027 (USD MILLION)
          TABLE 199 ASIA PACIFIC: BLOOD GLUCOSE MONITORING SYSTEMS MARKET, BY TYPE,  2020–2027 (USD MILLION)
          TABLE 200 ASIA PACIFIC: CARDIAC MONITORING DEVICES MARKET, BY TYPE,  2020–2027 (USD MILLION)
          TABLE 201 ASIA PACIFIC: MULTI-PARAMETER MONITORING DEVICES MARKET, BY TYPE,  2020–2027 (USD MILLION)
          TABLE 202 ASIA PACIFIC: RESPIRATORY MONITORING DEVICES MARKET, BY TYPE,  2020–2027 (USD MILLION)
          TABLE 203 ASIA PACIFIC: TEMPERATURE MONITORING DEVICES MARKET, BY TYPE,  2020–2027 (USD MILLION)
          TABLE 204 ASIA PACIFIC: HEMODYNAMIC/PRESSURE MONITORING DEVICES MARKET, BY TYPE, 2020–2027 (USD MILLION)
          TABLE 205 ASIA PACIFIC: FETAL & NEONATAL MONITORING DEVICES MARKET, BY TYPE,  2020–2027 (USD MILLION)
          TABLE 206 ASIA PACIFIC: NEUROMONITORING DEVICES MARKET, BY TYPE,  2020–2027 (USD MILLION)
          TABLE 207 ASIA PACIFIC: WEIGHT MONITORING DEVICES MARKET, BY TYPE,  2020–2027 (USD MILLION)
          TABLE 208 ASIA PACIFIC: MARKET, BY END USER,  2020–2027 (USD MILLION)
           8.4.1 JAPAN
                    8.4.1.1 Large geriatric population and favorable reimbursement scenario to support market growth
                                TABLE 209 RECENT DEVELOPMENTS IN THE PATIENT MONITORING DEVICES MARKET IN JAPAN
                                TABLE 210 JAPAN: MARKET, BY PRODUCT,  2020–2027 (USD MILLION)
                                TABLE 211 JAPAN: BLOOD GLUCOSE MONITORING SYSTEMS MARKET, BY TYPE,  2020–2027 (USD MILLION)
                                TABLE 212 JAPAN: CARDIAC MONITORING DEVICES MARKET, BY TYPE,  2020–2027 (USD MILLION)
                                TABLE 213 JAPAN: MULTI-PARAMETER MONITORING DEVICES MARKET, BY TYPE,  2020–2027 (USD MILLION)
                                TABLE 214 JAPAN: RESPIRATORY MONITORING DEVICES MARKET, BY TYPE,  2020–2027 (USD MILLION)
                                TABLE 215 JAPAN: TEMPERATURE MONITORING DEVICES MARKET, BY TYPE,  2020–2027 (USD MILLION)
                                TABLE 216 JAPAN: HEMODYNAMIC/PRESSURE MONITORING DEVICES MARKET, BY TYPE,  2020–2027 (USD MILLION)
                                TABLE 217 JAPAN: FETAL & NEONATAL MONITORING DEVICES MARKET, BY TYPE,  2020–2027 (USD MILLION)
                                TABLE 218 JAPAN: NEUROMONITORING DEVICES MARKET, BY TYPE,  2020–2027 (USD MILLION)
                                TABLE 219 JAPAN: WEIGHT MONITORING DEVICES MARKET, BY TYPE,  2020–2027 (USD MILLION)
           8.4.2 CHINA
                    8.4.2.1 Growing focus of local and international market players on  this market
                                TABLE 220 RECENT DEVELOPMENTS IN THE PATIENT MONITORING DEVICES MARKET IN CHINA
                                TABLE 221 CHINA: MARKET, BY PRODUCT,  2020–2027 (USD MILLION)
                                TABLE 222 CHINA: BLOOD GLUCOSE MONITORING SYSTEMS MARKET, BY TYPE,  2020–2027 (USD MILLION)
                                TABLE 223 CHINA: CARDIAC MONITORING DEVICES MARKET, BY TYPE,  2020–2027 (USD MILLION)
                                TABLE 224 CHINA: MULTI-PARAMETER MONITORING DEVICES MARKET, BY TYPE,  2020–2027 (USD MILLION)
                                TABLE 225 CHINA: RESPIRATORY MONITORING DEVICES MARKET, BY TYPE,  2020–2027 (USD MILLION)
                                TABLE 226 CHINA: TEMPERATURE MONITORING DEVICES MARKET, BY TYPE,  2020–2027 (USD MILLION)
                                TABLE 227 CHINA: HEMODYNAMIC/PRESSURE MONITORING DEVICES MARKET, BY TYPE,  2020–2027 (USD MILLION)
                                TABLE 228 CHINA: FETAL & NEONATAL MONITORING DEVICES MARKET, BY TYPE,  2020–2027 (USD MILLION)
                                TABLE 229 CHINA: NEUROMONITORING DEVICES MARKET, BY TYPE,  2020–2027 (USD MILLION)
                                TABLE 230 CHINA: WEIGHT MONITORING DEVICES MARKET, BY TYPE,  2020–2027 (USD MILLION)
           8.4.3 INDIA
                    8.4.3.1 Increasing government-implemented healthcare initiatives to support market growth
                                TABLE 231 INDIA: MEDICAL MONITORING MARKET, BY PRODUCT,  2020–2027 (USD MILLION)
                                TABLE 232 INDIA: BLOOD GLUCOSE MONITORING SYSTEMS MARKET, BY TYPE,  2020–2027 (USD MILLION)
                                TABLE 233 INDIA: CARDIAC MONITORING DEVICES MARKET, BY TYPE,  2020–2027 (USD MILLION)
                                TABLE 234 INDIA: MULTI-PARAMETER MONITORING DEVICES MARKET, BY TYPE,  2020–2027 (USD MILLION)
                                TABLE 235 INDIA: RESPIRATORY MONITORING DEVICES MARKET, BY TYPE,  2020–2027 (USD MILLION)
                                TABLE 236 INDIA: TEMPERATURE MONITORING DEVICES MARKET, BY TYPE,  2020–2027 (USD MILLION)
                                TABLE 237 INDIA: HEMODYNAMIC/PRESSURE MONITORING DEVICES MARKET, BY TYPE,  2020–2027 (USD MILLION)
                                TABLE 238 INDIA: FETAL & NEONATAL MONITORING DEVICES MARKET, BY TYPE,  2020–2027 (USD MILLION)
                                TABLE 239 INDIA: NEUROMONITORING DEVICES MARKET, BY TYPE,  2020–2027 (USD MILLION)
                                TABLE 240 INDIA: WEIGHT MONITORING DEVICES MARKET, BY TYPE,  2020–2027 (USD MILLION)
           8.4.4 AUSTRALIA
                    8.4.4.1 R&D Tax Incentive Program to support market growth
                                TABLE 241 AUSTRALIA: PATIENT MONITORING DEVICES MARKET, BY PRODUCT,  2020–2027 (USD MILLION)
                                TABLE 242 AUSTRALIA: BLOOD GLUCOSE MONITORING SYSTEMS MARKET, BY TYPE,  2020–2027 (USD MILLION)
                                TABLE 243 AUSTRALIA: CARDIAC MONITORING DEVICES MARKET, BY TYPE,  2020–2027 (USD MILLION)
                                TABLE 244 AUSTRALIA: MULTI-PARAMETER MONITORING DEVICES MARKET, BY TYPE,  2020–2027 (USD MILLION)
                                TABLE 245 AUSTRALIA: RESPIRATORY MONITORING DEVICES MARKET, BY TYPE,  2020–2027 (USD MILLION)
                                TABLE 246 AUSTRALIA: TEMPERATURE MONITORING DEVICES MARKET, BY TYPE,  2020–2027 (USD MILLION)
                                TABLE 247 AUSTRALIA: HEMODYNAMIC/PRESSURE MONITORING DEVICES MARKET, BY TYPE, 2020–2027 (USD MILLION)
                                TABLE 248 AUSTRALIA: FETAL & NEONATAL MONITORING DEVICES MARKET, BY TYPE,  2020–2027 (USD MILLION)
                                TABLE 249 AUSTRALIA: NEUROMONITORING DEVICES MARKET, BY TYPE,  2020–2027 (USD MILLION)
                                TABLE 250 AUSTRALIA: WEIGHT MONITORING DEVICES MARKET, BY TYPE,  2020–2027 (USD MILLION)
           8.4.5 SOUTH KOREA
                    8.4.5.1 Supportive government initiatives to drive market growth
                                TABLE 251 SOUTH KOREA: MEDICAL MONITORING MARKET, BY PRODUCT,  2020–2027 (USD MILLION)
                                TABLE 252 SOUTH KOREA: BLOOD GLUCOSE MONITORING SYSTEMS MARKET, BY TYPE,  2020–2027 (USD MILLION)
                                TABLE 253 SOUTH KOREA: CARDIAC MONITORING DEVICES MARKET, BY TYPE,  2020–2027 (USD MILLION)
                                TABLE 254 SOUTH KOREA: MULTI-PARAMETER MONITORING DEVICES MARKET, BY TYPE,  2020–2027 (USD MILLION)
                                TABLE 255 SOUTH KOREA: RESPIRATORY MONITORING DEVICES MARKET, BY TYPE,  2020–2027 (USD MILLION)
                                TABLE 256 SOUTH KOREA: TEMPERATURE MONITORING DEVICES MARKET, BY TYPE,  2020–2027 (USD MILLION)
                                TABLE 257 SOUTH KOREA: HEMODYNAMIC/PRESSURE MONITORING DEVICES MARKET, BY TYPE, 2020–2027 (USD MILLION)
                                TABLE 258 SOUTH KOREA: FETAL & NEONATAL MONITORING DEVICES MARKET, BY TYPE,  2020–2027 (USD MILLION)
                                TABLE 259 SOUTH KOREA: NEUROMONITORING DEVICES MARKET, BY TYPE,  2020–2027 (USD MILLION)
                                TABLE 260 SOUTH KOREA: WEIGHT MONITORING DEVICES MARKET, BY TYPE,  2020–2027 (USD MILLION)
           8.4.6 REST OF ASIA PACIFIC
                    TABLE 261 RECENT DEVELOPMENTS IN THE PATIENT MONITORING DEVICES MARKET IN ROAPAC
                    TABLE 262 ROAPAC: MARKET, BY PRODUCT,  2020–2027 (USD MILLION)
                    TABLE 263 ROAPAC: BLOOD GLUCOSE MONITORING SYSTEMS MARKET, BY TYPE,  2020–2027 (USD MILLION)
                    TABLE 264 ROAPAC: CARDIAC MONITORING DEVICES MARKET, BY TYPE,  2020–2027 (USD MILLION)
                    TABLE 265 ROAPAC: MULTI-PARAMETER MONITORING DEVICES MARKET, BY TYPE,  2020–2027 (USD MILLION)
                    TABLE 266 ROAPAC: RESPIRATORY MONITORING DEVICES MARKET, BY TYPE,  2020–2027 (USD MILLION)
                    TABLE 267 ROAPAC: TEMPERATURE MONITORING DEVICES MARKET, BY TYPE,  2020–2027 (USD MILLION)
                    TABLE 268 ROAPAC: HEMODYNAMIC/PRESSURE MONITORING DEVICES MARKET, BY TYPE,  2020–2027 (USD MILLION)
                    TABLE 269 ROAPAC: FETAL & NEONATAL MONITORING DEVICES MARKET, BY TYPE,  2020–2027 (USD MILLION)
                    TABLE 270 ROAPAC: NEUROMONITORING DEVICES MARKET, BY TYPE,  2020–2027 (USD MILLION)
                    TABLE 271 ROAPAC: WEIGHT MONITORING DEVICES MARKET, BY TYPE,  2020–2027 (USD MILLION)
    8.5 LATIN AMERICA
          TABLE 272 LATAM: PATIENT MONITORING DEVICES MARKET, BY COUNTRY,  2020–2027 (USD MILLION)
          TABLE 273 LATAM: MARKET, BY PRODUCT,  2020–2027 (USD MILLION)
          TABLE 274 LATAM: BLOOD GLUCOSE MONITORING SYSTEMS MARKET, BY TYPE,  2020–2027 (USD MILLION)
          TABLE 275 LATAM: CARDIAC MONITORING DEVICES MARKET, BY TYPE, 2020–2027 (USD MILLION)
          TABLE 276 LATAM: MULTI-PARAMETER MONITORING DEVICES MARKET, BY TYPE,  2020–2027 (USD MILLION)
          TABLE 277 LATAM: RESPIRATORY MONITORING DEVICES MARKET, BY TYPE,  2020–2027 (USD MILLION)
          TABLE 278 LATAM: TEMPERATURE MONITORING DEVICES MARKET, BY TYPE,  2020–2027 (USD MILLION)
          TABLE 279 LATAM: HEMODYNAMIC/PRESSURE MONITORING DEVICES MARKET, BY TYPE,  2020–2027 (USD MILLION)
          TABLE 280 LATAM: FETAL & NEONATAL MONITORING DEVICES MARKET, BY TYPE,  2020–2027 (USD MILLION)
          TABLE 281 LATAM: NEUROMONITORING DEVICES MARKET, BY TYPE,  2020–2027 (USD MILLION)
          TABLE 282 LATAM: WEIGHT MONITORING DEVICES MARKET, BY TYPE,  2020–2027 (USD MILLION)
          TABLE 283 LATAM: MEDICAL MONITORING MARKET, BY END USER,  2020–2027 (USD MILLION)
           8.5.1 BRAZIL
                    8.5.1.1 Brazil to dominate LATAM market
                                TABLE 284 BRAZIL: PATIENT MONITORING DEVICES MARKET, BY PRODUCT,  2020–2027 (USD MILLION)
                                TABLE 285 BRAZIL: BLOOD GLUCOSE MONITORING SYSTEMS MARKET, BY TYPE,  2020–2027 (USD MILLION)
                                TABLE 286 BRAZIL: CARDIAC MONITORING DEVICES MARKET, BY TYPE, 2020–2027 (USD MILLION)
                                TABLE 287 BRAZIL: MULTI-PARAMETER MONITORING DEVICES MARKET, BY TYPE,  2020–2027 (USD MILLION)
                                TABLE 288 BRAZIL: RESPIRATORY MONITORING DEVICES MARKET, BY TYPE,  2020–2027 (USD MILLION)
                                TABLE 289 BRAZIL: TEMPERATURE MONITORING DEVICES MARKET, BY TYPE,  2020–2027 (USD MILLION)
                                TABLE 290 BRAZIL: HEMODYNAMIC/PRESSURE MONITORING DEVICES MARKET, BY TYPE,  2020–2027 (USD MILLION)
                                TABLE 291 BRAZIL: FETAL & NEONATAL MONITORING DEVICES MARKET, BY TYPE,  2020–2027 (USD MILLION)
                                TABLE 292 BRAZIL: NEUROMONITORING DEVICES MARKET, BY TYPE, 2020–2027 (USD MILLION)
                                TABLE 293 BRAZIL: WEIGHT MONITORING DEVICES MARKET, BY TYPE, 2020–2027 (USD MILLION)
           8.5.2 MEXICO
                    8.5.2.1 Favorable investment scenario for medical device manufacturers to drive market growth
                                TABLE 294 MEXICO: MEDICAL MONITORING MARKET, BY PRODUCT,  2020–2027 (USD MILLION)
                                TABLE 295 MEXICO: BLOOD GLUCOSE MONITORING SYSTEMS MARKET, BY TYPE,  2020–2027 (USD MILLION)
                                TABLE 296 MEXICO: CARDIAC MONITORING DEVICES MARKET, BY TYPE, 2020–2027 (USD MILLION)
                                TABLE 297 MEXICO: MULTI-PARAMETER MONITORING DEVICES MARKET, BY TYPE,  2020–2027 (USD MILLION)
                                TABLE 298 MEXICO: RESPIRATORY MONITORING DEVICES MARKET, BY TYPE,  2020–2027 (USD MILLION)
                                TABLE 299 MEXICO: TEMPERATURE MONITORING DEVICES MARKET, BY TYPE,  2020–2027 (USD MILLION)
                                TABLE 300 MEXICO: HEMODYNAMIC/PRESSURE MONITORING DEVICES MARKET, BY TYPE,  2020–2027 (USD MILLION)
                                TABLE 301 MEXICO: FETAL & NEONATAL MONITORING DEVICES MARKET, BY TYPE,  2020–2027 (USD MILLION)
                                TABLE 302 MEXICO: NEUROMONITORING DEVICES MARKET, BY TYPE, 2020–2027 (USD MILLION)
                                TABLE 303 MEXICO: WEIGHT MONITORING DEVICES MARKET, BY TYPE, 2020–2027 (USD MILLION)
           8.5.3 REST OF LATIN AMERICA
                    TABLE 304 ROLATAM: PATIENT MONITORING DEVICES MARKET, BY PRODUCT,  2020–2027 (USD MILLION)
                    TABLE 305 ROLATAM: BLOOD GLUCOSE MONITORING SYSTEMS MARKET, BY TYPE,  2020–2027 (USD MILLION)
                    TABLE 306 ROLATAM: CARDIAC MONITORING DEVICES MARKET, BY TYPE,  2020–2027 (USD MILLION)
                    TABLE 307 ROLATAM: MULTI-PARAMETER MONITORING DEVICES MARKET, BY TYPE,  2020–2027 (USD MILLION)
                    TABLE 308 ROLATAM: RESPIRATORY MONITORING DEVICES MARKET, BY TYPE,  2020–2027 (USD MILLION)
                    TABLE 309 ROLATAM: TEMPERATURE MONITORING DEVICES MARKET, BY TYPE,  2020–2027 (USD MILLION)
                    TABLE 310 ROLATAM: HEMODYNAMIC/PRESSURE MONITORING DEVICES MARKET,  BY TYPE, 2020–2027 (USD MILLION)
                    TABLE 311 ROLATAM: FETAL & NEONATAL MONITORING DEVICES MARKET, BY TYPE,  2020–2027 (USD MILLION)
                    TABLE 312 ROLATAM: NEUROMONITORING DEVICES MARKET, BY TYPE, 2020–2027 (USD MILLION)
                    TABLE 313 ROLATAM: WEIGHT MONITORING DEVICES MARKET, BY TYPE, 2020–2027 (USD MILLION)
    8.6 MIDDLE EAST & AFRICA
           8.6.1 AWARENESS INITIATIVES TO DRIVE ADOPTION OF PATIENT MONITORING DEVICES IN THE REGION
                    TABLE 314 MEA: MEDICAL MONITORING MARKET, BY PRODUCT, 2020–2027 (USD MILLION)
                    TABLE 315 MEA: BLOOD GLUCOSE MONITORING SYSTEMS MARKET, BY TYPE,  2020–2027 (USD MILLION)
                    TABLE 316 MEA: CARDIAC MONITORING DEVICES MARKET, BY TYPE, 2020–2027 (USD MILLION)
                    TABLE 317 MEA: MULTI-PARAMETER MONITORING DEVICES MARKET, BY TYPE,  2020–2027 (USD MILLION)
                    TABLE 318 MEA: RESPIRATORY MONITORING DEVICES MARKET, BY TYPE,  2020–2027 (USD MILLION)
                    TABLE 319 MEA: TEMPERATURE MONITORING DEVICES MARKET, BY TYPE,  2020–2027 (USD MILLION)
                    TABLE 320 MEA: HEMODYNAMIC/PRESSURE MONITORING DEVICES MARKET, BY TYPE,  2020–2027 (USD MILLION)
                    TABLE 321 MEA: FETAL & NEONATAL MONITORING DEVICES MARKET, BY TYPE,  2020–2027 (USD MILLION)
                    TABLE 322 MEA: NEUROMONITORING DEVICES MARKET, BY TYPE, 2020–2027 (USD MILLION)
                    TABLE 323 MEA: WEIGHT MONITORING DEVICES MARKET, BY TYPE, 2020–2027 (USD MILLION)
                    TABLE 324 MEA: PATIENT MONITORING DEVICES MARKET, BY END USER,  2020–2027 (USD MILLION)

9 COMPETITIVE LANDSCAPE (Page No. - 285)
    9.1 OVERVIEW
    9.2 KEY PLAYER STRATEGIES/RIGHT TO WIN
           9.2.1 OVERVIEW OF STRATEGIES ADOPTED BY PLAYERS IN PATIENT MONITORING DEVICES MARKET
    9.3 REVENUE SHARE ANALYSIS OF TOP MARKET PLAYERS
          FIGURE 23 REVENUE ANALYSIS OF KEY PLAYERS IN GLOBAL MARKET
    9.4 COMPETITIVE BENCHMARKING OF TOP 26 PLAYERS
          TABLE 325 OVERALL COMPANY FOOTPRINT
          TABLE 326 COMPANY PRODUCT FOOTPRINT
          TABLE 327 COMPANY END-USER FOOTPRINT
          TABLE 328 COMPANY REGIONAL FOOTPRINT
    9.5 COMPANY EVALUATION QUADRANT
           9.5.1 STARS
           9.5.2 EMERGING LEADERS
           9.5.3 PERVASIVE PLAYERS
           9.5.4 PARTICIPANTS
                    FIGURE 24 PATIENT MONITORING DEVICES: COMPETITIVE LEADERSHIP MAPPING (2021)
    9.6 COMPANY EVALUATION QUADRANT FOR START-UPS/SMES
           9.6.1 PROGRESSIVE MEDICAL MONITORING COMPANIES
           9.6.2 DYNAMIC & TOP PATIENT & MEDICAL MONIROTING COMPANIES
           9.6.3 STARTING BLOCKS
           9.6.4 RESPONSIVE & TOP PATIENT & MEDICAL MONIROTING COMPANIES
                    FIGURE 25 GLOBAL MARKET: COMPETITIVE LEADERSHIP MAPPING FOR STARTUP MEDICAL MONITORING COMPANIES (2021)
    9.7 KEY STAKEHOLDERS AND BUYING CRITERIA
           9.7.1 KEY STAKEHOLDERS IN BUYING PROCESS
                    FIGURE 26 INFLUENCE OF STAKEHOLDERS IN BUYING PROCESS FOR  PATIENT MONITORING DEVICES
                    TABLE 329 INFLUENCE OF STAKEHOLDERS IN BUYING PROCESS FOR PATIENT MONITORING DEVICES
           9.7.2 BUYING CRITERIA
                    FIGURE 27 KEY BUYING CRITERIA FOR PATIENT MONITORING DEVICES
                    TABLE 330 KEY BUYING CRITERIA FOR PATIENT MONITORING DEVICES
    9.8 MARKET RANKING ANALYSIS
          FIGURE 28 LEADING PLAYERS IN PATIENT MONITORING DEVICES MARKET (2021)
    9.9 COMPETITIVE SCENARIO
           9.9.1 PRODUCT LAUNCHES & APPROVALS
                    TABLE 331 PRODUCT LAUNCHES & APPROVALS, 2020–2022
           9.9.2 ALLIANCES, PARTNERSHIPS, AGREEMENTS, AND COLLABORATIONS
                    TABLE 332 ALLIANCES, PARTNERSHIPS, AGREEMENTS, AND COLLABORATIONS, 2019–2020
           9.9.3 MERGERS & ACQUISITIONS
                    TABLE 333 MERGERS & ACQUISITIONS, 2017–2020
           9.9.4 EXPANSIONS
                    TABLE 334 EXPANSIONS, 2017–2020

10 COMPANY PROFILES (Page No. - 309)
     10.1 KEY PLAYERS
(Business Overview, Products Offered, Recent Developments, and MnM View (Key strengths/Right to Win, Strategic Choices Made, and Weaknesses and Competitive Threats))*
             10.1.1 GE HEALTHCARE
                        TABLE 335 GE HEALTHCARE: COMPANY OVERVIEW
                        FIGURE 29 GE HEALTHCARE: COMPANY SNAPSHOT (2021)
             10.1.2 MEDTRONIC PLC
                        TABLE 336 MEDTRONIC PLC: COMPANY OVERVIEW
                        FIGURE 30 MEDTRONIC PLC: COMPANY SNAPSHOT (2021)
             10.1.3 KONINKLIJKE PHILIPS N.V.
                        TABLE 337 KONINKLIJKE PHILIPS: COMPANY OVERVIEW
                        FIGURE 31 KONINKLIJKE PHILIPS: COMPANY SNAPSHOT (2021)
             10.1.4 ABBOTT LABORATORIES
                        TABLE 338 ABBOTT LABORATORIES: COMPANY OVERVIEW
                        FIGURE 32 ABBOTT LABORATORIES: COMPANY SNAPSHOT (2021)
             10.1.5 NIHON KOHDEN CORPORATION
                        TABLE 339 NIHON KOHDEN CORPORATION: COMPANY OVERVIEW
                        FIGURE 33 NIHON KOHDEN CORPORATION: COMPANY SNAPSHOT (2021)
             10.1.6 MASIMO CORPORATION
                        TABLE 340 MASIMO CORPORATION: COMPANY OVERVIEW
                        FIGURE 34 MASIMO CORPORATION: COMPANY SNAPSHOT (2021)
             10.1.7 OMRON CORPORATION
                        TABLE 341 OMRON CORPORATION: COMPANY OVERVIEW
                        FIGURE 35 OMRON CORPORATION: COMPANY SNAPSHOT (2021)
             10.1.8 EDWARDS LIFESCIENCES CORPORATION
                        TABLE 342 EDWARDS LIFESCIENCES CORPORATION: COMPANY OVERVIEW
                        FIGURE 36 EDWARDS LIFESCIENCES CORPORATION: COMPANY SNAPSHOT (2021)
             10.1.9 HILL-ROM HOLDINGS
                        TABLE 343 HILL-ROM HOLDINGS: COMPANY OVERVIEW
                        FIGURE 37 HILL-ROM HOLDINGS, INC.: COMPANY SNAPSHOT (2021)
             10.1.10 DRÄGERWERK AG & CO. KGAA
                        TABLE 344 DRÄGERWERK AG & CO. KGAA: COMPANY OVERVIEW
                        FIGURE 38 DRÄGERWERK: COMPANY SNAPSHOT (2021)
             10.1.11 NATUS MEDICAL
                        TABLE 345 NATUS MEDICAL: COMPANY OVERVIEW
                        FIGURE 39 NATUS MEDICAL: COMPANY SNAPSHOT (2021)
             10.1.12 GETINGE AB
                        TABLE 346 GETINGE AB: COMPANY OVERVIEW
                        FIGURE 40 GETINGE AB: COMPANY SNAPSHOT (2021)
             10.1.13 COMPUMEDICS LIMITED
                        TABLE 347 COMPUMEDICS LIMITED: COMPANY OVERVIEW
                        FIGURE 41 COMPUMEDICS LIMITED: COMPANY SNAPSHOT (2021)
             10.1.14 SHENZHEN MINDRAY BIO-MEDICAL ELECTRONICS
                        TABLE 348 SHENZHEN MINDRAY BIO-MEDICAL ELECTRONICS: COMPANY OVERVIEW
             10.1.15 NONIN
                        TABLE 349 NONIN: COMPANY OVERVIEW
             10.1.16 RECENT DEVELOPMENTS
     10.2 OTHER MEDICAL MONITORING COMPANIES
             10.2.1 BIOTRONIK
             10.2.2 BOSTON SCIENTIFIC CORPORATION
             10.2.3 BIOTELEMETRY
             10.2.4 SCHILLER
             10.2.5 DEXCOM
             10.2.6 SENSEONICS
             10.2.7 CARDIOMO
             10.2.8 VITLS
             10.2.9 NETEERA
             10.2.10 TYTO CARE
             10.2.11 QARDIO
             10.2.12 EJENTA
             10.2.13 VIVIFY HEALTH
             10.2.14 NOTEWORTH
             10.2.15 IRHYTHM TECHNOLOGIES, INC.

*Details on Business Overview, Products Offered, Recent Developments, and MnM View (Key strengths/Right to Win, Strategic Choices Made, and Weaknesses and Competitive Threats) might not be captured in case of unlisted top patient & medical monitoring companies.

11 APPENDIX (Page No. - 384)
     11.1 DISCUSSION GUIDE
     11.2 KNOWLEDGESTORE: MARKETSANDMARKETS’  SUBSCRIPTION PORTAL
     11.3 AVAILABLE CUSTOMIZATION OPTIONS
     11.4 RELATED REPORTS
     11.5 AUTHOR DETAILS

This study involved the extensive use of both primary and secondary sources. The research process involved the study of various factors affecting the industry to identify the segmentation types, industry trends, key players, competitive landscape, fundamental market dynamics, and key player strategies.

Secondary Research

The secondary research process involves the widespread use of secondary sources, directories, databases (such as Bloomberg Businessweek, Factiva, and D&B), white papers, annual reports, companies house documents, investor presentations, and SEC filings of companies. Secondary research was used to identify and collect information useful for the extensive, technical, market-oriented, and commercial study of the patient monitoring devices market. A database of the key industry leaders was also prepared using secondary research.

Primary Research

Primary research was conducted after acquiring extensive knowledge about the global patient monitoring devices market scenario through secondary research. Primary interviews were conducted with market experts from both the demand-side (such as hospitals, ambulatory surgery centers, outpatient facilities, clinics, research universities, academic institutions, and government institutions, among others) and supply-side respondents (such as presidents, CEOs, vice presidents, directors, general managers, heads of business units, and senior managers) across five major geographies, namely, North America, Europe, the Asia Pacific, Latin America, and the Middle East, and Africa. Approximately 30% of the primary interviews were conducted with stakeholders from the demand side, while those from the supply side accounted for the remaining 70%. Primary data for this report was collected through questionnaires, emails, and telephonic interviews.

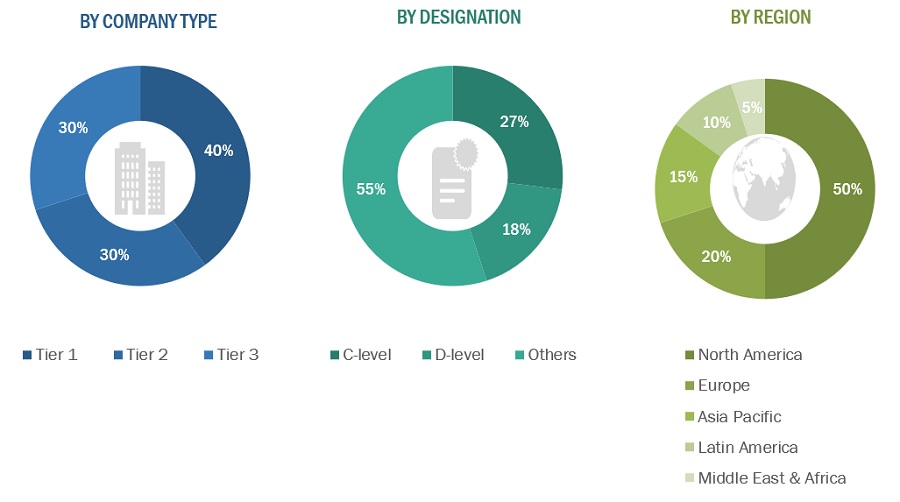
A breakdown of the primary respondents is provided below:
Patient Monitoring Devices Market Size, and Share

Note 1: Companies are classified into tiers based on their total revenue. As of 2019, Tier 1 = >USD 1,000 million, Tier 2 = USD 500–1,000 million, and Tier 3 =

Note 2: Others include sales managers, marketing managers, business development managers, product managers, distributors, and suppliers..

To know about the assumptions considered for the study, download the pdf brochure

Market Estimation

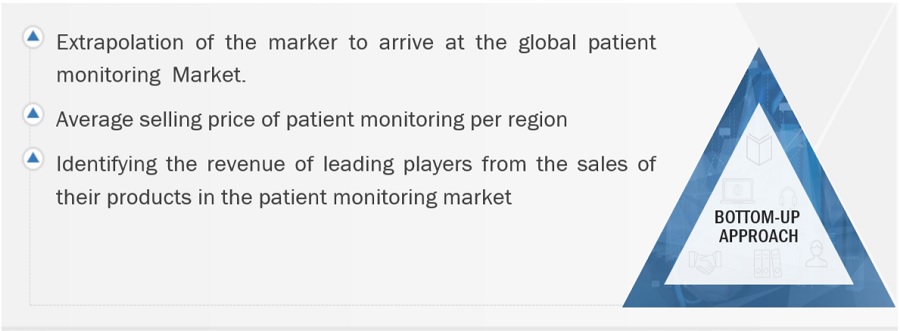
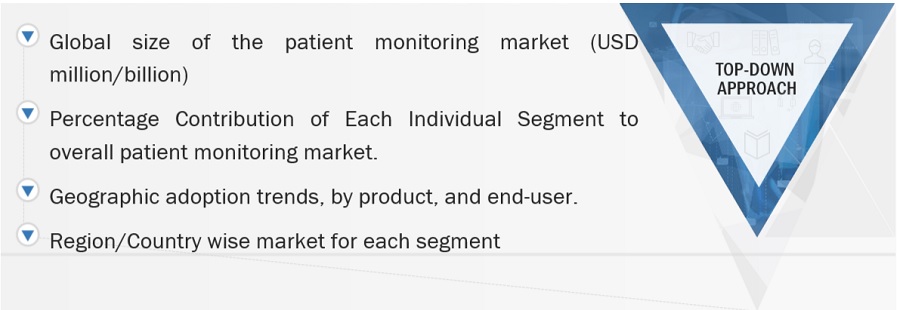
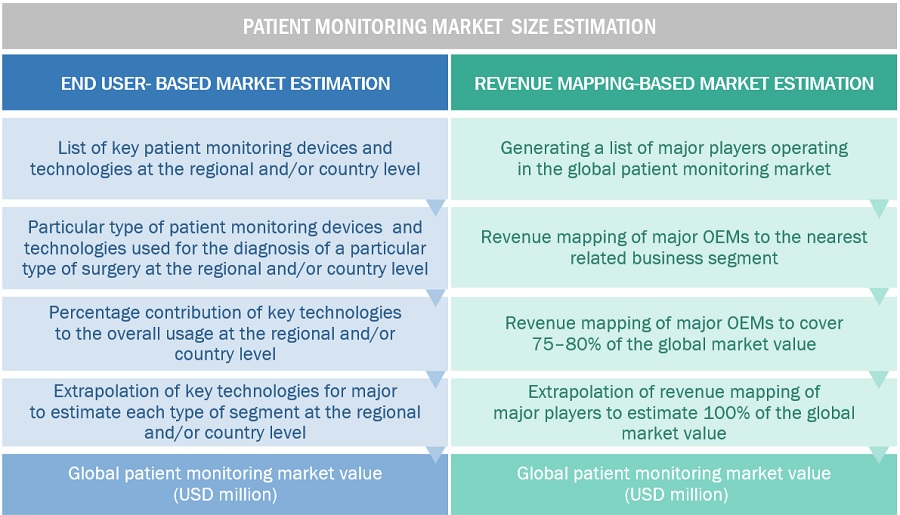
A detailed market estimation approach was followed to estimate and validate the size of the global patient monitoring devices market and other dependent submarkets.

  • The key players in the global patient monitoring devices market were identified through secondary research, and their global market shares were determined through primary and secondary research.
  • The research methodology includes the study of the annual and quarterly financial reports of the top market players as well as interviews with industry experts for key insights on the global patient monitoring devices market.
  • All percentage shares splits, and breakdowns were determined by using secondary sources and verified through primary sources.
  •  All the possible parameters that affect the market segments covered in this research study have been accounted for, viewed in extensive detail, verified through primary research, and analyzed to get the final quantitative and qualitative data.

The above-mentioned data was consolidated and added with detailed inputs and analysis from MarketsandMarkets and presented in this report.

Patient Monitoring Devices Market Size, and Share

To know about the assumptions considered for the study, Request for Free Sample Report

Data Triangulation:

After deriving the overall patient monitoring devices market value data from the market size estimation process, the total market value data was split into several segments and subsegments. To complete the overall market engineering process and arrive at the exact statistics for all the segments, data triangulation and market breakdown procedures were employed wherever applicable. The data was triangulated by studying various qualitative and quantitative variables as well as by analyzing regional trends for both the demand- and supply-side macroindicators.

Report Objectives:

  • To define, describe, and forecast the patient monitoring devices market on the basis of product, end user, and region
  • To provide detailed information regarding the major factors influencing the growth potential of the global patient monitoring devices market (drivers, restraints, opportunities, challenges, and trends)
  • To analyze the micromarkets with respect to individual growth trends, future prospects, and contributions to the global patient monitoring market
  • To analyze key growth opportunities in the global patient monitoring market for key stakeholders and provide details of the competitive landscape for market leaders
  • To forecast the size of market segments and/or subsegments with respect to five major regions, namely, North America (US and Canada), Europe (Germany, France, the UK, Italy, Spain, and the RoE), Asia Pacific (Japan, China, India, and the RoAPAC), Latin America (Brazil, Mexico, and RoLATAM), and the Middle East & Africa
  • To profile the key players in the global patient monitoring market and comprehensively analyze their market shares and core competencies
  • To track and analyze the competitive developments undertaken in the global patient monitoring market, such as product launches; agreements, partnerships, and collaborations; expansions; and mergers & acquisitions

Available Customizations

With the given market data, MarketsandMarkets offers customizations as per the company’s specific needs. The following customization options are available for the present global patient monitoring devices market report:

Product Analysis

  • Product matrix, which gives a detailed comparison of the product portfolios of the top five medical monitoring companies

Company Information

  • Detailed analysis and profiling of additional market players (up to 5)

Geographic Analysis

  • Further breakdown of the Rest of Europe patient monitoring devices market into Belgium, Austria, the Czech Republic, Denmark, Greece, Poland, and Russia, among other
  • Further breakdown of the Rest of Asia Pacific patient monitoring devices market into wan, New Zealand, Vietnam, the Philippines, Singapore, Malaysia, Thailand, and Indonesia among other
  • Further breakdown of the Latin American patient monitoring devices market into Argentina, Chile, Peru, and Colombia, among other
Custom Market Research Services

We will customize the research for you, in case the report listed above does not meet with your exact requirements. Our custom research will comprehensively cover the business information you require to help you arrive at strategic and profitable business decisions.

Request Customization

Instant Answers with GPT - Ask Now!

Ask real questions. Get complete answers !
Report Code
MD 2436
Published ON
Sep, 2022
Choose License Type
BUY NOW
  • SHARE
X
Request Customization
Speak to Analyst
Speak to Analyst
OR FACE-TO-FACE MEETING
PERSONALIZE THIS RESEARCH
  • Triangulate with your Own Data
  • Get Data as per your Format and Definition
  • Gain a Deeper Dive on a Specific Application, Geography, Customer or Competitor
  • Any level of Personalization
REQUEST A FREE CUSTOMIZATION
LET US HELP YOU!
  • What are the Known and Unknown Adjacencies Impacting the Patient Monitoring Devices Market
  • What will your New Revenue Sources be?
  • Who will be your Top Customer; what will make them switch?
  • Defend your Market Share or Win Competitors
  • Get a Scorecard for Target Partners
CUSTOMIZED WORKSHOP REQUEST
+1-888-600-6441
  • Call Us
  • +1-888-600-6441 (Corporate office hours)
  • +1-888-600-6441 (US/Can toll free)
  • +44-800-368-9399 (UK office hours)
CONNECT WITH US
ABOUT TRUST ONLINE
©2023 MarketsandMarkets Research Private Ltd. All rights reserved
DMCA.com Protection Status Website Feedback