Phosphate Market by Type/Derivative (Ammonium Phosphate, Calcium Phosphate, Phosphoric Acid), Application (Fertilizers, Foods & Beverages, Detergents), Type of Resource (Sedimentary Marine Deposits, Igneous & Weathered, Biogenic) - Global Forecast to 2021
[166 Pages Report] The global phosphate market was valued at 67.28 Billion in 2015 and is projected to reach 75.17 Billion by 2021, at a CAGR of 1.9% from 2016 to 2021. In this report, 2015 is considered as the base year and the forecast period is from 2016 to 2021.
The objectives of this study are:
- To define, describe, and analyze the global phosphate market by type/derivative, application, type of resource and region
- To forecast and analyze the market size (in terms of value and volume) and different submarkets of five regionsAsia-Pacific, Europe, North America, the Middle East & Africa, and South America
- To forecast and analyze the market at the country level for each region
- To strategically analyze each submarket with respect to individual growth trends and its contribution to the global phosphate market
- To analyze opportunities in the market for the stakeholders by identifying high growth segments of the global phosphate market
- To identify significant market trends and factors driving or inhibiting the growth of the market and its submarkets
- To analyze competitive developments, such as expansions, joint ventures, new products launches, and acquisitions, in the global phosphate market
- To strategically profile the key market players and comprehensively analyze their growth strategies
This technical, market oriented, and commercial research study of the global phosphate market involves the extensive use of secondary sources, directories, and databases (such as Hoovers, Bloomberg BusinessWeek, and Factiva) to identify and collect information. The primary sources mainly include several industry experts from core and related industries and preferred suppliers, manufacturers, distributors, service providers, and organizations related to all segments of the industrys supply chain. After arriving at the overall market size, the total market has been split into several segments. The figure below illustrates the breakdown of the primary interviews based on company type, designation, and region conducted during the research study:
To know about the assumptions considered for the study, download the pdf brochure
The phosphate value chain includes phosphate rock extracting companies such as S.A. OCP (Morocco), Israel Chemicals Ltd (Israel), and Jordan Phosphate Mines Company (Jordan). Furthermore, phosphate derivatives are manufactured by companies such as The Mosaic Company (U.S.), Potash Corporation of Saskatchewan Inc. (Canada), Agrium Inc. (Canada), and while, companies such as S.A. OCP, Israel Chemicals Ltd. and Jordan Phosphate Mines Company are vertically integrated companies, and thus are also engaged in the production of phosphate derivatives. Companies such as EuroChem (Russia), Innophos Holdings Inc. (U.S.) and other companies produce fertilizers.
The target audiences for the phosphate market report are as follows:
- Phosphate manufacturers
- Phosphate derivatives suppliers
- Raw material suppliers
- Investment banks
- Farmers
- Government bodies
Get online access to the report on the World's First Market Intelligence Cloud
Request Sample Scope of the Report
This report categorizes the global market for phosphate on the basis of type/derivative, application, type of resource and region.
Phosphate market, by Type/Derivative:
- Ammonium Phosphate
- Calcium Phosphate
- Phosphoric Acid
- Potassium Phosphate
- Sodium Tripolyphosphate
- Others
Phosphate market, by Application:
- Fertilizers
- Foods & Beverages
- Detergents
- Water Treatment Chemicals
- Metal Finishing
- Others
Phosphate market, by type of Resource:
- Sedimentary Marine Deposits
- Igneous & Weathered Rock
- Biogenic
- Others
Phosphate market, by Region:
- Asia-Pacific
- Europe
- North America
- Middle East & Africa
- South America
Available Customizations:
With the given market data, MarketsandMarkets offers customizations according to the companys specific needs. The following customization options are available for the report:
Regional Analysis
- Further breakdown of a region with respect to a particular country, additional application, and/or type
Country Information
- Additional country information (up to three)
Company Information
- Detailed analysis and profiles of additional market players (up to five)
The global phosphate market was USD 68.51 Billion in 2016, and is projected to reach USD 75.17 Billion by 2021, at a CAGR of 1.9% during the forecast period. Global focus on increasing agricultural output and increasing demand for phosphate from the foods & beverages industry is expected drive the market during the forecast period.
The global phosphate market is classified on the basis of type/derivative, namely, ammonium phosphate, calcium phosphate, phosphoric acid, potassium phosphate, sodium tripolyphosphate, and others. Ammonium phosphate is expected to lead the global phosphate market during the forecast period, followed by calcium phosphate. Ammonium phosphate leads the market due to its growing use for the production of fertilizers, which is a vital element for the growth of plants and crops. The market for calcium phosphate is expected to witness the highest CAGR from 2016 to 2021. The growth is mainly due to the rapid growth of the packaged food industry, as calcium phosphate is an excellent food preservative.
The global phosphate market is classified on the basis of application, namely, fertilizers, foods & beverages, detergents, water treatment chemicals, metal finishing, and others. The fertilizers application is the highest, as the need for higher agricultural production on the limited available arable land is driving the consumption of fertilizers. However, the foods & beverages application is expected to grow at the highest CAGR during forecast period mainly due to the increasing consumption of packaged food.
The global phosphate market is classified on the basis of type of resource, namely, sedimentary marine deposits, igneous & weathered rock, biogenic, and others. Sedimentary marine deposits are the largest source for phosphate. About 75% of the global phosphate rock is extracted from sedimentary marine deposits. The igneous & weathered rock is the second largest source of phosphate.
The global phosphate market is segmented on the basis of region, namely, Asia-Pacific, Europe, North America, Middle East & Africa, and South America. Currently, the Asia-Pacific region is the largest market for phosphate. The increasing population coupled with the increased demand for nutritious food in the region is expected to drive the increasing demand for phosphate. South America is projected to be the second-fastest growing market from 2016 to 2021. This growth is attributed to the rapidly growing agricultural sector in the region.
The major factors restraining the growth of the global phosphate market are, the stringent regulations in the use of phosphate in detergents and the diminishing supply of phosphate rock.
Some of the key players in the global phosphate market are The Mosaic Company (U.S.), S.A. OCP (Morocco), PJSC PhosAgro AG (Russia), EuroChem (Russia), and Agrium Inc. (Canada), Potash Corporation of Saskatchewan Inc. (Canada), Saudi Arabian Mining Company (MAADEN) (Saudi Arabia), Innophos Holdings, Inc. (U.S.), Israel Chemicals Ltd (Israel), and Jordan Phosphate Mines Company (Jordan), among others.
To speak to our analyst for a discussion on the above findings, click Speak to Analyst
Table of Contents
1 Introduction (Page No. - 16)
1.1 Objectives of the Study
1.2 Market Definition
1.2.1 Market Scope
1.2.2 Years Considered for the Report
1.3 Currency
1.4 Package Size
1.5 Limitations
1.6 Stakeholders
2 Research Methodology (Page No. - 20)
2.1 Research Data
2.1.1 Secondary Data
2.1.1.1 Key Data From Secondary Sources
2.1.2 Primary Data
2.1.2.1 Key Data From Primary Sources
2.1.2.2 Key Industry Insights
2.1.2.3 Breakdown of Primary Interviews
2.2 Market Size Estimation
2.2.1 Bottom-Up Approach
2.2.2 Top-Down Approach
2.3 Data Triangulation
2.4 Research Assumptions
3 Executive Summary (Page No. - 28)
4 Premium Insights (Page No. - 32)
4.1 Significant Opportunities in the Phosphate & Derivatives Market
4.2 Phosphate & Derivatives Market, By Region, 20162021
4.3 Phosphate & Derivatives Market in Asia-Pacific, By Type and Country
4.4 Phosphate & Derivatives Market Share, By Type of Resource
4.5 Phosphate & Derivatives Market Attractiveness
4.6 Phosphate & Derivatives Market Share, By Application and Region, 2015
5 Market Overview (Page No. - 37)
5.1 Introduction
5.2 Market Segmentation
5.2.1 By Type
5.2.2 By Application
5.2.3 By Type of Resource
5.2.4 By Region
5.3 Market Dynamics
5.3.1 Drivers
5.3.1.1 Increased Crop Production Fueling the Growth of the Phosphate & Derivatives Market
5.3.1.2 Decrease in Arable Land
5.3.1.3 Increased Meat Consumption Propelling the Demand for Animal Feed
5.3.1.4 Rising Demand for Water Treatment Chemicals
5.3.2 Restraints
5.3.2.1 Diminishing Supply of Phosphate
5.3.3 Opportunities
5.3.3.1 Improved Hard Process (IHP) for Phosphoric Acid Production
5.3.3.2 Use of Phosphate in Batteries for Electric Vehicles
5.3.4 Challenges
5.3.4.1 Stringent Regulations on the Use of Phosphate in Detergents
6 Industry Trends (Page No. - 45)
6.1 Introduction
6.2.1 Phosphate Rock Reserves
6.2.2 Intermediate
6.2.3 Final Product
6.2.4 End Use
6.3 Porters Five Forces Analysis
6.3.1 Threat of New Entrants
6.3.2 Threat of Substitutes
6.3.3 Bargaining Power of Suppliers
6.3.4 Bargaining Power of Buyers
6.3.5 Intensity of Competitive Rivalry
6.4 Industry Outlook
6.4.1 Agriculture
7 Phosphate & Derivatives Market, By Type (Page No. - 51)
7.1 Introduction
7.2 Market Size Estimation
7.3 Revenue Pocket Matrix
7.3.1 Type Matrix
7.4 Ammonium Phosphate
7.4.1 Rising Fertilizers Consumption Driving the Demand for Ammonium Phosphate in Asia-Pacific
7.5 Calcium Phosphate
7.5.1 Increased Consumption of Supplementary Food to Drive the Demand for Calcium Phosphate
7.6 Phosphoric Acid
7.6.1 Rising Demand From End-Use Industries is Driving the Phosphoric Acid Market
7.7 Potassium Phosphate
7.7.1 Rapid Growth of the Agriculture Industry to Drive the Potassium Phosphate Market
7.8 Sodium Tripolyphosphate
7.8.1 Stringent Regulations for the Use of Sodium Tripolyphosphate in Detergents is Restraining the Growth of the Phosphate & Derivatives Market
7.9 Others
7.9.1 Growing Demand From End-Use Industries to Drive the Market
8 Phosphate & Derivatives Market, By Application (Page No. - 65)
8.1 Introduction
8.2 Application Revenue Pocket Matrix
8.3 Fertilizers
8.3.1 Booming Agriculture Sector Driving the Phosphate & Derivatives Market in Asia-Pacific
8.4 Food & Beverage
8.4.1 Rising Demand for Supplementary Food Leading to Increased Consumption of Phosphate & Derivatives
8.5 Detergents
8.5.1 Stringent Regulations for the Use of Phosphates in Detergents Restraining the Growth of the Market
8.6 Water Treatment Chemicals
8.6.1 Increasing Demand for Fresh Water From Industries and Consumers to Drive Demand
8.7 Metal Finishing
8.7.1 Increasing Automobile Production to Drive Demand in Metal Finishing Application
8.8 Others
9 Phosphate & Derivatives Market, By Type of Resource (Page No. - 79)
9.1 Introduction
9.2 Sedimentary Marine Deposits
9.3 Igneous & Weathered
9.4 Biogenic
9.5 Others
10 Phosphate & Derivatives Market, By Region (Page No. - 83)
10.1 Introduction
10.2 Asia-Pacific
10.2.1 China
10.2.2 India
10.2.3 Australia
10.2.4 Pakistan
10.2.5 Bangladesh
10.2.6 Indonesia
10.3 North America
10.3.1 U.S.
10.3.2 Canada
10.3.3 Mexico
10.4 Europe
10.4.1 France
10.4.2 Germany
10.4.3 Poland
10.4.4 Spain
10.4.5 Italy
10.4.6 Russia
10.5 Middle East & Africa
10.5.1 Iran
10.5.2 Egypt
10.5.3 South Africa
10.5.4 Morocco
10.5.5 Jordan
10.6 South America
10.6.1 Brazil
10.6.2 Argentina
10.6.3 Chile
10.6.4 Colombia
11 Competitive Landscape (Page No. - 125)
11.1 Overview
11.2 Market Share of Key Players
11.2.1 S.A. OCP
11.2.2 The Mosaic Company
11.2.3 Potash Corporation of Saskatchewan Inc.
11.3 Competitive Situations and Trends
11.3.1 Acquisitions
11.3.2 Agreements
11.3.3 Expansions
11.3.4 Joint Ventures
11.3.5 New Product Launches
12 Company Profiles (Page No. - 134)
12.1 the Mosaic Company
12.1.1 Business Overview
12.1.2 Products Offered
12.1.3 Recent Developments
12.1.4 SWOT Analysis
12.1.5 MnM View
12.2 S.A. OCP
12.2.1 Business Overview
12.2.2 Products Offered
12.2.3 Recent Developments
12.2.4 SWOT Analysis
12.2.5 MnM View
12.3 Potash Corporation of Saskatchewan Inc.
12.3.1 Business Overview
12.3.2 Products Offered
12.3.3 Recent Developments
12.3.4 MnM View
12.4 Agrium Inc.
12.4.1 Business Overview
12.4.2 Products Offered
12.4.3 Recent Developments
12.4.4 SWOT Analysis
12.4.5 MnM View
12.5 Eurochem
12.5.1 Business Overview
12.5.2 Products Offered
12.5.3 Recent Developments
12.5.4 SWOT Analysis
12.5.5 MnM View
12.6 Innophos Holdings, Inc.
12.6.1 Business Overview
12.6.2 Products Offered
12.6.3 Recent Developments
12.6.4 SWOT Analysis
12.6.5 MnM View
12.7 Israel Chemical Ltd. (ICL)
12.7.1 Business Overview
12.7.2 Products Offered
12.7.3 Recent Developments
12.8 Jordan Phosphate Mines Company PLC.
12.8.1 Business Overview
12.8.2 Products Offered
12.9 PJSC Phosagro AG
12.9.1 Business Overview
12.9.2 Products Offered
12.9.3 Recent Developments
12.10 Saudi Arabian Mining Company (Maaden)
12.10.1 Business Overview
12.10.2 Products Offered
12.10.3 Recent Developments
12.11 List of Additional Companies and Their Products
12.11.1 Solvay-Rohdia (France)
12.11.2 Valle S.A. (Brazil)
12.11.3 Yuntianhua Group Co., Ltd. (China)
12.11.4 Prayon S.A. (Belgium)
12.11.5 Kazphosphate LLC (Kazakhstan)
12.11.6 Chemische Fabrik Budenheim (Germany)
12.11.7 Yara International ASA (Norway)
12.11.8 Wengfu Group (China)
12.11.9 Anglo American (Brazil)
12.11.10 Incitec Pivot Limited (Australia)
12.11.11 Dusolo Fertilizers (Canada)
12.11.12 Fertoz Agriculture Pty Ltd (Australia)
12.11.13 Koch Fertilizer LLC (U.S.)
12.11.14 Mississippi Phosphates Corporation (U.S.)
12.11.15 Phosphate Australia (Australia)
13 Appendix (Page No. - 162)
13.1 Insights From Industry Experts
13.2 Discussion Guide
13.3 Introducing RT: Real Time Market Intelligence
13.4 Available Customizations
13.5 Related Reports
List of Tables (102 Tables)
Table 1 Phosphate & Derivatives Market, By Type
Table 2 Phosphate & Derivatives Market, By Application
Table 3 Phosphate & Derivatives Market, By Type of Resource
Table 4 Regulations Imposed By Canadian Government on the Use of Phosphate in Detergents
Table 5 Contribution of the Agriculture Sector to GDP, By Country, 2015
Table 6 Phosphate & Derivatives Market Size, By Type, 20142021 (USD Million)
Table 7 Phosphate & Derivatives Market Size, By Type, 20142021 (Kiloton)
Table 8 Ammonium Phosphate Market Size, By Region, 20142021 (USD Million)
Table 9 Ammonium Phosphate Market Size, By Region, 20142021 (Kiloton)
Table 10 Calcium Phosphate Market Size, By Region, 20142021 (USD Million)
Table 11 Calcium Phosphate Market Size, By Region, 20142021 (Kiloton)
Table 12 Phosphoric Acid Market Size, By Region, 20142021 (USD Million)
Table 13 Phosphoric Acid Market Size, By Region, 20142021 (Kiloton)
Table 14 Potassium Phosphate Market Size, By Region, 20142021 (USD Million)
Table 15 Potassium Phosphate Market Size, By Region, 20142021 (Kiloton)
Table 16 Sodium Tripolyphosphate Market Size, By Region, 20142021 (USD Million)
Table 17 Sodium Tripolyphosphate Market Size, By Region, 20142021 (Kiloton)
Table 18 Other Phosphate & Derivatives Market Size, By Region, 20142021 (USD Million)
Table 19 Other Phosphate & Derivatives Market Size, By Region, 20142021 (Kiloton)
Table 20 Phosphate & Derivatives Market Size, By Application, 20142021 (USD Million)
Table 21 Phosphate & Derivatives Market Size, By Application, 20142021 (Kiloton)
Table 22 Phosphate & Derivatives Market Size in Fertilizers Application, By Region, 20142021 (USD Million)
Table 23 Phosphate & Derivatives Market Size in Fertilizers Application, By Region, 20142021 (Kiloton)
Table 24 Phosphate & Derivatives Market Size in Food & Beverage Application, By Region, 20142021 (USD Million)
Table 25 Phosphate & Derivatives Market Size in Food & Beverage Application, By Region, 20142021 (Kiloton)
Table 26 Phosphate & Derivatives Market Size in Detergents Application, By Region, 20142021 (USD Million)
Table 27 Phosphate & Derivatives Market Size in Detergents Application, By Region, 20142021 (Kiloton)
Table 28 Phosphate & Derivatives Market Size in Water Treatment Chemicals, By Region, 20142021 (USD Million)
Table 29 Phosphate & Derivatives Market Size in Water Treatment Chemicals, By Region, 20142021 (Kiloton)
Table 30 Phosphate & Derivatives Market Size in Metal Finishing Application, By Region, 20142021 (USD Million)
Table 31 Phosphate & Derivatives Market Size in Metal Finishing Application, By Region, 20142021 (Kiloton)
Table 32 Phosphate & Derivatives Market Size in Other Applications, By Region, 20142021 (USD Million)
Table 33 Phosphate & Derivatives Market Size in Other Applications, By Region, 20142021 (Kiloton)
Table 34 Phosphate & Derivatives Market Size, By Type of Resource, 20142021 (USD Million)
Table 35 Phosphate & Derivatives Market Size, By Type of Resource, 20142021 (Kiloton)
Table 36 Phosphate & Derivatives Market Size, By Region, 20142021 (USD Million)
Table 37 Phosphate & Derivatives Market Size, By Region, 20142021 (Kiloton)
Table 38 Asia-Pacific: Phosphate & Derivatives Market Size, By Country, 20142021 (USD Million)
Table 39 Asia-Pacific: Phosphate & Derivatives Market Size, By Country, 20142021 (Kiloton)
Table 40 Asia-Pacific: Phosphate & Derivatives Market Size, By Type, 20142021 (USD Million)
Table 41 Asia-Pacific: Phosphate & Derivatives Market Size, By Type, 20142021 (Kiloton)
Table 42 Asia-Pacific: Phosphate & Derivatives Market Size, By Application, 20142021 (USD Million)
Table 43 Asia-Pacific: Phosphate & Derivatives Market Size, By Application, 20142021 (Kiloton)
Table 44 China: Phosphate & Derivatives Market Size, By Application, 20142021 (USD Million)
Table 45 China: Phosphate & Derivatives Market Size, By Application, 20142021 (Kiloton)
Table 46 India: Phosphate & Derivatives Market Size, By Application, 20142021 (USD Million)
Table 47 India: Phosphate & Derivatives Market Size, By Application, 20142021 (Kiloton)
Table 48 Australia: Phosphate & Derivatives Market Size, By Application, 20142021 (USD Million)
Table 49 Australia: Phosphate & Derivatives Market Size, By Application, 20142021 (Kiloton)
Table 50 North America: Phosphate & Derivatives Market Size, By Country, 20142021 (USD Million)
Table 51 North America: Phosphate & Derivatives Market Size, By Country, 20142021 (Kiloton)
Table 52 North America: Phosphate & Derivatives Market Size, By Type, 20142021 (USD Million)
Table 53 North America: Phosphate & Derivatives Market Size, By Type, 20142021 (Kiloton)
Table 54 North America: Phosphate & Derivatives Market Size, By Application, 20142021 (USD Million)
Table 55 North America: Phosphate & Derivatives Market Size, By Application, 20142021 (Kiloton)
Table 56 U.S.: Phosphate & Derivatives Market Size, By Application, 20142021 (USD Million)
Table 57 U.S.: Phosphate & Derivatives Market Size, By Application, 20142021 (Kiloton)
Table 58 Canada: Phosphate & Derivatives Market Size, By Application, 20142021 (USD Million)
Table 59 Canada: Phosphate & Derivatives Market Size, By Application, 20142021 (Kiloton)
Table 60 Mexico: Phosphate & Derivatives Market Size, By Application, 20142021 (USD Million)
Table 61 Mexico: Phosphate & Derivatives Market Size, By Application, 20142021 (Kiloton)
Table 62 Europe: Phosphate & Derivatives Market Size, By Country, 20142021 (USD Million)
Table 63 Europe: Phosphate & Derivatives Market Size, By Country, 20142021 (Kiloton)
Table 64 Europe: Phosphate & Derivatives Market Size, By Type, 20142021 (USD Million)
Table 65 Europe: Phosphate & Derivatives Market Size, By Type, 20142021 (Kiloton)
Table 66 Europe: Phosphate & Derivatives Market Size, By Application, 20142021 (USD Million)
Table 67 Europe: Phosphate & Derivatives Market Size, By Application, 20142021 (Kiloton)
Table 68 France: Phosphate & Derivatives Market Size, By Application, 20142021 (USD Million)
Table 69 France: Phosphate & Derivatives Market Size, By Application, 20142021 (Kiloton)
Table 70 Germany: Phosphate & Derivatives Market Size, By Application, 20142021 (USD Million)
Table 71 Germany: Phosphate & Derivatives Market Size, By Application, 20142021 (Kiloton)
Table 72 Poland: Phosphate & Derivatives Market Size, By Application, 20142021 (USD Million)
Table 73 Poland: Phosphate & Derivatives Market Size, By Application, 20142021 (Kiloton)
Table 74 Middle East & Africa: Phosphate & Derivatives Market Size, By Country, 20142021 (USD Million)
Table 75 Middle East & Africa: Phosphate & Derivatives Market Size, By Country, 20142021 (Kiloton)
Table 76 Middle East & Africa: Phosphate & Derivatives Market Size, By Type, 20142021 (USD Million)
Table 77 Middle East & Africa: Phosphate & Derivatives Market Size, By Type, 20142021 (Kiloton)
Table 78 Middle East & Africa: Phosphate & Derivatives Market Size, By Application, 20142021 (USD Million)
Table 79 Middle East & Africa: Phosphate & Derivatives Market Size, By Application, 20142021 (Kiloton)
Table 80 Iran: Phosphate & Derivatives Market Size, By Application, 20142021 (USD Million)
Table 81 Iran: Phosphate & Derivatives Market Size, By Application, 20142021 (Kiloton)
Table 82 Egypt: Phosphate & Derivatives Market Size, By Application, 20142021 (USD Million)
Table 83 Egypt: Phosphate & Derivatives Market Size, By Application, 20142021 (Kiloton)
Table 84 South Africa: Phosphate & Derivatives Market Size, By Application, 20142021 (USD Million)
Table 85 South Africa: Phosphate & Derivatives Market Size, By Application, 20142021 (Kiloton)
Table 86 South America: Phosphate & Derivatives Market Size, By Country, 20142021 (USD Million)
Table 87 South America: Phosphate & Derivatives Market Size, By Country, 20142021 (Kiloton)
Table 88 South America: Phosphate & Derivatives Market Size, By Type, 20142021 (USD Million)
Table 89 South America: Phosphate & Derivatives Market Size, By Type, 20142021 (Kiloton)
Table 90 South America: Phosphate & Derivatives Market Size, By Application, 20142021 (USD Million)
Table 91 South America: Phosphate & Derivatives Market Size, By Application, 20142021 (Kiloton)
Table 92 Brazil: Phosphate & Derivatives Market Size, By Application, 20142021 (USD Million)
Table 93 Brazil: Phosphate & Derivatives Market Size, By Application, 20142021 (Kiloton)
Table 94 Argentina: Phosphate & Derivatives Market Size, By Application, 20142021 (USD Million)
Table 95 Argentina: Phosphate & Derivatives Market Size, By Application, 20142021 (Kiloton)
Table 96 Chile: Phosphate & Derivatives Market Size, By Application, 20142021 (USD Million)
Table 97 Chile: Phosphate & Derivatives Market Size, By Application, 20142021 (Kiloton)
Table 98 Acquisitions, 20112016
Table 99 Agreements, 20112016
Table 100 Expansions, 20112016
Table 101 Joint Ventures, 20112016
Table 102 New Product Launches, 20112016
List of Figures (67 Figures)
Figure 1 Phosphate & Derivatives: Market Segmentation
Figure 2 Phosphate & Derivatives Market: Research Design
Figure 3 Data Triangulation
Figure 4 Ammonium Phosphate to Dominate the Phosphate & Derivatives Market, 20162021
Figure 5 Fertilizers to Be the Largest Application Segment Between 2016 and 2021
Figure 6 Sedimentary Marine Deposits to Be the Largest Source for Phosphate Between 2016 and 2021
Figure 7 Asia-Pacific to Be the Fastest-Growing Market of Phosphate & Derivatives, 20162021
Figure 8 Moderate Growth in the Phosphate & Derivatives Market Between 2016 and 2021
Figure 9 Asia-Pacific Projected to Be the Largest Market for Phosphate & Derivatives Between 2016 and 2021
Figure 10 China Accounted for the Largest Market Share in Asia-Pacific in 2015
Figure 11 Sedimentary Marine Deposits are the Biggest Resource for Phosphate Rock
Figure 12 Growing Population to Drive the Phosphate & Derivatives Market During Forecast Period
Figure 13 Fertilizers Was the Biggest Application Segment of Phosphate & Derivatives Market in 2015
Figure 14 Phosphate & Derivatives Market, By Region
Figure 15 Overview of Factors Governing the Phosphate & Derivatives Market
Figure 16 World Population, 20052050 (Million)
Figure 17 Arable Land, 19502020 (Hectares Per Person)
Figure 18 Value Chain of the Phosphate & Derivatives Market
Figure 19 Porters Five Forces Analysis
Figure 20 Ammonium Phosphate to Dominate the Phosphate & Derivatives Market During Forecast Period
Figure 21 Revenue Pocket Matrix, By Type
Figure 22 Asia-Pacific Projected to Be Largest Market for Ammonium Phosphate Between 2016 and 2021
Figure 23 Asia-Pacific to Be the Largest Market for Calcium Phosphate Between 2016 and 2021
Figure 24 Europe is the Second-Largest Market for Phosphoric Acid Between 2016 and 2021
Figure 25 Asia-Pacific is the Largest Market for Potassium Phosphate Between 2016 and 2021
Figure 26 Asia-Pacific to Continue Leading the Sodium Tripolyphosphate Market Between 2016 and 2021
Figure 27 North America is the Second-Largest Market for Other Phosphate & Derivatives Between 2016 and 2021
Figure 28 Fertilizers Application to Dominate the Phosphate & Derivatives Market During 2016 and 2021
Figure 29 Revenue Pocket Matrix: By Application
Figure 30 Asia-Pacific to Be the Largest Phosphate & Derivatives Market for Fertilizers During the Forecast Period
Figure 31 North America is the Second-Largest Market for Phosphate & Derivatives in the Food & Beverage Application
Figure 32 Europe to Be the Second-Largest Phosphate & Derivatives Market in Detergents Application Between 2016 and 2021
Figure 33 Asia-Pacific to Be the Largest Market of Phosphate & Derivatives in Water Treatment Application Between 2016 and 2021
Figure 34 Asia-Pacific to Be the Largest Market for Phosphate & Derivatives in Metal Finishing Application During the Forecast Period
Figure 35 Asia-Pacific to Dominate the Global Phosphate & Derivatives Market in Other Applications During the Forecast Period
Figure 36 Sedimentary Marine Deposits to Dominate the Phosphate & Derivatives Market Between 2016 and 2021
Figure 37 China and India: Emerging Markets for Phosphate & Derivatives
Figure 38 Asia-Pacific Market Snapshot: China Dominates the Phosphate & Derivatives Market in Asia-Pacific
Figure 39 Pakistan: Phosphate & Derivatives Market Size, 20142021
Figure 40 Bangladesh: Phosphate & Derivatives Market Size, 20142021
Figure 41 Indonesia: Phosphate & Derivatives Market Size, 20142021
Figure 42 U.S. Dominates the Phosphate & Derivatives Market in North America
Figure 43 Italy to Register the Highest CAGR in European Phosphate & Derivatives Market
Figure 44 Spain: Phosphate & Derivatives Market Size, 20142021
Figure 45 Italy: Phosphate & Derivatives Market Size, 20142021
Figure 46 Russia: Phosphate & Derivatives Market Size, 20142021
Figure 47 Morocco: Phosphate & Derivatives Market Size, 2014-2021
Figure 48 Jordan: Phosphate & Derivatives Market Size, 2014-2021
Figure 49 Colombia: Phosphate & Derivatives Market Size, 2014-2021
Figure 50 Acquisitions: the Most Preferred Growth Strategy Adopted By Key Players Between 2011 and 2016
Figure 51 Acquisitions: the Most Preferred Growth Strategy in the Phosphate & Derivatives Market
Figure 52 S.A. OCP: the Largest Phosphate Rock Producer in 2015
Figure 53 The Mosaic Company.: Company Snapshot
Figure 54 The Mosaic Company: SWOT Analysis
Figure 55 S.A. OCP SA: Company Snapshot
Figure 56 S.A. OCA: SWOT Analysis
Figure 57 Potash Corporation of Saskatchewan Inc.: Company Snapshot
Figure 58 Agrium Inc.: Company Snapshot
Figure 59 Agrium Inc.: SWOT Analysis
Figure 60 Eurochem: Company Snapshot
Figure 61 Eurochem: SWOT Analysis
Figure 62 Innophos Holdings, Inc.: Company Snapshot
Figure 63 Innophos Holdings, Inc.: SWOT Analysis
Figure 64 Israel Chemical Ltd.: Company Snapshot
Figure 65 Jordan Phosphate Mines Company PLC.: Company Snapshot
Figure 66 PJSC Phosagro AG: Company Snapshot
Figure 67 Saudi Arabian Mining Company: Company Snapshot
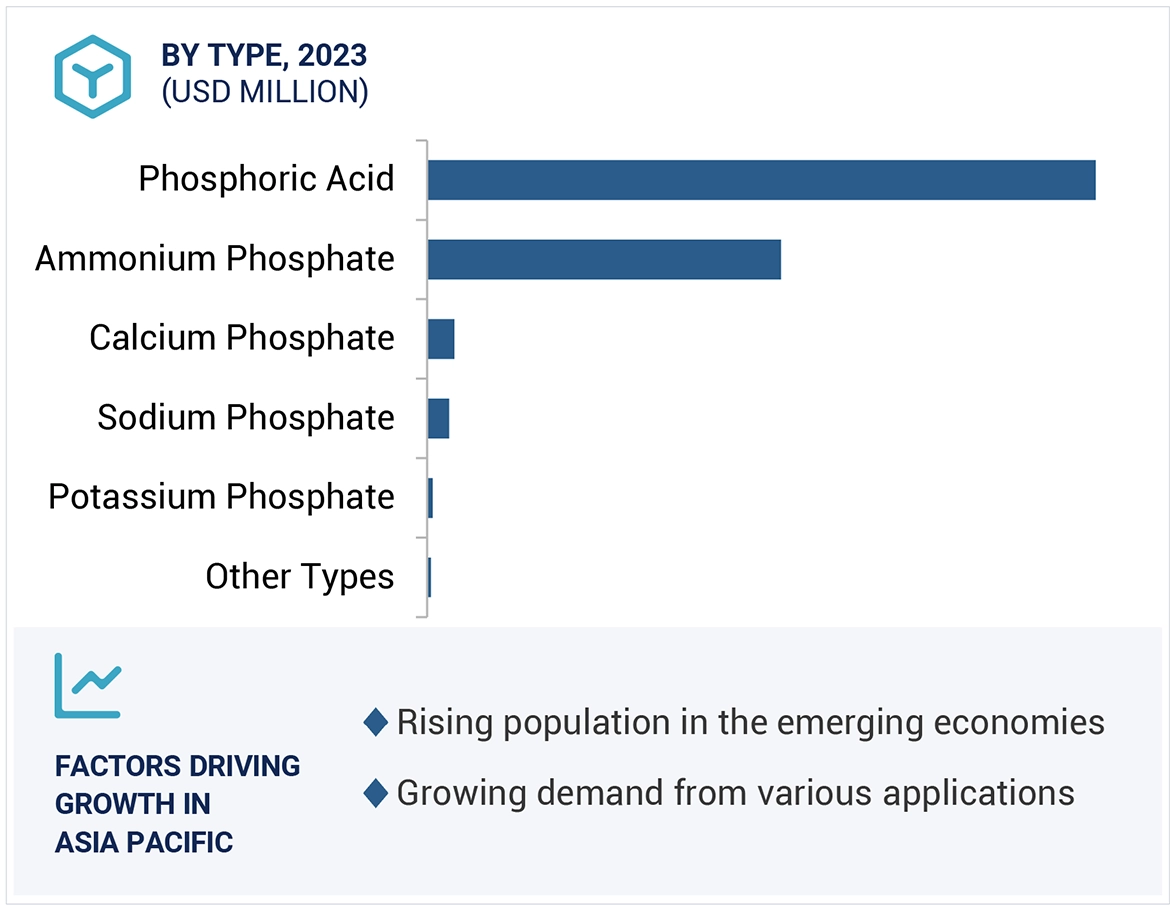
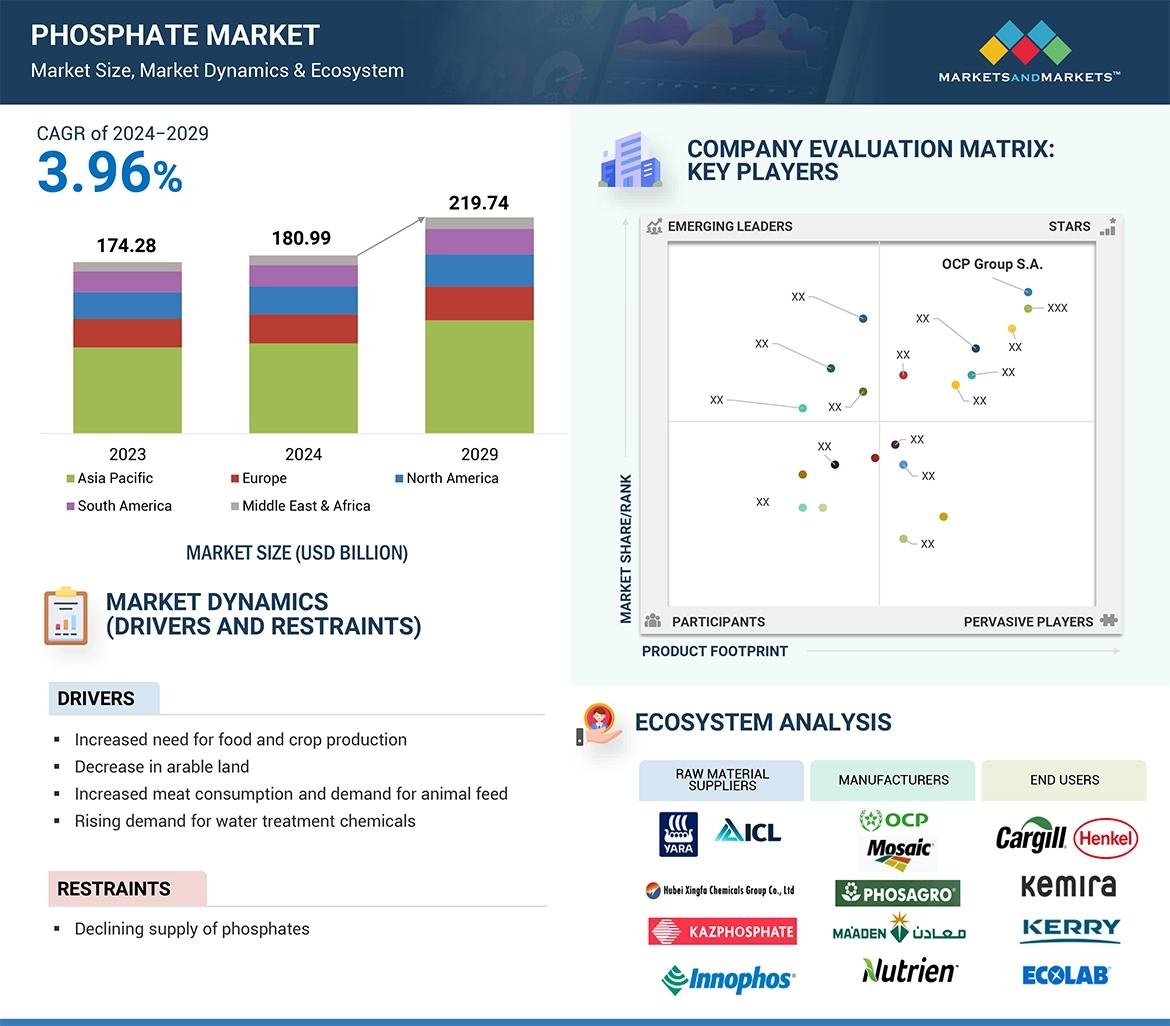
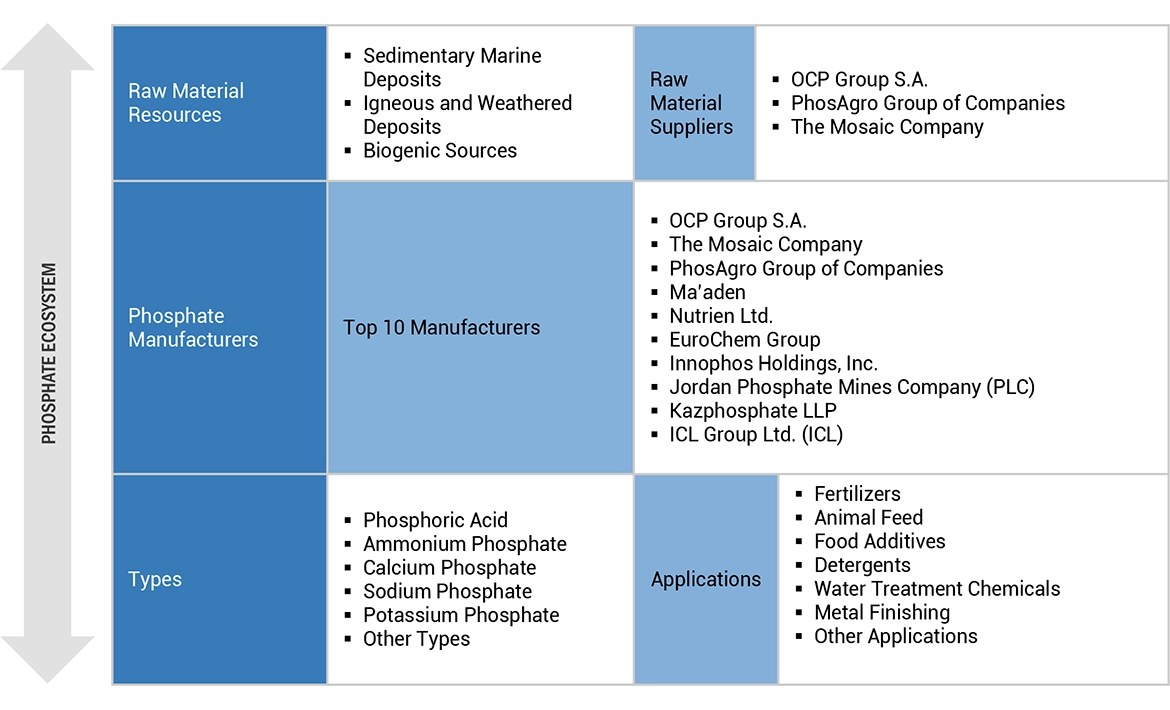
Growth opportunities and latent adjacency in Phosphate Market