
Polyols Market

Polyols Market by Type (Polyether Polyols, Polyester Polyols), Application (Flexible Polyurethane Foam, Rigid Polyurethane Foam, CASE), End-use Industry (Building & Construction, Furnishing, Automotive, Electronics), and Region - Global Forecast to 2030


POLYOLS MARKET SIZE ANALYSIS
Source: Secondary Research, Interviews with Experts, MarketsandMarkets Analysis | Updated on : April 29, 2026
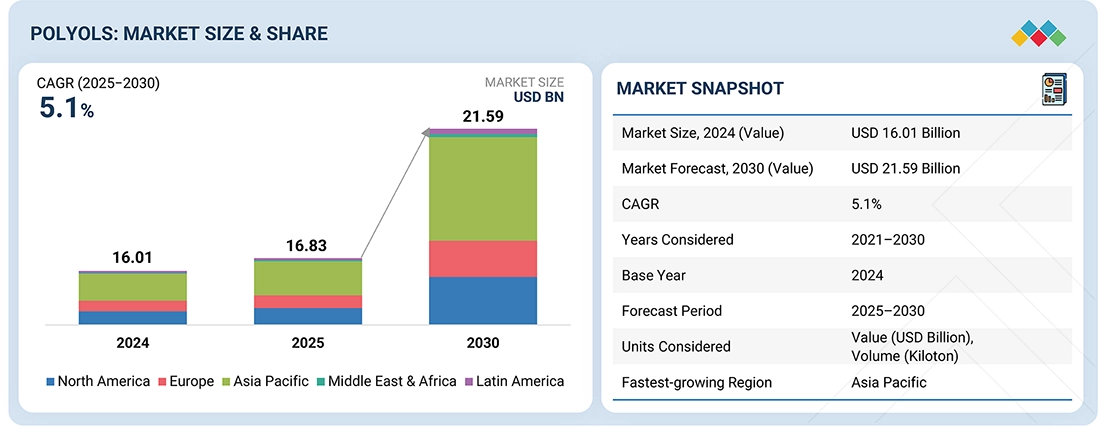
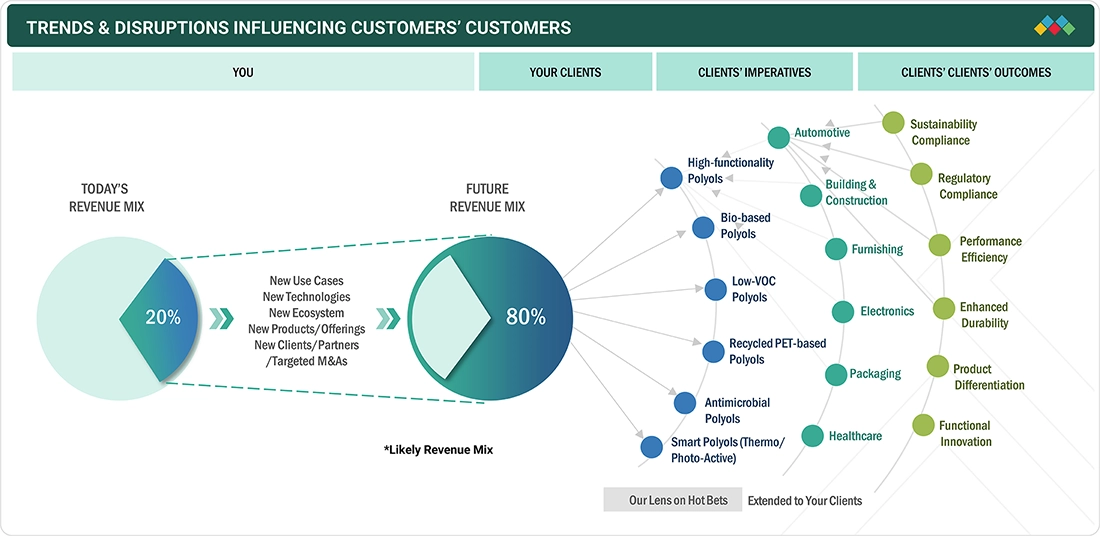
The global polyols market size was valued at USD 16.83 billion in 2025 and is projected to reach USD 21.59 billion by 2030, growing at 5.1% cagr from 2025 to 2030. The polyols market size is undergoing a structural shift, with revenue diversification expected between 2024 and 2030, driven by new use cases, technologies, and ecosystem partnerships. While building and construction, packaging, automotive, and furnishing dominated in 2024, electronics and other end-use industries are projected to gain share by 2030. Leading clients such as BASF, Dow Inc., Toyota, and Kingspan are prioritizing imperatives like high-performance, lightweight materials, cost-efficient supply, and high-performance insulation, aligning outcomes with eco-friendly solutions, reduced emissions, and enhanced safety. The impact on consumers’ business emerges from customer trends or disruptions.
KEY TAKEAWAYS
-
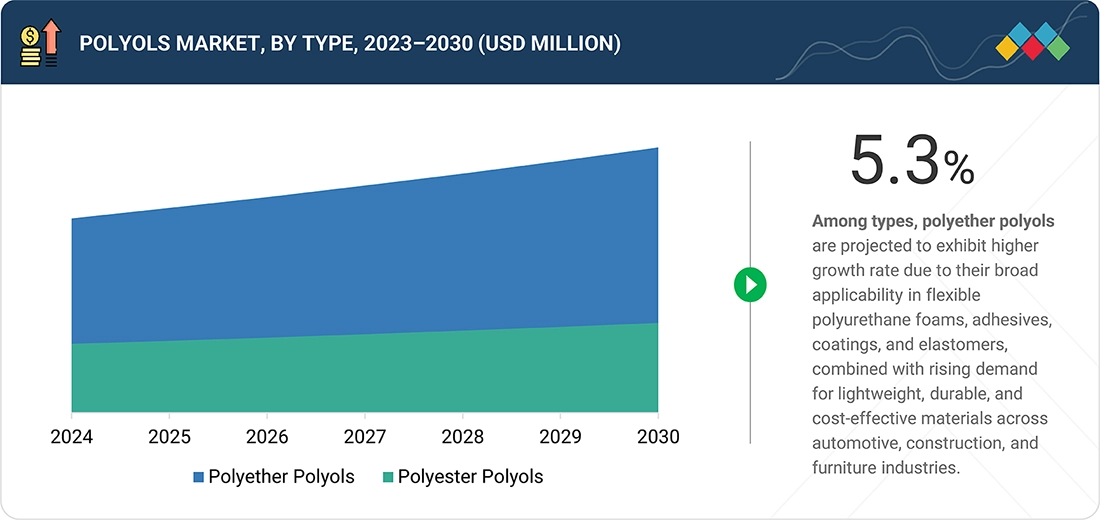
BY TYPEThe polyols market, by type, is segmented into polyether polyols and polyester polyols, with polyether polyols accounting for the largest share due to their widespread use in flexible and rigid polyurethane foams. These foams are essential in furniture, bedding, automotive seating, and insulation materials, driving strong consumption. Their advantages, including lower cost, excellent hydrolytic stability, and versatility across applications, reinforce their dominance. Polyester polyols, though smaller in share, are gaining traction in high-performance coatings, adhesives, sealants, and elastomers, supported by their superior mechanical strength and chemical resistance. Both segments collectively support diverse industrial growth.
-
BY APPLICATIONThe polyols market is segmented by application into flexible polyurethane foam, rigid polyurethane foam, and CASE (coatings, adhesives, sealants, and elastomers). Flexible polyurethane foam is estimated to account for the largest share, driven by its extensive use in furniture, mattresses, automotive seating, and packaging, where comfort, durability, and lightweight properties are critical. Its versatility across consumer and industrial applications continues to support strong demand. Rigid polyurethane foam is expanding in insulation and construction due to energy-efficiency requirements, while CASE applications benefit from increasing use in protective coatings, adhesives, and elastomers across industrial and infrastructure projects.
-
BY END-USE INDUSTRYThe polyols market by end-use industry is segmented into building & construction, automotive, furnishing, packaging, electronics, and other end-use industries. Among these, the furnishing sector, primarily driven by flexible polyurethane foam, accounts for the largest share due to its extensive use in furniture, mattresses, and bedding products. Rising consumer demand for comfort, lightweight materials, and durable cushioning continues to strengthen this dominance. The automotive industry is another key growth area, utilizing polyols in seating and interior components, while construction, packaging, and electronics industries contribute steadily through applications in insulation, coatings, and specialized foams.
-
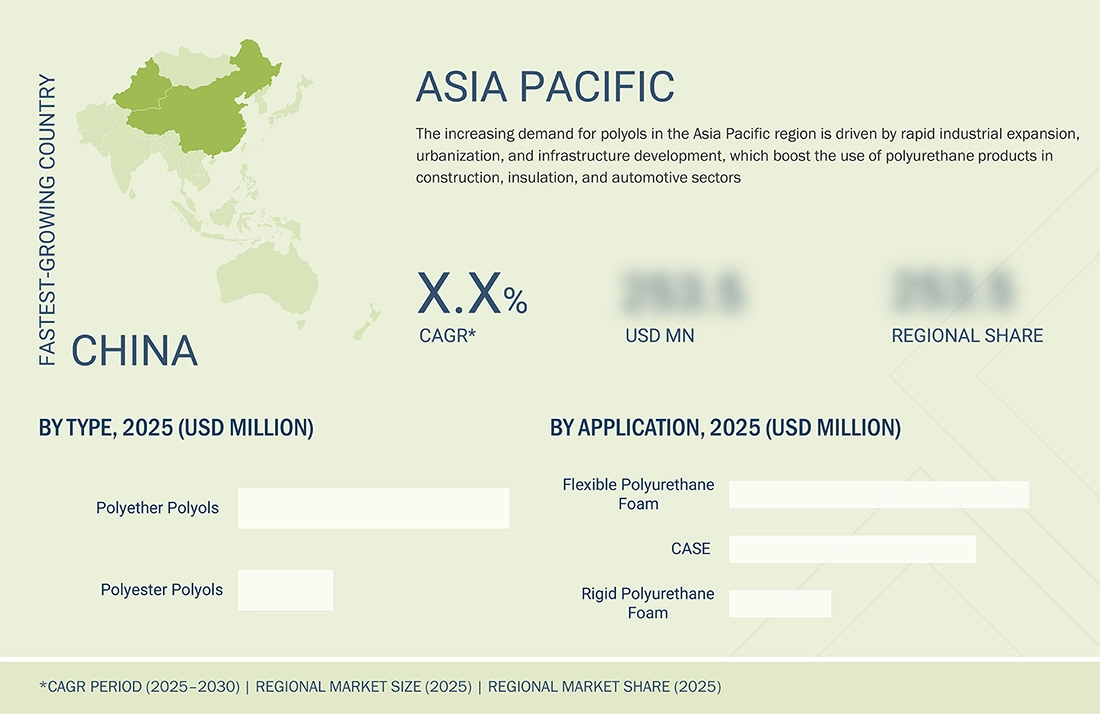
BY REGIONThe polyols market is segmented by region into North America, Europe, Asia Pacific, South America, and the Middle East & Africa. Asia Pacific accounts for the largest share, driven by rapid industrialization, urbanization, and strong demand from the construction, automotive, and furnishing industries. Rising disposable incomes and expanding consumer markets in countries like China and India further boost demand for flexible polyurethane foams in furniture, bedding, and vehicle interiors. North America and Europe remain significant markets, supported by mature construction and automotive sectors, while South America and the Middle East & Africa show steady growth potential.
-
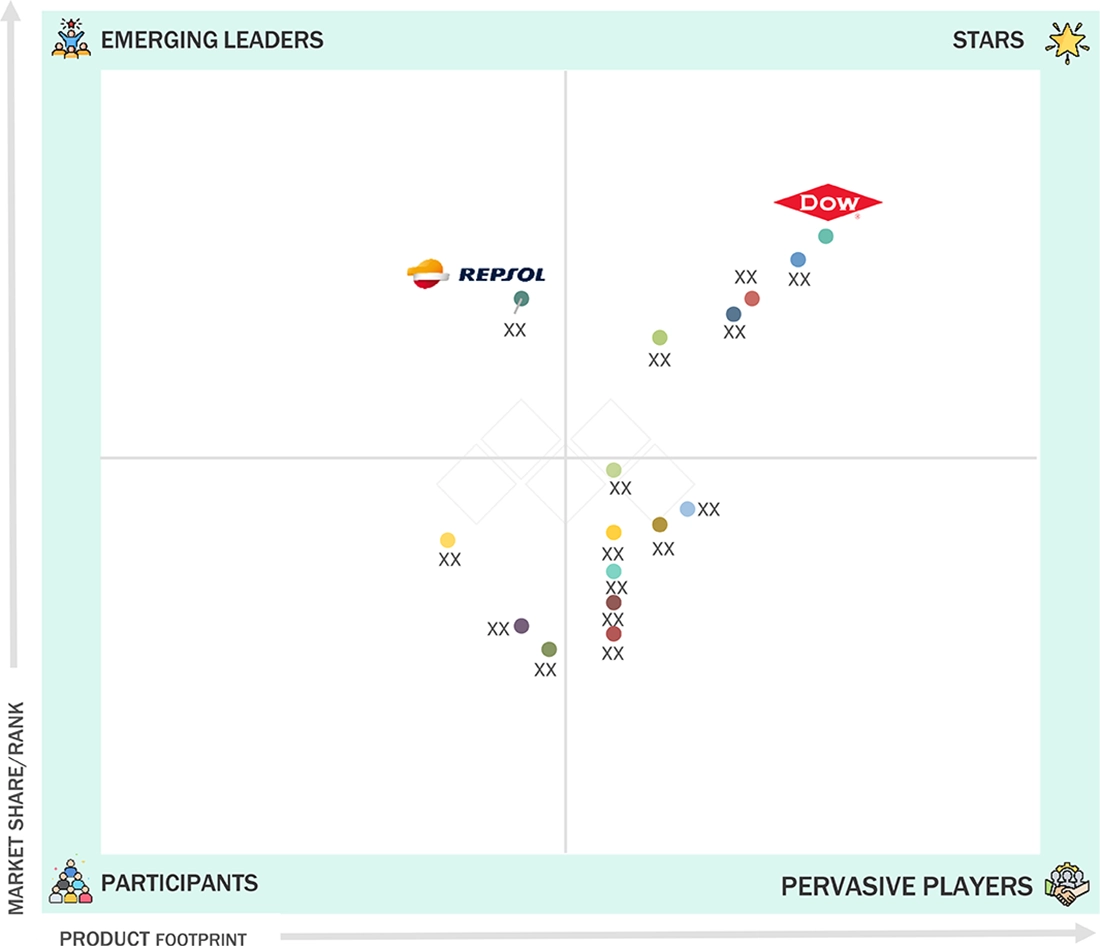
COMPETITIVE LANDSCAPEThe major market players have adopted both organic and inorganic strategies, including partnerships and investments. DOW (US), Covestro AG (Germany), BASF SE (Germany), Huntsman International LLC (US), Shell (UK), Stepan Company (US), and Wanhua Chemical Group (China), are entered into number of agreements and partnerships to cater the growing demand for polyols across various end-use industries.
The impact on consumers’ business emerges from customer trends or disruptions. As per MarketsandMarkets' polyols market analysis, the market size is undergoing a structural shift, with revenue diversification expected between 2024 and 2030, driven by new use cases, technologies, and ecosystem partnerships. While building and construction, packaging, automotive, and furnishing dominated in 2024, electronics and other end-use industries are projected to gain share by 2030. Leading clients such as BASF, Dow Inc., Toyota, and Kingspan are prioritizing imperatives like high-performance, lightweight materials, cost-efficient supply, and high-performance insulation, aligning outcomes with eco-friendly solutions, reduced emissions, and enhanced safety.
POLYOLS MARKET TRENDS ANALYSIS & DISRUPTIONS IMPACTING CUSTOMERS' CUSTOMERS
The impact on consumers’ business emerges from customer trends or disruptions. The polyols market is undergoing a structural shift, with revenue diversification expected between 2024 and 2030, driven by new use cases, technologies, and ecosystem partnerships. While building and construction, packaging, automotive, and furnishing dominated in 2024, electronics and other end-use industries are projected to gain share by 2030. Leading clients such as BASF, Dow Inc., Toyota, and Kingspan are prioritizing imperatives like high-performance, lightweight materials, cost-efficient supply, and high-performance insulation, aligning outcomes with eco-friendly solutions, reduced emissions, and enhanced safety.
Source: Secondary Research, Interviews with Experts, MarketsandMarkets Analysis
POLYOLS MARKET DYNAMICS
Level
-
Growth of packaging industry

-
Automotive light-weighting trend

Level
-
The impact on consumers’ business emerges from customer trends or disruptions. The polyols market is undergoing a structural shift, with revenue diversification expected between 2024 and 2030, driven by new use cases, technologies, and ecosystem partnerships. While building and construction, packaging, automotive, and furnishing dominated in 2024, electronics and other end-use industries are projected to gain share by 2030. Leading clients such as BASF, Dow Inc., Toyota, and Kingspan are prioritizing imperatives like high-performance, lightweight materials, cost-efficient supply, and high-performance insulation, aligning outcomes with eco-friendly solutions, reduced emissions, and enhanced safety.

-
Stringent environmental regulations for polyurethane foam

Level
-
Growing adoption of bio-based polyols

-
High-purity polyols for medical grade applications

Level
-
Eco-friendly alternatives

-
Cross-border compliance complexity for CASE polyols

Source: Secondary Research, Interviews with Experts, MarketsandMarkets Analysis
DRIVER: Automotive light-weighting trend
Lightweighting in the automotive industry is a significant contributor to the polyols market as most manufacturers are shifting to polyurethane foams and other such materials in a bid to lower vehicle weights without compromising on safety, comfort, and durability. Polyether polyols are also commonly used in flexible polyurethane foams in seating, headrests, and interior components, which provide good cushioning with reduced density. Rigid polyurethane foams are also useful in lightweight construction and better thermal insulation of cars. With the focus on fuel efficiency and reduced carbon emissions in the world regulatory framework, car manufacturers are focusing on lightweight materials. This change is not only conducive to low fuel usage in regular cars but also to the performance and range of electric cars, thus solidly establishing polyols as a key material in future automotive design and development in terms of sustainability.
RESTRAINT: Complexity in recycling polyurethane products
Recycling of polyurethane goods is complicated, and this is a major restraint to the polyols market. Polyurethane foams are polyol-derived products that find large applications in furniture, automotive, construction, and packaging, yet have a cross-linked chemical structure, which renders them difficult to recycle. Contrary to thermoplastics that can be melted and reformed, polyurethane materials typically have to be subjected to expensive chemical recycle operations, including glycolysis or hydrolysis recycles, which are yet to be commercially scaled. The most common are landfilling and incineration, which are not only sources of environmental issues and regulatory pressures. The increases in focus on circular economy models also point to the lack of sustainable end-of-life solutions pertaining to polyurethane. This recycling task restricts the industry from achieving its sustainability goals completely, which can delay the increase in demand for environmentally conscious markets.
OPPORTUNITY: Growing adoption of bio-based polyols
The polyols market is beset with the growing prospects of bio-based polyols being used, as more and more companies are demanding sustainability, and regulatory pressures are in support of the use of green materials. Using renewable feedstocks like soybean oil, castor oil, and other plant-based feedstocks, bio-based polyols help to decrease the use of petroleum-based raw material and minimize the carbon footprint of polyurethane manufacturing. They can provide similar performance in use in foams, coatings, adhesives, and sealants, and fit the circular economy objectives. The increase in consumer preference towards green products, combined with strict environmental policies in other parts of the world like Europe and North America, is increasing their usage. The business viability of bio-based polyols in a variety of end-use industries continues to increase with continuous innovation and investment in low-cost production technologies.
CHALLENGE: Cross-border compliance complexity for CASE polyols
The emergence of growing cross-border compliance complexity is becoming a major challenge to the polyols market, especially when used on CASE (coatings, adhesives, sealants, and elastomers). Variations in regulation by region, including the REACH regulation in Europe, the TSCA regulation in the US, and changing safety standards in Asia, add challenges to manufacturers in maintaining a consistent product approval and compliance. This regulatory fragmentation adds to the expenses, slows the market entry, and makes it harder to manage the supply chains of global CASE polyols producers. Moreover, the increased attention to the study of volatile organic compound (VOC) emissions and the tightening of environmental standards involve the necessity of continuous reformulation and testing, which also imposes additional pressure. These complexities restrict cross-border flexibility and provide obstacles to companies that seek to grow CASE applications in high-growth foreign markets.
Polyols Market: COMMERCIAL USE CASES ACROSS INDUSTRIES
| COMPANY | USE CASE DESCRIPTION | BENEFITS |
|---|---|---|
 |
The impact on consumers’ business emerges from customer trends or disruptions. The polyols market is undergoing a structural shift, with revenue diversification expected between 2024 and 2030, driven by new use cases, technologies, and ecosystem partnerships. While building and construction, packaging, automotive, and furnishing dominated in 2024, electronics and other end-use industries are projected to gain share by 2030. Leading clients such as BASF, Dow Inc., Toyota, and Kingspan are prioritizing imperatives like high-performance, lightweight materials, cost-efficient supply, and high-performance insulation, aligning outcomes with eco-friendly solutions, reduced emissions, and enhanced safety. | The CO2-based elastomer offers excellent performance under dynamic loading, resists hydrolysis, and reduces carbon footprint. It demonstrates the feasibility of using captured CO2 in demanding industrial applications, promoting circularity and sustainability in renewable energy sectors. |
 |
Huntsman created TEROL® polyester polyols from recycled PET bottles to produce rigid polyurethane insulation foams. The goal was to divert plastic waste from landfills, enhance energy efficiency in buildings, and meet insulation performance and fire safety regulations for residential, commercial, and industrial applications. | TEROL® polyols improve compressive strength, thermal insulation, and flame-retardant compatibility while converting over one billion PET bottles annually into valuable materials. This approach reduces plastic waste, lowers building energy consumption, and supports scalable, circular, and environmentally compliant construction solutions. |
 |
BASF engineered low-emission Lupranol® polyether polyols to reduce aldehyde emissions from polyurethane foams used in automotive interiors. The aim was to help OEMs meet strict VOC regulations while maintaining foam properties such as resilience, durability, and processability for components like headrests, seats, and insulation panels. | Low-emission polyols reduce formaldehyde and acetaldehyde by up to 20%, meeting VDA276 and BMW GS 97014-3 standards. The solution improves in-cabin air quality without altering foam processing, supporting regulatory compliance and healthier environments for vehicle occupants. |
Logos and trademarks shown above are the property of their respective owners. Their use here is for informational and illustrative purposes only.
POLYOLS MARKET ECOSYSTEM ANALYSIS
The impact on consumers’ business emerges from customer trends or disruptions. The polyols market is undergoing a structural shift, with revenue diversification expected between 2024 and 2030, driven by new use cases, technologies, and ecosystem partnerships. While building and construction, packaging, automotive, and furnishing dominated in 2024, electronics and other end-use industries are projected to gain share by 2030. Leading clients such as BASF, Dow Inc., Toyota, and Kingspan are prioritizing imperatives like high-performance, lightweight materials, cost-efficient supply, and high-performance insulation, aligning outcomes with eco-friendly solutions, reduced emissions, and enhanced safety.
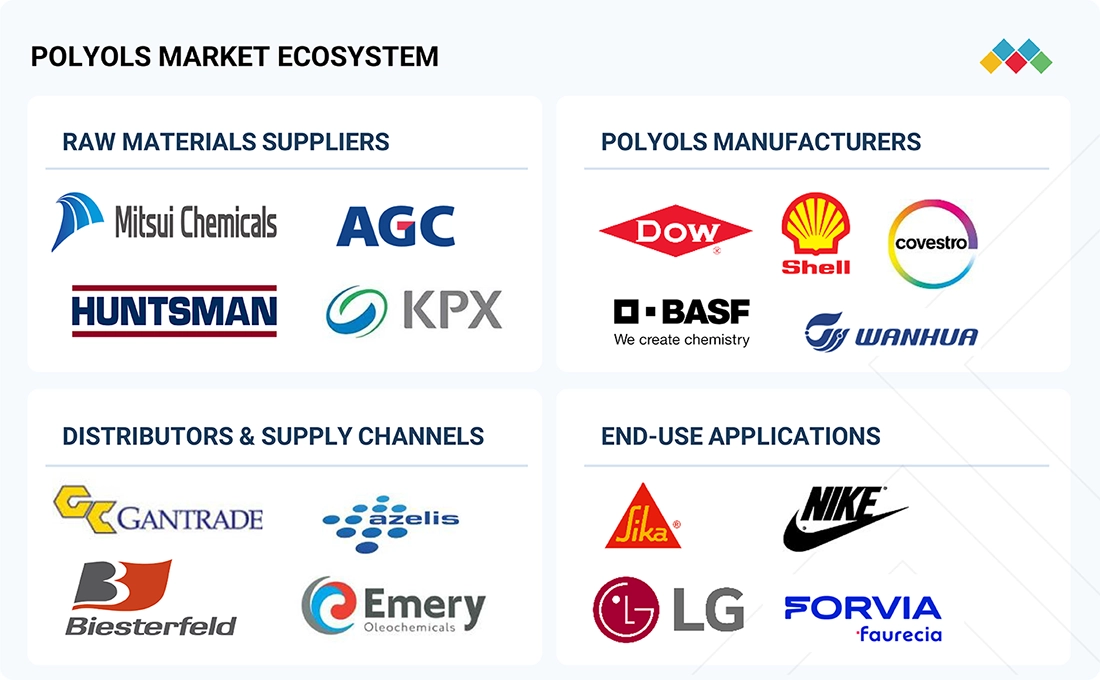
Logos and trademarks shown above are the property of their respective owners. Their use here is for informational and illustrative purposes only.
POLYOLS MARKET SEGMENTS
Source: Secondary Research, Interviews with Experts, MarketsandMarkets Analysis
Polyols Market, By Type Polyether polyols drove growth in the polyols market in 2024 due to their versatility and broad applications
In 2024, polyether polyols accounted for the largest share of the global polyols market due to their versatile properties and wide range of applications. These polyols are also well appreciated due to their good hydrolytic stability, flexibility and toughness that qualify them as good materials in the manufacture of flexible and rigid polyurethane foam. Flexible foams have many applications in furniture, sleeping, and automotive interiors, whereas rigid foams are essential in insulation in building and refrigeration. The capacity of the material to provide lightweight, strong and energy-efficient solutions has also enhanced its usage in industries. In addition, the increasing trend in the demand of comfort, high-performance material and sustainable solutions in end-use products like automotive, construction, and consumer goods remains a major contributor to the popularity of polyether polyols. Their versatility, affordability, and compatibility to the new bio-based technologies are the reasons that polyether polyols will continue to dominate the polyols market.
Polyols Market, By Application Flexible polyurethane foam contributed significantly to polyols demand in 2024 because of its use in furniture, bedding, and automotive interiors
In 2024, the flexible polyurethane (PU) foam segment accounted for the largest share of the global polyols market, reflecting its extensive applications and high demand across multiple industries. The flexible PU foams are produced primarily using polyether polyols and are valued due to their comfort, strength and lightness hence they find application in furniture, bedding, car seats and cushions in the interior. The increasing demand in the furniture and automotive industries is also a result of the increasing consumerism in ergonomic and comfortable furniture and cars. Also, flexible PU foams are highly processable, durable, and energy efficient and this justifies their extensive usage in different applications. Growth in the segment is also due to the innovations in bio-based and specialty polyols, which allows manufacturers to create foams which are more environmentally sustainable and performance-based. All these, coupled with the growing construction process as well as the growth of vehicle manufacturing and the growth of the demand of high-quality consumer goods, have cemented the flexible PU foam segment as the most popular end-use category in polyols market.
Polyols Market, By End-use Industry Building and construction increased polyols consumption in 2024, driven by insulation, coatings, and adhesive applications
In 2024, the building and construction sector emerged as the largest end-use industry for polyols, reflecting the material’s critical role in producing high-performance polyurethane products. Different applications of polyols involve rigid and flexible polyurethane foams, coatings, adhesives, and sealants used in the production of insulation, structure, and interior finishes in residential, commercial, and industrial construction. The increased concern with energy-efficient and sustainable buildings has led to the reduction of polyol-based insulation products with their excellent thermal performance, durability, and lightweight properties. The high rate of urbanization, infrastructural development, and the rising construction projects in the emerging economies have further contributed to the consumption of polyols in this sector. Polyols have been used to provide solutions for soundproofing, waterproofing, and fire resistance where customization is necessary, and this has strengthened their relevance in the current trend in construction.
REGION
Asia Pacific experienced strong polyols market growth in 2024, supported by industrialization, infrastructure development, and rising end-use demand
The polyols market of the Asia Pacific region also recorded the largest share of the global polyols market, in 2024, due to the high rate of industrialization, urbanization and the growing end-use industries. The region has seen tremendous growth in construction, automotive, furniture, and consumer goods-based industries that are all major users of polyols in the production of polyurethane foams, coatings, adhesives, sealants, and elastomers. Rapidly emerging markets like China, India, Japan and South Korea have become important players owing to the growing infrastructural growth, increasing disposable income as well as growing need of light and energy efficient materials. Moreover, the availability of the large polyols producers and distributors as well as the good government policies that favor the manufacturing and urban development have reinforced the market growth. The necessity of high-performance and flexible polyurethane foams in bedding and furniture, as well as automotive seats, and increased use of sustainable and high-performance polyols have confirmed that Asia Pacific was the most promising polyols regional market in 2024.
Polyols Market: COMPANY EVALUATION MATRIX
The impact on consumers’ business emerges from customer trends or disruptions. The polyols market is undergoing a structural shift, with revenue diversification expected between 2024 and 2030, driven by new use cases, technologies, and ecosystem partnerships. While building and construction, packaging, automotive, and furnishing dominated in 2024, electronics and other end-use industries are projected to gain share by 2030. Leading clients such as BASF, Dow Inc., Toyota, and Kingspan are prioritizing imperatives like high-performance, lightweight materials, cost-efficient supply, and high-performance insulation, aligning outcomes with eco-friendly solutions, reduced emissions, and enhanced safety.
Source: Secondary Research, Interviews with Experts, MarketsandMarkets Analysis
KEY MARKET PLAYERS
- DOW (US)
- Covestro AG (Germany)
- BASF SE (Germany)
- Huntsman International LLC (US)
- Shell (UK)
- Stepan Company (US)
- Wanhua Chemical Group (China)
- Repsol S.A. (Spain)
- PCC SE (Germany)
- LANXESS (Germany)
- Zibo Dexin Lianbang Chemical Industry Co., Ltd. (China)
- Shandong Longhua New Material Co., Ltd (China)
- Zhejiang Huafon New Materials Corp., Ltd. (China)
- Shakun Industries (India)
- InterPur Chemicals (Spain)
MARKET SCOPE
| REPORT METRIC | DETAILS |
|---|---|
| Market Size, 2024 (Value) | USD 16.01 Billion |
| Market Forecast, 2030 (Value) | USD 21.59 Billion |
| Growth Rate | CAGR of 5.1% from 2025 to 2030 |
| Years Considered | 2021–2030 |
| Base Year | 2024 |
| Forecast Period | 2025–2030 |
| Units Considered | Value (USD Billion), Volume (Kiloton) |
| Report Coverage | Revenue forecast, company ranking, competitive landscape, growth factors, and trends |
| Segments Covered | • By Type: Polyether Polyols and Polyester Polyols • By Application: Flexible Polyurethane Foam, Rigid Polyurethane Foam, and CASE (Coatings, Adhesives, Sealants, and Elastomers) • By End-use Industry: Building & Construction, Automotive, Furnishing, Packaging, Electronics, and Other End-use Industries |
| Regions Covered | North America, Asia Pacific, Europe, South America, and the Middle East & Africa |
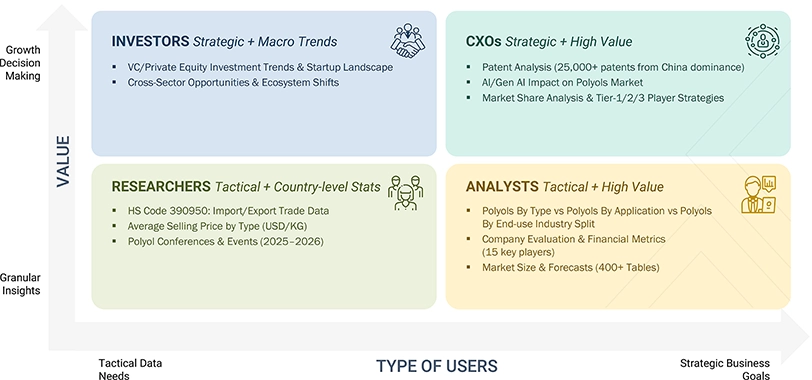
WHAT IS IN IT FOR YOU: Polyols Market REPORT CONTENT GUIDE
DELIVERED CUSTOMIZATIONS
We have successfully delivered the following deep-dive customizations:
| CLIENT REQUEST | CUSTOMIZATION DELIVERED | VALUE ADDS |
|---|---|---|
| Polyurethane Foam Market | The impact on consumers’ business emerges from customer trends or disruptions. The polyols market is undergoing a structural shift, with revenue diversification expected between 2024 and 2030, driven by new use cases, technologies, and ecosystem partnerships. While building and construction, packaging, automotive, and furnishing dominated in 2024, electronics and other end-use industries are projected to gain share by 2030. Leading clients such as BASF, Dow Inc., Toyota, and Kingspan are prioritizing imperatives like high-performance, lightweight materials, cost-efficient supply, and high-performance insulation, aligning outcomes with eco-friendly solutions, reduced emissions, and enhanced safety. | • Identified & profiled 20+ polyurethane Foam companies |
RECENT DEVELOPMENTS
- May 2025 : The impact on consumers’ business emerges from customer trends or disruptions. The polyols market is undergoing a structural shift, with revenue diversification expected between 2024 and 2030, driven by new use cases, technologies, and ecosystem partnerships. While building and construction, packaging, automotive, and furnishing dominated in 2024, electronics and other end-use industries are projected to gain share by 2030. Leading clients such as BASF, Dow Inc., Toyota, and Kingspan are prioritizing imperatives like high-performance, lightweight materials, cost-efficient supply, and high-performance insulation, aligning outcomes with eco-friendly solutions, reduced emissions, and enhanced safety.
- May 2025 : BASF introduced the Sovermol® bio-based polyol line rapeseed, soybean, castor-oil derived, low-viscosity, 100% solids products ideal for coatings, adhesives, PU foams and reactive diluents, expanding global availability (including Sovermol?805ap from India.
- December 2024 : Dow launched VORANOL™ WK5750, a next-generation polyether polyol produced at its Freeport, Texas facility. The product was tailored for soft and hypersoft foams and also functions as an effective cell opener for viscoelastic and high-resilience applications.
- November 2024 : DOW announced the closure of its Freeport, Texas, PO plant (shutdown by the end of 2025) and San Lorenzo, Argentina, polyether polyols plant due to oversupply and low utilization. It reflected strategic portfolio rationalization.
- August 2024 : BASF SE signed an MoU with UPC Technology (Asia), focusing on the supply of low-carbon oxo-alcohols (2-ethylhexanol, n-butanol) and catalysts, supporting sustainable hydrocarbons for plasticizers and relevant feedstocks in polyol value chains.
Table of Contents
 Exclusive indicates content/data unique to MarketsandMarkets and not available with any competitors.
Methodology
The study involved four main activities to estimate the current global size of the polyols market. Comprehensive secondary research was conducted to gather information on the market, its peer markets, and the parent market. The next step was to validate these findings, assumptions, and sizes with industry experts across the polyols value chain through primary research. Both top-down and bottom-up approaches were used to estimate the overall size of the polyols market. Afterwards, market breakdowns and data triangulation procedures were applied to determine the sizes of different segments and sub-segments of the market.
Secondary Research
During the secondary research process, secondary sources such as Business Standard, Bloomberg, World Bank, and Factiva were used to gather information on the polyols market for this study. These sources included annual reports, press releases and investor presentations from companies, white papers, certified publications, articles by recognized authors, regulatory bodies, trade directories, and databases.
Primary Research
Various primary sources from both the supply and demand sides of the polyols market were interviewed to gather qualitative and quantitative information. The primary sources from the supply side included industry experts, such as Chief Executive Officers (CEOs), vice presidents, marketing directors, sales professionals, and other key executives from leading companies and organizations operating in the polyols industry. The breakdown of the profiles of primary respondents is as follows:
Breakdown of Primary Interviews

Notes: Companies are classified based on their revenue–Tier 1 = >USD 7 billion, Tier 2 = USD 500 million to USD 7 billion, and Tier 3 = < USD 500 million.
Other designations include sales, marketing, and product managers.
To know about the assumptions considered for the study, download the pdf brochure
Market Size Estimation
Both the top-down and bottom-up approaches were used to estimate and validate the global polyols market size. These methods were also extensively employed to determine the size of various related market segments. The research methodology used to estimate the market size included the following details:
- The key players were identified through comprehensive secondary research.
- In terms of value, the industry’s supply chain and market size were determined through primary and secondary research methods.
- All percentage shares, splits, and breakdowns were calculated using secondary sources and verified via primary sources.
- All relevant parameters influencing the markets covered in this research were carefully considered, examined in detail, verified through primary research, and analyzed to produce the final quantitative and qualitative data.
- The research includes the review of reports, reviews, and newsletters of key industry players, along with extensive interviews with key officials such as directors and marketing executives.

Data Triangulation
After estimating the overall market size using the process outlined above, the market was divided into various segments and sub-segments. Data triangulation and market breakdown methods were used, where applicable, to complete the overall market analysis and determine precise statistics for all segments and sub-segments of the polyols market. The data was triangulated by examining a range of factors and trends from both demand and supply perspectives. Additionally, the market size was validated through top-down and bottom-up approaches and confirmed through primary interviews. Therefore, three sources were used for each data segment—top-down approach, bottom-up approach, and expert interviews. The data was considered accurate when the values from all three sources aligned.
Market Definition
Polyols are organic molecules characterized by containing multiple hydroxyl (–OH) groups. In the industrial sector, polyols are vital components used to produce polyurethanes. Since polyols can react with isocyanates to form various end-use polymers in foam, elastomers, coatings, adhesives, and sealants, they can be broadly categorized into two classes: polyether and polyester polyols, each with distinct properties suitable for different applications. Polyols can be derived from petrochemicals or renewable feedstocks, such as natural oils and sugars. They offer limitless possibilities in various end-use applications, and their excellent performance characteristics make them highly attractive to many industries, including construction, automotive, furniture, packaging, and consumer goods. Recently, bio-based polyols have advanced significantly due to environmental concerns and regulatory pressures.
Stakeholders
- Polyols manufacturers
- Polyols distributors
- Raw material suppliers
- Research & development entities
- Industry associations and regulatory bodies
- End users
Report Objectives
- To estimate and forecast the polyols market, in terms of value and volume
- To provide detailed information about the major factors (drivers, restraints, opportunities, and challenges) influencing the market growth
- To define, describe, and forecast the market size based on type, application, end-use industry, and region
- To forecast the market size along with segments and submarkets, in key regions: North America, Europe, Asia Pacific, the Middle East & Africa, and South America, along with their key countries
- To strategically analyze micro markets for individual growth trends, prospects, and their contribution to the total market
- To analyze growth opportunities in the market for stakeholders and provide details on the competitive landscape for market leaders
- To strategically profile key players and comprehensively analyze their market shares and core competencies
- To analyze competitive developments, such as mergers & acquisitions, expansions & investments, and agreements in the polyols market
Key Questions Addressed by the Report
What are the major drivers influencing the growth of the polyols market?
The main drivers are the growth of the packaging industry, the automotive lightweighting trend, and the expanding use of flexible polyurethane (PU) in wearables and footwear.
What are the major challenges in the polyols market?
Eco-friendly alternatives and cross-border compliance complexity pose significant challenges for the polyols market.
What are the restraining factors in the polyols market?
Complexity in recycling polyurethane products and strict environmental regulations for polyurethane foam are key restraining factors.
What is the key opportunity in the polyols market?
The growing adoption of bio-based polyols and high-purity polyols for medical-grade applications offers substantial growth opportunities.
Who are the key players in the polyols market?
Key players include DOW (US), Covestro AG (Germany), BASF SE (Germany), Huntsman International LLC (US), Shell (UK), Stepan Company (US), Wanhua Chemical Group (China), Repsol S.A. (Spain), PCC SE (Germany), and LANXESS (Germany).
Need a Tailored Report?
Customize this report to your needs
Get 10% FREE Customization
Customize This ReportPersonalize This Research
- Triangulate with your Own Data
- Get Data as per your Format and Definition
- Gain a Deeper Dive on a Specific Application, Geography, Customer or Competitor
- Any level of Personalization
Let Us Help You
- What are the Known and Unknown Adjacencies Impacting the Polyols Market
- What will your New Revenue Sources be?
- Who will be your Top Customer; what will make them switch?
- Defend your Market Share or Win Competitors
- Get a Scorecard for Target Partners

Custom Market Research Services
We Will Customise The Research For You, In Case The Report Listed Above Does Not Meet With Your Requirements
Get 10% Free CustomisationTESTIMONIALS

We at Nissan Chemicals Corporation have been clients of MarketsandMarkets for more than a year now. We recently consulted MarketsandMarkets for a study, the team at MarketsandMarkets was extremely professional and organized. The business insights were very detailed and aligned well with our expectations that really helped us formulate the Business Plans and device new strategies for development themes. MarketsandMarkets offers a unique combination of expertise and dedicated engagement model. Their research findings have helped us in designing our Pricing Strategy which will make it easier for us to predict the future sales and profits for the next ten years. We look forward to working with MarketsandMarkets in the future.
VP of Strategy & New Business Development
Leading Specialty Chemical Company
The MarketsandMarkets Engagement Model, composed of both the Knowledge Store and advisory custom research, has greatly helped us in understanding our markets and making strategic decisions. The Knowledge Store is a fast way to allow everyone in our organization to understand more about most any market they are interested in. The ability to then get custom research done and get answers to specific strategic questions and market insight has been spectacular. The Markets and Markets team feel more like colleagues than vendors and their services have helped us change our culture where statements of things like growth opportunities and competitive position are always backed by industry research.

Rich Gibson,
Director, Corporate Strategy
Milliken & Company,
Leading Industrial Manufacturer of specialty chemical, floor covering, performance and protective textile materials, and healthcaremilliken.com
MarketsandMarkets is a trusted resource that helps us to better understand markets that are near-adjacencies-whether its technology, value chain or geography. Their Knowledge Store platform provides a dashboard of markets and their characteristics which is easy to use and saves us time.
Adam Shaw,
Market Development and Strategy Manager
AdvanSix Inc. USA,
An American Leader in Chemicalswww.advansix.com
The Knowledge Store from MarketsandMarkets is a valuable tool which has helped my team acquire greater insight in to the end markets that our business serves. This has enabled us to help our company build stronger strategies throughout our planning process.
TOSHIO KINOSHITA
Senior Chif Consultion Research & Consulting Division
Mitsubishi Chemical Research Corporation,
Leading Manufacturer of Chemical Productswww.mitsubishichem-res.co.jp/en/

We recently engaged with MarketsandMarkets for a study, the team not only clearly understood our business objectives but was also extremely professional in the way they handled the entire project. The study was efficiently conducted in a phase-wise manner, and the engagement model furnished us with high-quality business insights that far exceeded our expectations at each phase. We were especially happy that MarketsandMarkets could provide us with both, an English as well as a Japanese version of the study. A special thanks to the Analyst Team and Client Services Team, whose fluency in Japanese enhanced our comfort level, as we could converse with them in our preferred language.
Independent entrepreneurs
Arrow Precision
We approached MarketsandMarkets for study on Proppants Market, and their work exceeded our expectations. The study conducted was comprehensive and enabled us to view the market through the various dimensions. In addition, the team was extraordinarily responsive throughout the process and resolved our queries on time. I strongly recommend MarketsandMarkets and will certainly consider them for additional market assessments we will need in the future.
Global engineering company, Japan
Deputy Manager,
Strategic Planning OfficeThe high-quality insights shared by the MarketsandMarkets team helped us understand the pharmaceutical plant designers in a specific geography. It also captured the risks that we may likely face in communicating with our potential partners. The study would enable us identify partners, which would impact our future growth.
Growth opportunities and latent adjacency in Polyols Market


Laleh
Jul, 2019
Would like to understand polyester polyols via PET scrap technology and difference between Polyol polyester based and polyether based polyol.
Ravi
Jan, 2019
Opportunities in Polyol Trading for various applications in India.
Ravi
Jan, 2019
Information on Polyol trading in India and APAC..
LANDUCCI
Mar, 2013
Need information on PUR raw materials.
LANDUCCI
Mar, 2013
UV stabilization market and heat applications.
LANDUCCI
Mar, 2013
Marke data for Heat and UV stabilization market and raw materials information.
LANDUCCI
Mar, 2013
Specifc information on uses of heat and UV stabilization during Polyol and PU system production.
LANDUCCI
Mar, 2013
Antioxidants and UV stabilizers for Polyol and Polyurethane appliucation.
LANDUCCI
Mar, 2013
Information on heat and UV stabilization needs (antioxydants, UV stabilizers and HALS) of PUR at raw material producers (polyol)and systems house & processors. .
LANDUCCI
Mar, 2013
Information on heat and UV stabilization needs (antioxydants, UV stabilizers and HALS) of PUR at raw material producers (polyol)and systems house & processors .
LANDUCCI
Mar, 2013
General information on polyols and understand UV stabilization needs (antioxydants, UV stabilizers and HALS) of PUR at raw material producers levels.
LANDUCCI
Mar, 2013
Specific interest in PUR market .
LANDUCCI
Mar, 2013
Interested in Polyurethane Resin market.
LANDUCCI
Mar, 2013
heat and UV stabilization needs (antioxydants, UV stabilizers and HALS) of PUR at raw material producers (polyol)and systems house & processors..
LANDUCCI
Mar, 2013
UV curing market /UV stabilizers.
LANDUCCI
Mar, 2013
UV stabalizer market report.
WALTER
Jan, 2015
Interested in information for Flexible PU Slabstock foam.
Patr�cia
Mar, 2019
General information on polyols.
paul
Jul, 2019
Demand of polyol polyurethane production and its application in construction industry .
J
Oct, 2014
Information about the polyester polyol market for Paints and coatings, by demand, by application, any sub-segment applications .
tondamanati
Dec, 2015
Information on xylitol study.
Jeff
Jul, 2019
Market information on Global Specialty Polyols.
James
Feb, 2013
Beginning the commercialization of the bio-based polyester polyol, interested in obtaining more market info..
Jason
Dec, 2017
Interested in the South-Korean PPG market (sample) to make a full report purchase.
Raja
Jul, 2015
Important physical delivery points, relevant quality labels/specifications for polyols and average Transaction Volume/Value. .
Ralph
May, 2014
Interested in Polyols market.
Doug
Mar, 2013
market and competitive dynamics for aliphatic polyester polyol within the Query not ClearFTA region with understanding of captive production vs. merchant market .
Doug
Mar, 2013
Specific information on North America aliphatic polyester polyol market .
Maciej
Feb, 2014
Interested in polyester polyol market, manufacturers, new trends in production and application.
Mustafa
Feb, 2019
Interested in Polyols market, use of Polyester and Polyether in flexible polyurethane foam application..