Preventive Diagnostics Market for Substation Equipment

Preventive Diagnostics Market for Substation Equipment by Diagnostics Type (Partial Discharge, Dissolved Gas Analysis & Oil-Gas, Thermal/Infrared, Insulating Gas Condition, Bushing, Mechanical, Vibration, & Acoustic Condition) - Forecast to 2036


Preventive Diagnostics Market OVERVIEW
According to Marketsandmarkets, the preventive diagnostic market for substation equipment is projected to reach USD 3.46 billion by 2036 from USD 1.91 billion in 2026, at a CAGR of 6.1%. The market is experiencing steady expansion due to the rising adoption of advanced condition monitoring technologies across utility networks.
The demand for real-time asset visibility, grid modernization, and predictive maintenance is accelerating the deployment of these diagnostic solutions. Grid operators are increasingly focusing on improving grid resilience, operational efficiency, and equipment lifecycle optimization. Consequently, the adoption of smart sensors, intelligent electronic devices, and edge analytics is increasing. The integration of predictive analytics, digital substations, and automated diagnostic tools significantly enhances utility operations. This integration minimizes unplanned outages and improves real-time decision-making. The demand for interoperable grid infrastructure continues to strengthen the global market. This demand is coupled with rising investments in aging substation modernization and renewable energy integration.
MARKET SCOPE
| REPORT METRIC | DETAILS |
|---|---|
| Market Size in 2026 (Value) | USD 1.91 Billion |
| Market Forecast in 2036 (Value) | USD 3.46 Billion |
| Growth Rate | CAGR of 6.1% from 2026–2036 |
| Years Considered | 2025–2036 |
| Base Year | 2025 |
| Forecast Period | 2026–2036 |
| Units Considered | Value (USD Billion) |
| Report Coverage | Revenue Forecast, Company Ranking |
| Top Companies |
|
| Growth Driver |
|
| Segments Covered |
|
| Regions Covered | North America, Europe, and Middle East |
KEY TAKEAWAYS
-
BY REGIONNorth America is expected to dominate the preventive diagnostic market for substation equipment with a share of ~44.8% in terms of value in 2036.
-
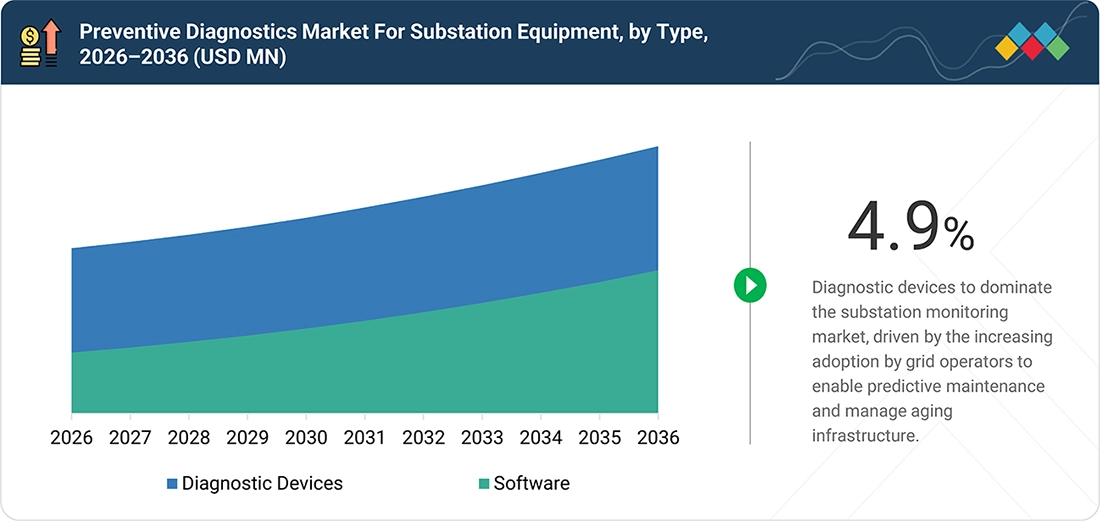
BY TYPEBy type, the diagnostic devices segment is expected to register the largest share during the forecast period.
-
BY DIAGNOSTIC DEVICESBy diagnostic devices, the partial discharge (PD) monitoring devices segment is expected to record the highest CAGR of ~6.1% during the forecast period.
-
By SOFTWAREBy software, the predictive maintenance & decision support platforms segment is expected to record the highest CAGR of ~11.2% during the forecast period.
-
COMPETITIVE LANDSCAPE: KEY PLAYERSHitachi Energy Ltd, Siemens Energy, and GE Vernova were identified as some of the star players in the preventive diagnostics market for substation equipment, given their strong market share and product footprint.
-
COMPETITIVE LANDSCAPE: STARTUPS/SMESEneryield AB and Oktogrid have distinguished themselves among startups and SMEs due to their strong product portfolio and business strategies.
The preventive diagnostic industry for substation equipment is expected to grow as grid operators increase investments in grid modernization, condition-based maintenance, and digital substation infrastructure. Market growth is further driven by the rising demand for real-time asset visibility, continuous equipment monitoring, predictive failure analysis, and improved grid reliability. Intelligent electronic devices, vibration sensors, dissolved gas analyzers, partial discharge monitors, and automated diagnostic tools are increasingly being integrated across electrical substations. This integration enhances structural asset management and operational safety. Technology developments by key players such as Hitachi Energy, Siemens Energy, GE Vernova, ABB Ltd., and Schneider Electric further support market expansion. These core developments include predictive analytics software, integrated digital substations, smart sensors, and advanced asset performance platforms.
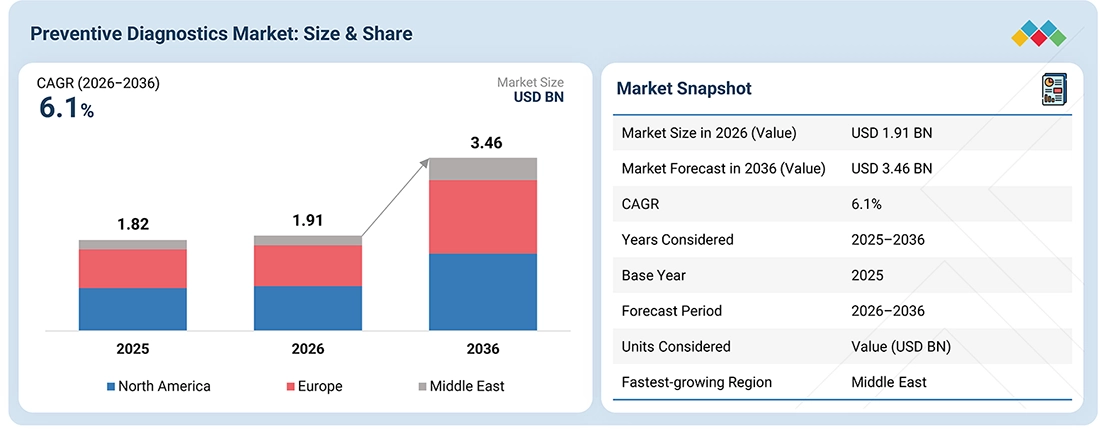
Source: Secondary Research, Interviews with Experts, MarketsandMarkets Analysis
TRENDS & DISRUPTIONS IMPACTING CUSTOMERS' CUSTOMERS
Preventive diagnostics for substation equipment is shifting from periodic, reactive maintenance toward continuous, condition-based and predictive asset management. Utilities and grid operators are increasingly adopting real-time sensors, partial-discharge monitoring, AI/ML-based analytics, digital twins, and multi-asset monitoring platforms to detect emerging faults earlier, reduce unplanned outages, optimize maintenance spending, and extend equipment life. At the same time, renewable integration, grid modernization, extreme-weather resilience, cybersecurity requirements, and aging substation assets are increasing the need for more intelligent and data-driven diagnostic solutions.
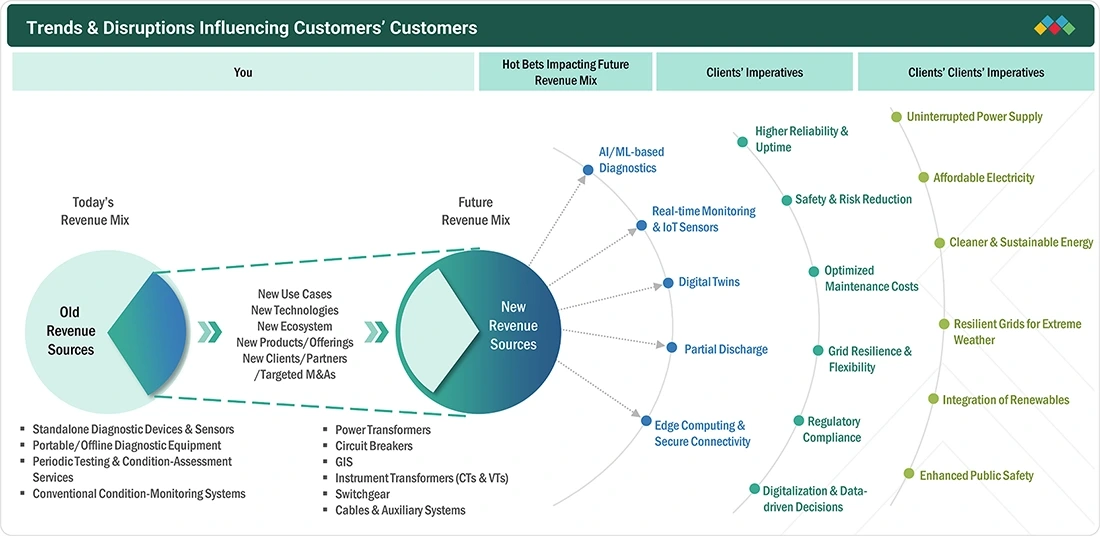
Source: Secondary Research, Interviews with Experts, MarketsandMarkets Analysis
MARKET DYNAMICS

Level
-
Rising Demand for Real-time Grid Monitoring Due to Renewable Energy Integration

-
Stringent grid safety and equipment inspection mandates


Level
-
High installation costs and legacy-system integration complexity

-
Cybersecurity risks from connected substation infrastructure


Level
-
AI-based predictive analytics and remote diagnostics for condition-based maintenance

-
Digital twins for asset management and operational optimization


Level
-
Shortage of skilled personnel for advanced diagnostic systems

-
Hardware compatibility issues across legacy and modern equipment

Source: Secondary Research, Interviews with Experts, MarketsandMarkets Analysis
Driver: Rising Demand for Real-time Grid Monitoring Due to Renewable Energy Integration
The growing integration of distributed renewable energy sources, particularly rooftop solar and small-scale wind, is creating more variable and decentralized power flows. Changes in renewable generation can cause voltage fluctuations, reverse power flows, and localized equipment loading, increasing the need for real-time grid visibility. Advanced monitoring systems enable utilities to track voltage, current, loading, and equipment conditions and respond quickly to changing operating conditions. According to NREL, higher distributed energy resource penetration can create operational challenges, including overvoltage, undervoltage, reverse power flows, and protection coordination issues. Consequently, utilities are increasingly adopting dynamic monitoring and diagnostic solutions to maintain grid stability and reliability.
Restraint: High installation costs and legacy-system integration complexity
High upfront costs for sensors, monitoring equipment, communication infrastructure, software, and system integration can delay upgrades across existing substations. Many utilities operate equipment from different technology generations, creating compatibility issues when integrating modern monitoring solutions with legacy systems. Upgrades may also require modifications to existing control systems, communication networks, and protection infrastructure, increasing implementation time and engineering requirements. Replacing functional legacy equipment solely to enable digital monitoring may not be economically viable for utilities with constrained budgets. Consequently, the capital investment and technical complexity associated with modernization can slow deployment, particularly across older substations with diverse equipment and long replacement cycles.
Opportinity: AI-based predictive analytics and remote diagnostics for condition-based maintenance
The growing availability of equipment condition data creates opportunities for AI-based predictive analytics and remote diagnostics. Modern monitoring systems can continuously capture operating parameters and equipment health indicators, enabling analytics platforms to identify abnormal conditions before failures occur. These capabilities can help utilities transition from scheduled or reactive maintenance toward condition-based maintenance. AI-based systems can analyze historical and real-time data to identify patterns, detect emerging faults, and support maintenance planning. Remote diagnostics can further reduce the need for frequent physical inspections by allowing operators to assess asset conditions remotely. As utilities seek to improve asset reliability and maintenance efficiency, vendors can expand offerings around predictive analytics, diagnostics, and digital asset-management services.
Challenges: Shortage of skilled personnel for advanced diagnostic systems
The increasing sophistication of digital grid monitoring systems requires personnel with expertise in power systems, communications, data analytics, cybersecurity, and equipment diagnostics. Traditional utility maintenance teams may not possess all these capabilities, particularly as utilities adopt AI-based analytics, remote monitoring platforms, and advanced condition-monitoring technologies. These systems also generate large volumes of operational data that require skilled interpretation to distinguish normal variations from emerging equipment problems. Utilities may therefore need to retrain existing employees or recruit specialized personnel, increasing implementation and training requirements. Smaller utilities can face greater constraints because of limited technical resources. The shortage of multidisciplinary expertise can consequently limit the effective deployment, operation, and maintenance of advanced diagnostic systems.
PREVENTIVE DIAGNOSTICS MARKET FOR SUBSTATION EQUIPMENT: COMMERCIAL USE CASES ACROSS INDUSTRIES
| COMPANY | USE CASE DESCRIPTION | BENEFITS |
|---|---|---|
 |
It implements predictive diagnostic tools and diagnosis services to monitor generation equipment using sensor data. The system collects pressure, temperature, and rotation data to perform condition-based maintenance. It evaluates the equipment condition to determine root causes of issues. | Reduces equipment failure rates | Minimizes unscheduled stoppages | Improves operational stability | Lowers maintenance costs |
 |
It utilizes condition monitoring in circuit breakers by recording usage patterns and disconnections. An algorithm calculates the remaining lifetime and health indicator of the main contacts. It uses operational data to forecast the physical state of the equipment. | Predicts remaining equipment lifetime | Identifies critical component conditions | Enables accurate maintenance planning | Enhances system availability |
 |
It applies GridBeats Substation Monitoring software to combine data streams from transformers and switchgear. The system uses edge computing to evaluate equipment data. It tracks physical asset stress to adjust dynamic facility ratings. | Reduces unplanned outages | Unlocks extra grid capacity | Defers capital expenditure | Lowers maintenance expenses |
 |
It uses single-gas hydrogen monitors for distribution fleets and multi-gas analyzers for primary power transformers. The diagnostic tools track fault gases, moisture, and oil temperature. It applies the Duval triangle method to identify thermal and electrical faults. | Provides early fault detection | Lowers fleet monitoring costs | Reduces downtime for primary assets | Supports targeted technical diagnostics |
 |
It employs the Calisto and EDS platforms to monitor dissolved gas, partial discharge, and bushing health. The system tracks transformers, circuit breakers, and gas-insulated switchgear in real time. It integrates diagnostic data to alert operators of insulation deterioration. | Prevents asset failures | Enables condition-based maintenance | Improves asset health visibility | Supports structural asset management |
Logos and trademarks shown above are the property of their respective owners. Their use here is for informational and illustrative purposes only.
MARKET ECOSYSTEM
The preventive diagnostics ecosystem for substation equipment comprises diagnostic device providers and software platforms that work together to enable early fault detection and condition-based maintenance. Diagnostic devices such as DGA monitors, partial-discharge sensors, thermal monitoring systems, bushing monitors, and vibration/acoustic sensors capture equipment-health data, while software platforms aggregate and analyze this information through condition monitoring, asset health analytics, predictive maintenance, and decision-support tools. Increasing integration between hardware and software is shifting utilities from periodic testing toward continuous, data-driven asset management.
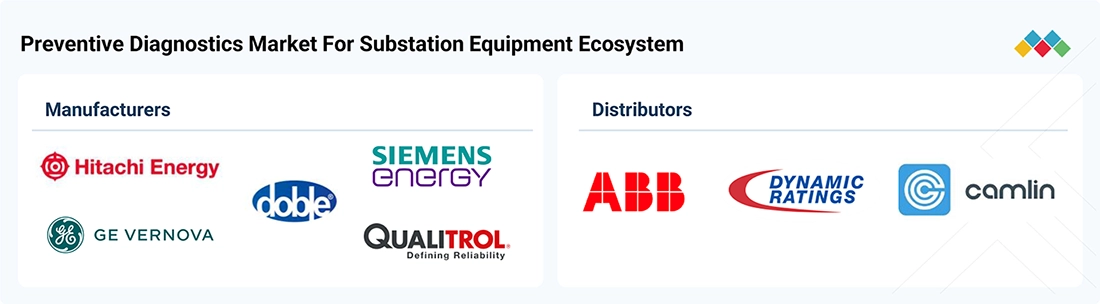
Logos and trademarks shown above are the property of their respective owners. Their use here is for informational and illustrative purposes only.
MARKET SEGMENTS
Source: Secondary Research, Interviews with Experts, MarketsandMarkets Analysis
Preventive Diagnostic Market for Substation Equipment, by Type
The diagnostic devices segment is expected to account for the largest share of the preventive diagnostics market for substation equipment. It is supported by the increasing deployment of smart sensors, intelligent electronic devices (IEDs), dissolved gas analyzers, and thermal monitoring cameras. Rising investments in grid modernization, condition-based maintenance, and connected utility infrastructure are accelerating the demand for diagnostic hardware across transmission networks. These solutions support real-time asset monitoring, early fault detection, predictive maintenance workflows, and automated substation operations, strengthening the segment's market position.
Preventive Diagnostic Market for Substation Equipment, by Diagnostic Devices
The dissolved gas analysis (DGA) and oil-gas monitoring devices segment is expected to account for the largest market share, supported by the increasing deployment of online multi-gas analyzers, single-gas hydrogen monitors, moisture-in-oil sensors, and automated oil sampling units. Rising investments in grid modernization, condition-based maintenance, and continuous transformer protection are accelerating demand for transformer diagnostic hardware. These solutions support real-time asset monitoring, early electrical fault detection, insulation degradation tracking, and automated substation maintenance workflows, strengthening the segment's market position.
Preventive Diagnostic Market for Substation Equipment, by Software
The asset performance management (APM) and health analytics software segment is expected to account for a significant share of the preventive diagnostics software market for substation equipment, supported by its widespread use for asset health scoring, predictive failure analysis, risk modeling, and centralized fleet management. Growing investments in digital substations, condition-based maintenance infrastructure, and utility-scale analytics platforms are further supporting APM software adoption across power transmission and distribution facilities.
Preventive Diagnostic Market for Substation Equipment, by Region
North America is expected to account for a significant share of the preventive diagnostics market for substation equipment due to its widespread use of automated condition monitoring systems, advanced dissolved gas analyzers, online partial discharge detectors, and digital substation workflows. Growing investments in grid modernization, aging utility infrastructure replacement, and reliable transmission and distribution networks are further supporting diagnostic technology adoption across regional power facilities.
REGION
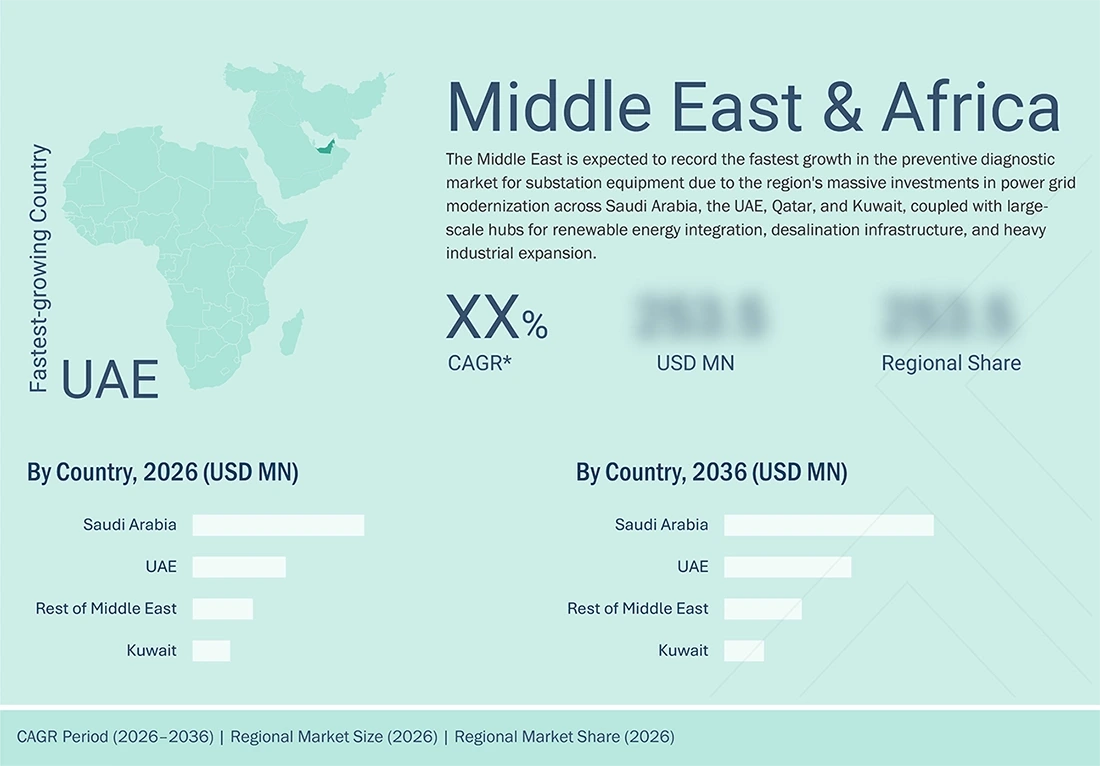
Middle East to be fastest-growing region in preventive diagnostics market for substation equipment during forecast period
The Middle East is expected to be the fastest-growing region in the preventive diagnostics market for substation equipment, driven by rapid power grid modernization, expanding transmission infrastructure, and increasing adoption of smart sensors, intelligent electronic devices (IEDs), and online monitoring systems across Saudi Arabia, the UAE, Qatar, Oman, and Kuwait. Rising investments in smart grid infrastructure, renewable energy integration, remote asset monitoring, and automated diagnostic solutions are accelerating regional adoption. Additionally, growing electricity demand, harsh operating environments, and the need to prevent costly grid failures are strengthening investments in predictive substation maintenance systems. Government initiatives for energy transition and digitalization, along with increasing adoption of advanced communication protocols and condition-based monitoring, are further supporting market expansion across the region.
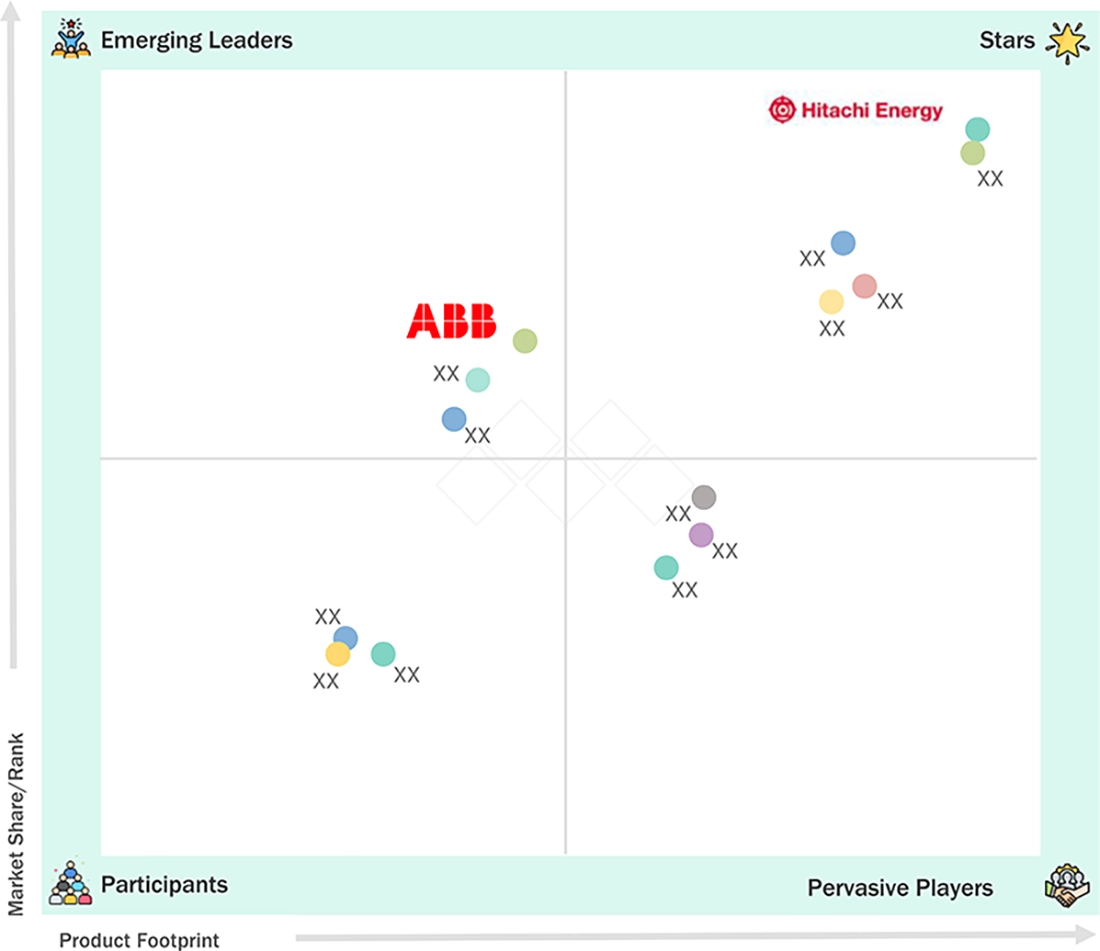
PREVENTIVE DIAGNOSTICS MARKET FOR SUBSTATION EQUIPMENT: COMPANY EVALUATION MATRIX
In the preventive diagnostics comapnies for substation equipment matrix, Hitachi Energy (Star) holds a leading position, supported by its broad portfolio of transformer and substation monitoring solutions, strong global presence, and capabilities across condition monitoring, asset performance management, and predictive analytics. Its focus on digital substations, continuous equipment monitoring, and data-driven asset management strengthens its position across utilities and grid operators. ABB (Emerging Leader) is strengthening its position through its expanding portfolio of substation automation, condition monitoring, digital asset management, and predictive maintenance solutions. Its integration of monitoring devices with analytics and digital platforms supports improved equipment reliability, maintenance planning, and lifecycle management across substation assets.
Source: Secondary Research, Interviews with Experts, MarketsandMarkets Analysis
KEY MARKET PLAYERS
- Siemens Energy (Germany)
- GE Vernova (US)
- ABB (Switzerland)
- Hitachi Energy Ltd (Switzerland)
- Schneider Electric (France)
- Qualitrol Company LLC (US)
- Doble Engineering Company (US)
- OMICRON (Austria)
- Rugged Monitoring (Canada)
- Dynamic Ratings (US)
WHAT IS IN IT FOR YOU: PREVENTIVE DIAGNOSTICS MARKET FOR SUBSTATION EQUIPMENT REPORT CONTENT GUIDE
DELIVERED CUSTOMIZATIONS
We have successfully delivered the following deep-dive customizations:
| CLIENT REQUEST | CUSTOMIZATION DELIVERED | VALUE ADDS |
|---|---|---|
| Substation Monitoring Technology Provider |
|
|
| Diagnostic Sensor and Equipment Supplier |
|
|
| Substation EPC Firm and Systems Integrator |
|
|
| Electric Power Utility and Grid Network Operator |
|
|
| Private Equity and Infrastructure Investment Firm |
|
|
RECENT DEVELOPMENTS
- March 2026 : Hitachi Energy introduced enhanced asset analytics capabilities within its digital energy portfolio to support critical power infrastructure. The software uses artificial intelligence and reliability centered maintenance modeling to evaluate equipment risks and optimize maintenance schedules for aging substation assets.
- February 2026 : GE Vernova expanded its GridBeats software portfolio with dedicated substation monitoring and asset performance management modules. The platform connects edge data from power transformers and switchgear to enable predictive fault diagnostics and improve equipment reliability across utility networks.
- January 2026 : Siemens Energy expanded its condition monitoring applications for high-voltage circuit breakers and power transformers. The solution processes real-time sensor data to track contact wear and insulation health, enabling utilities to transition from scheduled maintenance to condition-based intervention.
Table of Contents
 Exclusive indicates content/data unique to MarketsandMarkets and not available with any competitors.
Methodology
The study involved four major activities in estimating the current size of the preventive diagnostics market for substation equipment. Extensive secondary research was conducted to gather information on the market, adjacent power equipment markets, and the broader digital substation and grid automation ecosystem. This was followed by primary research with industry stakeholders across the value chain, including diagnostic device manufacturers, power transformer and switchgear OEMs, substation software providers, electrical engineering consultants, EPC contractors, and electric utility operators, to validate assumptions and market sizing. Both top-down and bottom-up approaches were used to estimate the overall market size. Market breakdowns and data triangulation techniques were then applied to derive the size of individual segments and subsegments, including type, diagnostic devices, software, application, and regional markets. Secondary and primary sources were jointly used to support a comprehensive technical and commercial analysis of the preventive diagnostics market for substation equipment, covering technologies such as online dissolved gas analysis (DGA), partial discharge monitoring, asset performance management (APM), digital twins, predictive analytics, and cybersecurity.
Secondary Research
Various secondary sources were referred to during the secondary research process to identify and collect information relevant to the preventive diagnostics market for substation equipment. These sources included company annual reports, investor presentations, official websites, press releases, product datasheets, technical white papers, and engineering journals. Research also covered power sector publications, government energy databases, and technical standards from organizations such as IEEE, IEC, and CIGRE. Secondary research was conducted to obtain insights into the value chain, competitive landscape, technology ecosystem, and market segmentation across types, diagnostic devices, software platforms, and regions. It also helped analyze trends in grid digitalization, asset performance management, online dissolved gas analysis, partial discharge detection, and digital substation modernization. The collected data was used to estimate overall market size and identify industry trends, which were subsequently validated through primary research with diagnostic device manufacturers, power utilities, system integrators, and electrical engineering experts.
Primary Research
Extensive primary research was conducted after gaining knowledge about the current scenario of the preventive diagnostics market for substation equipment through secondary research. Several primary interviews were conducted with experts from the demand and supply sides across four major regions: North America, Europe, and the Middle East. This primary data was collected through questionnaires, emails, and telephonic interviews.
Breakdown of Primary Interviews

Note: The three tiers of the companies are defined based on their total revenue in 2025: Tier 1 - revenue greater than or equal to USD 1 billion; Tier 2 - revenue between USD 100 million and USD 1 billion; and Tier 3 revenue less than or equal to USD 100 million. Other designations include sales managers, marketing managers, and product managers.
To know about the assumptions considered for the study, download the pdf brochure
Market Size Estimation
Both top-down and bottom-up approaches were used to estimate and validate the total size of the preventive diagnostics market for substation equipment. These methods have also been used extensively to estimate the size of various subsegments in the market. The following research methodology was used to estimate the market size:
- Approach to arrive at market size using bottom-up analysis (demand side)
- Companies offering substation diagnostic solutions were identified, and their offerings were mapped based on type and region footprint.
- The global market size was derived through the data sanity method, where revenues of key diagnostic providers were analyzed through annual reports, investor presentations, company websites, and press releases to estimate the overall market size.
- For each company, a percentage was assigned to the overall revenue to derive revenues attributable to substation preventive diagnostic offerings.
- Each company's percentage contribution was assigned after analyzing factors including its technology portfolio, geographic presence, utility customer base, R&D investments, strategic initiatives, and recent developments in the substation monitoring market.
- For the CAGR, market trend analysis was carried out by assessing technology adoption, power grid digitalization, transmission infrastructure investments, and demand for online DGA, smart sensors, cloud analytics, and connected substation solutions.
- Estimates at every level were verified and cross-checked through discussions with key opinion leaders, including utility executives, substation asset managers, electrical testing specialists, and market domain experts.
- Various paid and unpaid information sources, such as annual reports, company websites, press releases, technical white papers, energy publications, and industry databases, were studied.
The top-down approach was used to estimate and validate the total size of the preventive diagnostics market for substation equipment.
- Focusing initially on electric utility grid modernization investments and substation digitalization expenditure, further splitting the market into type, diagnostic device, software, and region while identifying key developments across major markets
- Identifying all major players in the preventive diagnostics market for substation equipment and their technology portfolios across power utilities through secondary research, as well as verifying findings through discussions with industry experts
- Analyzing revenues, product mix, geographic presence, and key grid applications served by identified players to estimate and arrive at percentage splits for all key segments
- Discussing these splits with industry experts to validate the information and identify key growth pockets across all major segments
- Breaking down the total market based on verified percentage splits and key growth pockets across all segments and subsegments
- Breaking down the total market based on verified splits and key growth pockets across all segments
Preventive Diagnostics Market for Substation Equipment : Top-Down and Bottom-Up Approach

Data Triangulation
After arriving at the overall size of the preventive diagnostic market for substation equipment through the market size estimation process, the total market was divided into key segments and subsegments. Data triangulation and market breakdown procedures were applied, wherever applicable, to complete the market engineering process and derive statistics for all segments and subsegments. The data was triangulated by analyzing various factors and trends from both the demand and supply sides. Market estimates were validated using information from diagnostic device manufacturers, power utilities, electrical engineering consultants, substation software providers, system integrators, and other industry stakeholders. In addition, the market size was validated using both top-down and bottom-up approaches. The triangulation process also considered technology adoption, power grid digitalization, utility modernization investments, online monitoring devices, predictive maintenance software deployment, and regional transmission and distribution infrastructure development.
Market Definition
A preventive diagnostic market for substation equipment is an integrated utility infrastructure solution that combines connected digital technologies, intelligent field devices, and data-driven analytical platforms to improve asset reliability, operational efficiency, resource allocation, and power grid management. It incorporates technologies such as artificial intelligence and machine learning, industrial Internet of Things (IoT), cloud and edge computing, predictive analytics, digital twins, advanced substation networking protocols, and operational cybersecurity. These systems enable online condition monitoring, automated diagnostic workflows, predictive asset maintenance, real-time telemetry exchange, remote fleet oversight, and data-driven risk management. They integrate diagnostic hardware, software platforms, communication infrastructure, and field services across high-voltage and medium-voltage environments, covering power transformers, switchgear, circuit breakers, instrument transformers, asset health index modeling, maintenance crew management, and substation facility operations.
Key Stakeholders
- Transmission and distribution utilities
- Industrial end users
- Data centers and critical infrastructure
- Renewable energy developers
- Original equipment manufacturers
- Specialized diagnostic manufacturers
- Software and analytics providers
- Engineering, procurement, and construction firms
- Testing and diagnostic service providers
- Standards and regulatory bodies
Report Objectives
- To define, describe, and forecast the preventive diagnostic market for substation equipment by type, diagnostic device, software, and region, in terms of value
- To forecast the market size by region for North America, Europe, and the Middle East, in terms of value
- To estimate the market size in terms of value for services, including consulting & advisory services, deployment & system integration services, managed & support/maintenance services, and training & education services
- To strategically profile key players and comprehensively analyze their core competencies


Personalize This Research
- Triangulate with your Own Data
- Get Data as per your Format and Definition
- Gain a Deeper Dive on a Specific Application, Geography, Customer or Competitor
- Any level of Personalization
Let Us Help You
- What are the Known and Unknown Adjacencies Impacting the Preventive Diagnostics Market
- What will your New Revenue Sources be?
- Who will be your Top Customer; what will make them switch?
- Defend your Market Share or Win Competitors
- Get a Scorecard for Target Partners

Custom Market Research Services
We Will Customise The Research For You, In Case The Report Listed Above Does Not Meet With Your Requirements
Get 10% Free CustomisationTESTIMONIALS

Tetsuya Ohhira
Business Development Manager-Technology Business
Nikon Corporation,
Leading Japanese MNC specializing in optics and imaging productswww.nikon.com
MarketsandMarkets™ response
is quick. Their attitude is flexible and positive. Analyst Insights are globally considered and
significant. Client Services quickly respond to our inquiry and demand. Their wide range of global
surveys help us make our strategic plan.
We hope Knowledge Store will be easier to search
for a report.
VP - Marketing & Business Development
Leading Provider of Process Control Solutions
We engaged with MarketsandMarkets on a study to perform an analysis and recommend a Go-To-Market strategy for metrology and process control in the semiconductor market. The study was tailored to our targets and needs with well-defined milestones. Our overall experience with the MarketsandMarkets team was very good throughout the project in all aspects including the analysis methodologies used, the quality and depth of primary and secondary data sets, the professionalism and flexibility of the team and the ability to meet the target schedule and milestones. We want to thank MarketsandMarkets team for a job well done.



Growth opportunities and latent adjacency in Preventive Diagnostics Market