
Quantum Computing in Healthcare Market: Growth, Size, Share, and Trends

Quantum Computing in Healthcare Market by Component (Hardware, Software), Deployment (On-premises, Cloud-based), Technology (Superconducting Qubits, Trapped Ions), Application (Drug Discovery, Genomics), End User, and Region - Global Forecast to 2030


OVERVIEW
Source: Secondary Research, Interviews with Experts, MarketsandMarkets Analysis
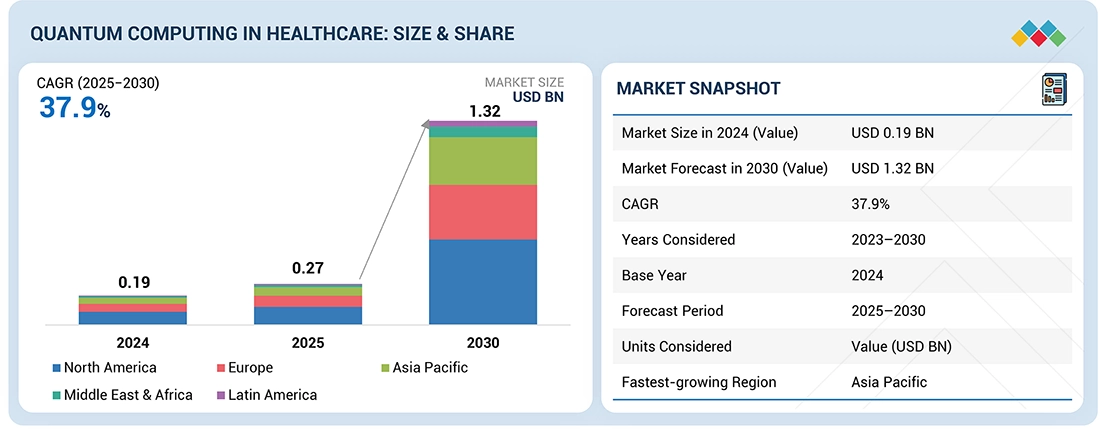
The global quantum computing in healthcare market is projected to reach USD 1.32 billion by 2030 from USD 0.19 billion in 2024, at a high CAGR of 37.9% during the forecast period. The quantum computing in healthcare market is gaining momentum, fueled by the need for faster and more advanced data analysis in areas such as drug discovery, genomics, and precision medicine.
KEY TAKEAWAYS
- North America held the largest share of 44.7% of the global market in 2024.
- Hardware segment accounted for largest share of 40.2% in 2024
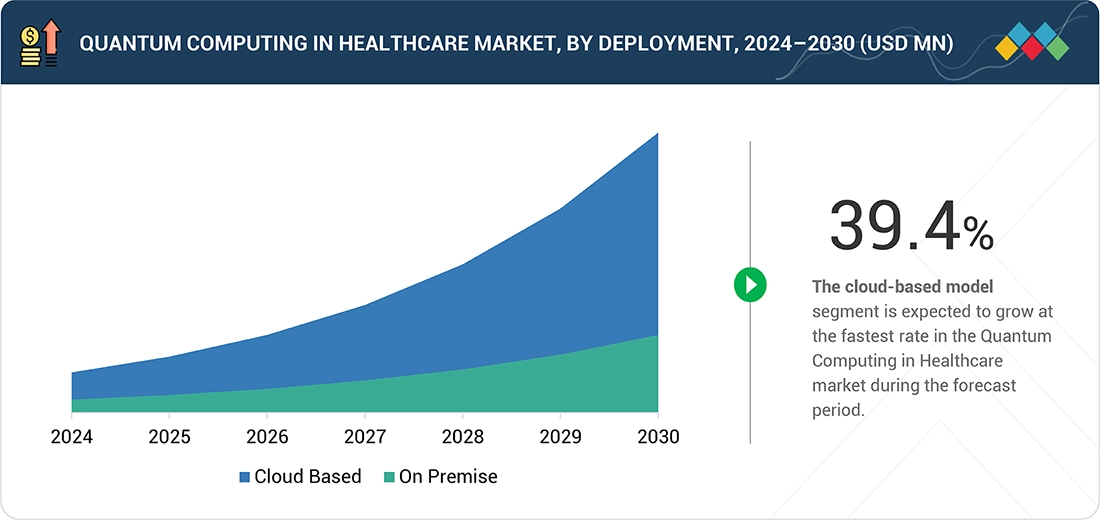
- Cloud based solutions expected grow at the fastest CAGR of 39.4%.
- Superconducting qubits segment accounted for largest share in 2024
- Based on application, the drug discovery & development segment is expected to dominate the market
- Based on end users, healthcare payers segment is expected grow at the fastest CAGR of.
- Rigetti & Co, LLC., IBM, D-Wave Quantum Inc., were identified as some of the star players in the Quantum Computing in Healthcare market (global), given their strong market share and product footprint.
- SandboxAQ, Pasqal, Qubit Pharmaceuticals among others, have distinguished themselves among startups and SMEs by securing strong footholds in specialized niche areas, underscoring their potential as emerging market leaders.
The quantum computing in healthcare market is advancing steadily, driven by the growing investments from both developed and emerging markets are playing a pivotal role in advancing its application in healthcare. Governments, academic institutions, and private enterprises are increasingly allocating funds toward quantum technologies, recognizing their potential to revolutionize fields like drug development, medical imaging, genomics, and precision healthcare.
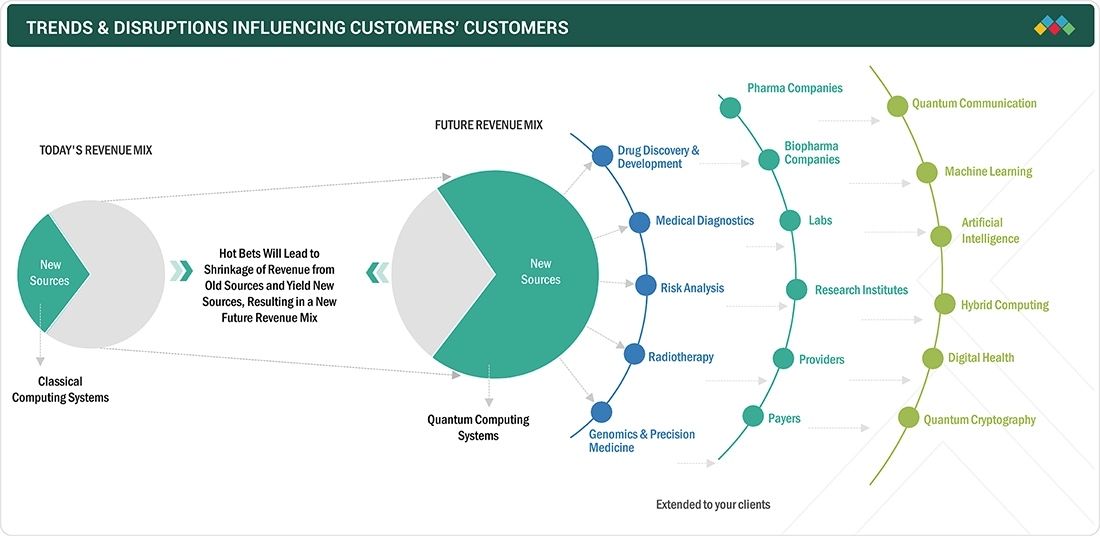
TRENDS & DISRUPTIONS IMPACTING CUSTOMERS' CUSTOMERS
The impact on consumers' business emerges from customer trends or disruptions. Hotbets are clients of quantum computing technology providers, and target applications are the clients of those quantum computing technology providers. Shifts, which are changing trends or disruptions, will impact the revenues of end users. The revenue impact on end users will affect the revenue of hotbets, which will further affect the revenues of quantum computing technology providers.
Source: Secondary Research, Interviews with Experts, MarketsandMarkets Analysis
MARKET DYNAMICS
Level
-
Increasing Investments in quantum computing in developed as well as emerging economies

-
Growing inclination of payers toward quantum computing

Level
-
Accuracy issues with quantum computing systems and high implementation costs

Level
-
Technological advancements in quantum computing supporting various healthcare applications

-
Potential applications in medical image analysis and oncology

Level
-
Lack of technical expertise and data management issues

Source: Secondary Research, Interviews with Experts, MarketsandMarkets Analysis
Driver: Increasing Investments in quantum computing in developed as well as emerging economies
Both developed and emerging economies are significantly increasing their investments in quantum computing to advance research and innovation in the healthcare sector. The US continues to lead the way, with its federal Quantum Information Science (QIS) research and development budget reaching approximately USD 900 million in fiscal year 2022—double the amount allocated in fiscal year 2019. This underscores the nation's strong commitment to quantum-enabled biomedical advancements. In fiscal year 2023, the National Institute of Standards and Technology (NIST) requested an additional USD 15 million to support quantum information science initiatives, focusing on the development of quantum enabling technologies and the expansion of research partnerships. Looking ahead, the proposed FY 2025 budget includes a USD 13.9 million increase for NIST to enhance quantum technology research, aiming to support the nascent US quantum industry by developing metrology for large-scale quantum systems and preparing a quantum-ready workforce. In March 2023, the Cleveland Clinic announced a collaboration with IBM to establish the world’s first quantum computer dedicated to healthcare research.
Restraint: Accuracy issues with quantum computing systems and high implementation costs
Quantum computing systems have not yet achieved optimal efficiency or 100% accuracy. Companies in drug discovery and genomics face challenges when using quantum computing due to issues related to operational efficiency stemming from the technology's complexity, which, in turn, affects accuracy. Additionally, quantum computing systems require significant time to cool down after reaching a specific temperature, which hampers their efficiency and leads to a loss of productivity. Quantum computers are expensive, and the implementation process is time-consuming. The high costs are primarily due to the technology still being in its early stages and inherently niche. As quantum computing technology matures, prices are expected to decrease in the future. Consequently, there is currently a reluctance to adopt this technology, especially in emerging countries like India, where traditional computing systems are preferred. These factors are anticipated to impact market growth.
Opportunity: Technological advancements in quantum computing supporting various healthcare applications
Key industry players have been making significant investments in the development of advanced quantum computing systems, aimed at helping end users achieve maximum efficiency. In 2023, the focus in the quantum computing field is not expected to be on hardware investments. Instead, attention will likely shift toward creating systems with a greater number of qubits that gain international acceptance. In March 2025, Quantinuum achieved a significant milestone by executing a fully fault-tolerant algorithm using three logically encoded qubits on its H1 quantum computer. This breakthrough represents a major step toward practical, error-resilient quantum computing, which is essential for reliable and scalable applications in healthcare, including accurate molecular simulations, drug discovery, and personalized treatment modeling.
Challenge: Lack of technical expertise and data management issues
Quantum computing is an advanced and complex technology that requires specialized expertise for effective operation. Despite the large populations in emerging economies, there is a significant shortage of skilled professionals in quantum computing. This shortage presents major challenges for the adoption and management of these advanced systems. The talent gap is especially pronounced in the healthcare sector, where the transition to new technologies like quantum computing is complicated by the presence of extensive, unstructured, and diverse data repositories. Moreover, quantum computing hardware is typically large and requires sophisticated infrastructure, making management and maintenance, as well as ensuring data integrity, particularly challenging. These factors create considerable obstacles to the widespread implementation of quantum computing in healthcare markets, including oncology.
Quantum Computing in Healthcare Market: COMMERCIAL USE CASES ACROSS INDUSTRIES
| COMPANY | USE CASE DESCRIPTION | BENEFITS |
|---|---|---|
 |
The company develops algorithms for quantum computing that focus on application areas such as drug design, drug discovery | Accelerated drug development, more precise molecule modeling, reduced R&D time |
 |
Quantum machine learning for diagnostic imaging and genomics analysis | Improved accuracy in disease detection, personalized medicine advancements |
 |
Wave quantum hybrid technology enables faster and more efficient computer-aided drug design | Uses quantum-hybrid AI to enhance large language models for drug discovery |
 |
Quandela’s provides access to photonic quantum computing, enables developing, and deploying algorithms | Accelerating the discovery of new drugs, potentially leading to more effective treatments |
 |
Leveraging quantum hardware to address challenges in drug discovery | Facilitates the discovery of new pharmaceutical compounds, potentially reducing the time and cost |
Logos and trademarks shown above are the property of their respective owners. Their use here is for informational and illustrative purposes only.
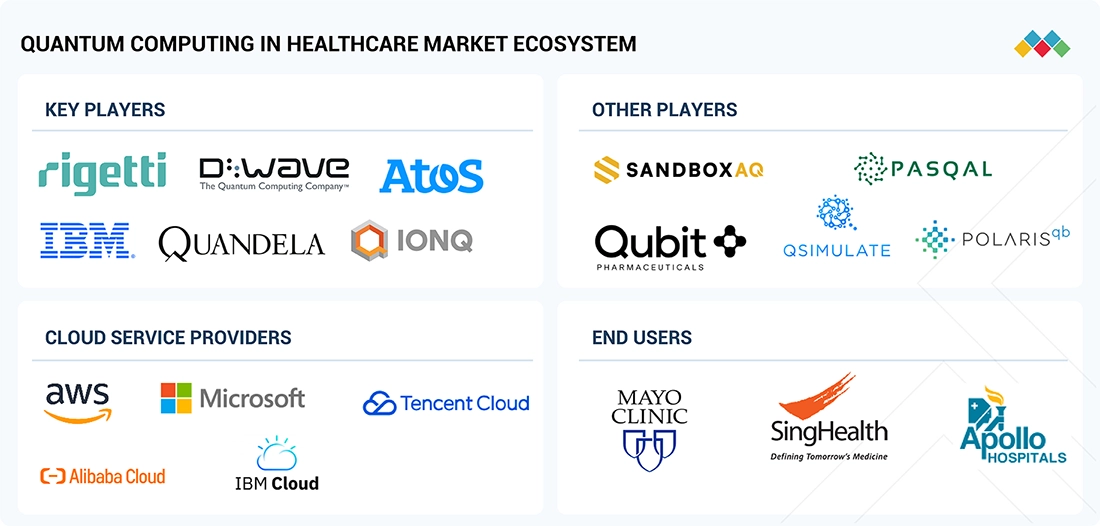
MARKET ECOSYSTEM
The quantum computing in healthcare market ecosystem consists of hardware providers developing quantum processors, specialized software companies creating healthcare algorithms, cloud service providers offering quantum-as-a-service platforms, and end users, including hospitals, pharmaceutical companies, and research institutions leveraging quantum solutions for drug discovery, diagnostics, and personalized medicine applications.
Logos and trademarks shown above are the property of their respective owners. Their use here is for informational and illustrative purposes only.
MARKET SEGMENTS
Source: Secondary Research, Interviews with Experts, MarketsandMarkets Analysis
Quantum Computing in Healthcare, By Component
In 2024, the hardware segment held the largest market share of the quantum computing in healthcare market, driven by substantial investments in quantum processor development and infrastructure deployment. The dominance stems from high capital requirements for superconducting qubits, trapped-ion systems, and cryogenic equipment necessary for quantum operations. Major providers like IBM, Google, and Rigetti are expanding qubit counts and improving error correction capabilities, with healthcare institutions and pharmaceutical companies investing heavily in quantum hardware to establish computational advantages in drug discovery and molecular simulation applications.
Quantum Computing in Healthcare, By Deployment
In 2024, the cloud-based deployment segment held the largest market share of the quantum computing in healthcare market, driven by its accessibility, scalability, and cost-effectiveness. Cloud deployment enables researchers to access quantum processors remotely for drug discovery simulations, genomics analysis, and clinical trial optimization without maintaining expensive on-premise quantum hardware, accelerating adoption across hospitals, biotechnology firms, and academic institutions with varying computational requirements and technical expertise levels.
Quantum Computing in Healthcare, By Application
In 2024, the superconducting qubits technology segment held the largest market share of the quantum computing in healthcare market, driven by its maturity, scalability, and proven performance in complex healthcare applications. Superconducting systems, developed by leaders like IBM, Google, and Rigetti, offer faster gate operations and greater qubit connectivity essential for molecular simulations and drug discovery algorithms. The technology's compatibility with existing semiconductor manufacturing processes enables mass production potential, while demonstrated breakthroughs in quantum error correction and coherence times make superconducting qubits the preferred choice for pharmaceutical companies conducting protein folding research, genomics sequencing optimization, and precision medicine development initiatives.
Quantum Computing in Healthcare, By Technology
In 2024, the drug discovery and development application segment held the largest market share of the quantum computing in healthcare market, driven by the technology's ability to dramatically accelerate molecular modeling and simulation processes. Quantum computers excel at analyzing complex molecular interactions, predicting drug-target binding affinities, and optimizing chemical compounds with unprecedented accuracy compared to classical computing methods. Pharmaceutical giants are leveraging quantum algorithms to reduce drug development timelines from years to months, significantly lowering R&D costs. The segment's dominance reflects urgent industry needs for faster therapeutic solutions, particularly for rare diseases and personalized cancer treatments, with quantum simulations enabling breakthrough discoveries in protein folding and metabolic pathway analysis.
Quantum Computing in Healthcare, By End User
In 2024, the pharmaceutical and biotechnology companies segment held the largest market share of the quantum computing in healthcare market, driven by their substantial R&D budgets and urgent need for computational advantages in drug development. These companies are early adopters leveraging quantum algorithms for molecular simulations, clinical trial optimization, and personalized medicine research to gain competitive advantages and accelerate time-to-market for new therapeutics. Major pharmaceutical firms including Roche, Pfizer, and Biogen are forming strategic partnerships with quantum providers, investing heavily in quantum infrastructure and talent acquisition.
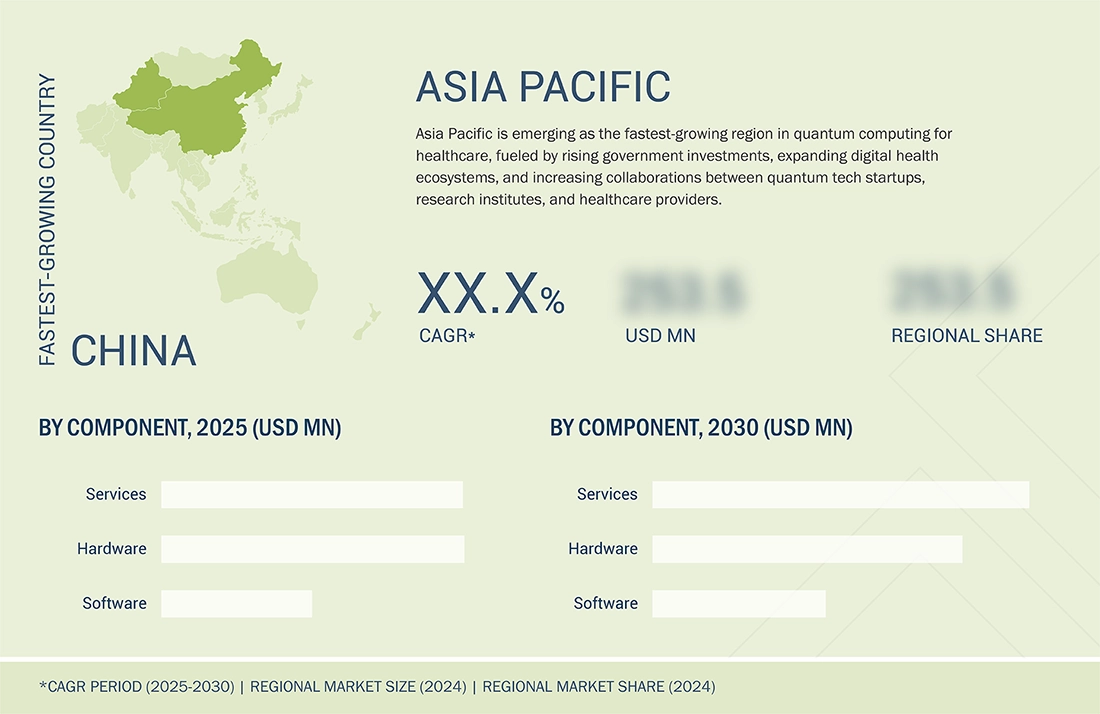
REGION
Asia Pacific to be fastest-growing region in global quantum computing in healthcare market during forecast period
Asia Pacific emerges as the fastest-growing region in the quantum computing healthcare market, driven by substantial government investments in quantum research, particularly from China, Japan, and South Korea. The region's large patient population, rapidly expanding healthcare infrastructure, and strong pharmaceutical manufacturing base create significant demand. Leading technology hubs in Singapore, India, and Australia are establishing quantum research centers, while collaborative initiatives between tech giants and healthcare providers accelerate the adoption of quantum solutions for drug discovery and precision medicine applications.
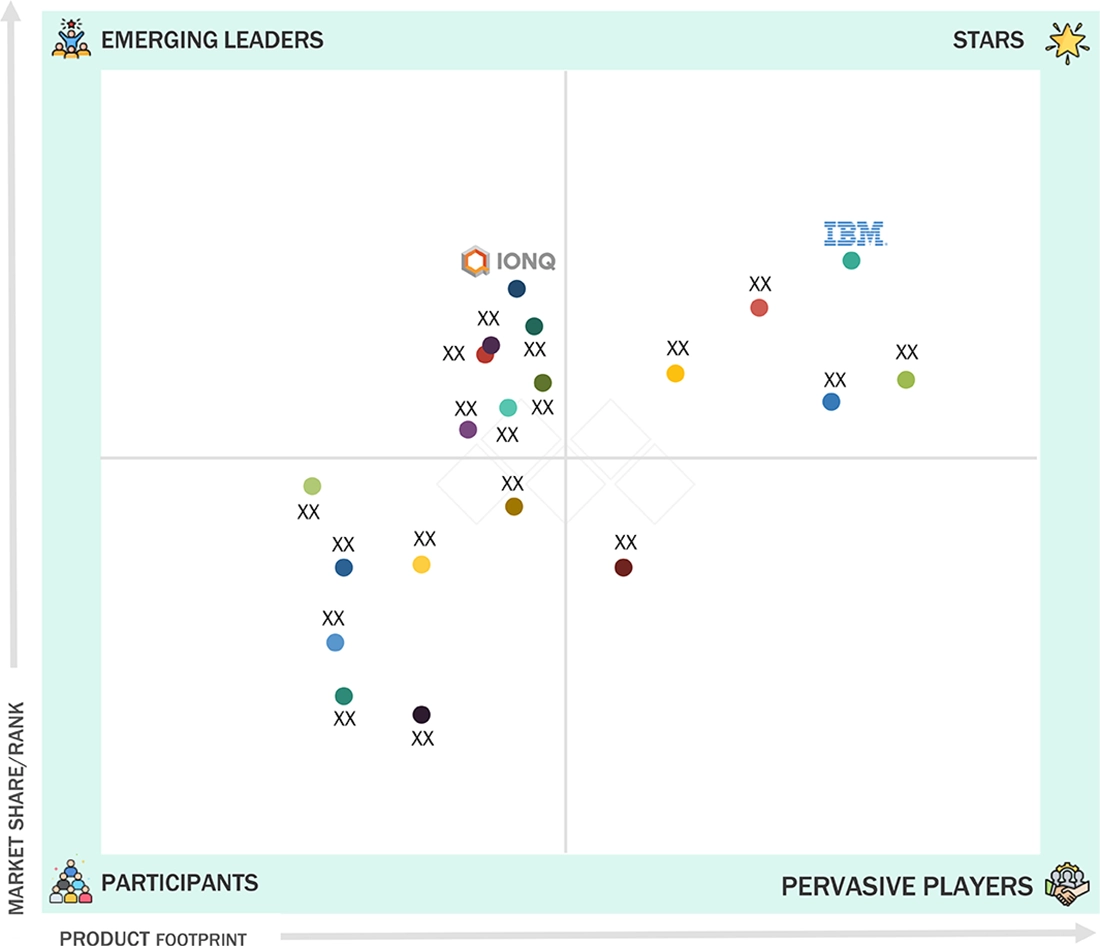
Quantum Computing in Healthcare Market: COMPANY EVALUATION MATRIX
In the quantum computing in healthcare market matrix, IBM (Star) leads with a strong market presence and an extensive quantum healthcare portfolio, driven by its comprehensive suite of offerings and IBM Quantum Network partnerships with major pharmaceutical companies and research institutions that enable advanced drug discovery and molecular modeling. IonQ (Emerging Leader) is gaining traction. The company offers a broad spectrum of trapped-ion quantum computing solutions, including cloud-accessible quantum systems for genomics analysis, precision medicine applications, and quantum machine learning algorithms for medical imaging diagnostics.
Source: Secondary Research, Interviews with Experts, MarketsandMarkets Analysis
KEY MARKET PLAYERS
MARKET SCOPE
| REPORT METRIC | DETAILS |
|---|---|
| Market Size in 2024 (Value) | USD 0.19 BN |
| Market Forecast in 2030 (value) | USD 1.32 BN |
| Growth Rate | CAGR of 37.9% from 2025-2030 |
| Years Considered | 2023-2030 |
| Base Year | 2024 |
| Forecast Period | 2025-2030 |
| Units Considered | Value (USD Billion) |
| Report Coverage | Revenue forecast, company ranking, competitive landscape, growth factors, and trends. |
| Segments Covered |
|
| Regions Covered | North America, Asia Pacific, Europe, Latin America, Middle East & Africa |
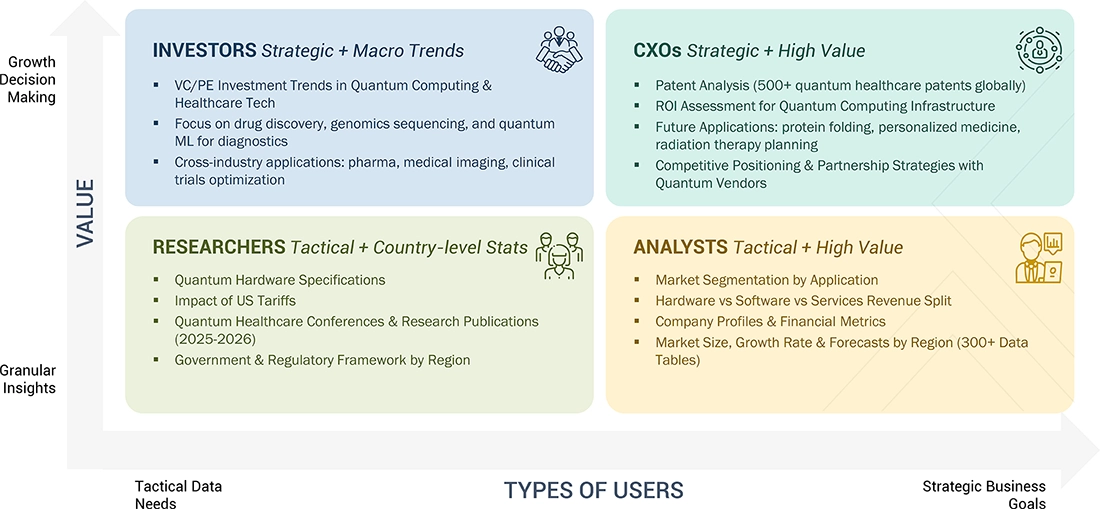
WHAT IS IN IT FOR YOU: Quantum Computing in Healthcare Market REPORT CONTENT GUIDE
DELIVERED CUSTOMIZATIONS
We have successfully delivered the following deep-dive customizations:
| CLIENT REQUEST | CUSTOMIZATION DELIVERED | VALUE ADDS |
|---|---|---|
| Local Competitive Landscape | Profiles of key quantum computing providers (e.g., IBM, Google, Rigetti, IonQ, D-Wave), covering regional market share, segmental revenue, recent quantum algorithm developments, and innovations in drug discovery optimization, molecular simulation, and quantum machine learning for diagnostics. | Enables competitive benchmarking, identification of technological advantages and algorithm gaps, and strategic planning for quantum infrastructure investments and QaaS partnerships. |
| Regional Market Entry Strategy | Detailed analysis of region-specific market entry barriers such as quantum talent availability, research infrastructure requirements, healthcare data regulations, adoption readiness, and key partnership opportunities including collaborations with pharmaceutical companies, academic institutions, and cloud providers. | Reduces entry risk for new quantum solution providers, accelerates regional adoption of quantum healthcare applications, and supports localization strategies for quantum algorithms. |
| Local Risk & Opportunity Assessment | Identification of evolving quantum regulations, healthcare data sovereignty challenges, technology maturity limitations, and untapped opportunities in precision medicine, genomics sequencing, clinical trial optimization, and AI-quantum hybrid solutions for rare disease research. | Supports proactive risk mitigation, strategic investments in quantum-ready infrastructure, and adaptation to evolving healthcare compliance and quantum computing standards. |
| Technology Adoption by Region | Insights on regional adoption patterns for quantum computing platforms, integration with existing healthcare IT systems, focus on drivers such as government quantum initiatives, pharmaceutical R&D funding, cloud-based quantum access, and healthcare digitalization maturity levels. | Guides R&D focus, quantum solution positioning, and investment decisions for targeted deployment of quantum healthcare applications and regional innovation ecosystems. |
RECENT DEVELOPMENTS
- June 2025 : IonQ, AstraZeneca, Amazon Web Services (AWS), and NVIDIA collaborated to develop and demonstrate a quantum-accelerated computational chemistry workflow which has the potential to power world-changing innovation in healthcare, life sciences, chemistry, and more.
- June 2025 : IonQ acquired Oxford Ionics in a transaction valued at USD 1.075 Billion, which will consist of USD 1.065 Billion in shares of IonQ common stock and approximately USD 10 Million in cash
- June 2024 : IBM, Cleveland Clinic and Hartree Centre collaborated to advance healthcare and biomedical science through advanced computing technologies.
Table of Contents
 Exclusive indicates content/data unique to MarketsandMarkets and not available with any competitors.
Methodology
The study involved several key activities in estimating the current size of the quantum computing in healthcare market. Extensive secondary research was conducted to gather information on this market. The next step was to validate the findings, assumptions, and size estimates by consulting industry experts throughout the value chain through primary research. We employed various methods, including top-down and bottom-up approaches, to estimate the overall market size. Following this, we utilized market segmentation and data triangulation techniques to determine the size of specific segments and subsegments within the quantum computing in healthcare market.
Secondary Research
This research study involved the wide use of secondary sources, directories, and databases such as Dun & Bradstreet, Bloomberg Business, and Factiva; white papers, annual reports, and companies’ house documents; investor presentations; and the SEC filings of companies. The market for companies providing quantum computing in healthcare solutions is assessed using secondary data from both paid and free sources. This involves analyzing the product portfolios of major players in the industry and evaluating these companies based on their performance and quality. Various resources were utilized in the secondary research process to gather information for this study. The sources include annual reports, press releases, investor presentations, white papers, academic journals, certified publications, articles by recognized authors, directories, and databases.
Secondary research was used to identify and collect information useful for the extensive, technical, market-oriented, and commercial study of the quantum computing in healthcare market. It was also used to obtain important information about the key players and market classification and segmentation according to industry trends to the bottom-most level, and key developments related to market and technology perspectives. A database of the key industry leaders was also prepared using secondary research.
Primary Research
In the primary research process, various primary sources from both the supply and demand sides were interviewed to obtain qualitative and quantitative information for this report. Primary sources are mainly industry experts from the core and related industries and preferred suppliers, manufacturers, distributors, technology developers, researchers, and organizations related to all segments of this industry’s value chain. In-depth interviews were conducted with various primary respondents, including key industry participants, subject-matter experts (SMEs), C-level executives of key market players, and industry consultants, among other experts, to obtain and verify the critical qualitative and quantitative information as well as assess prospects.
Primary research was conducted to identify segmentation types; industry trends; key players; and key market dynamics such as drivers, restraints, opportunities, challenges, industry trends, and strategies adopted by key players.
After completing the market engineering process, which includes calculations for market statistics, market breakdown, size estimations, forecasting, and data triangulation, extensive primary research was conducted. This research aimed to gather information and verify the critical numbers obtained during the market analysis. Additionally, primary research was conducted to identify different types of market segmentation, analyze industry trends, evaluate the competitive landscape of quantum computing in healthcare solutions offered by various players, and understand key market dynamics such as drivers, restraints, opportunities, challenges, industry trends, and strategies employed by key market participants.
In the complete market engineering process, the top-down and bottom-up approaches and several data triangulation methods were extensively used to perform the market estimation and market forecasting for the overall market segments and subsegments listed in this report. Extensive qualitative and quantitative analysis was performed on the complete market engineering process to list the key information/insights throughout the report.
A breakdown of the primary respondents:

Note 1: Others include sales, marketing, and product managers.
Note 2: Tiers are defined based on a company’s total revenue. As of 2024: Tier 1 = >USD 1 billion, Tier 2 = USD 500 million to USD 1 billion, and Tier 3 = < USD 500 million.
To know about the assumptions considered for the study, download the pdf brochure
Market Size Estimation
The market size estimates and forecasts provided in this study are derived through a mix of the bottom-up approach (revenue share analysis of leading players) and top-down approach (assessment of utilization/adoption/penetration trends, by component, application, deployment, technology, end user, and region).

Data Triangulation
After arriving at the overall market size using the market size estimation processes, the market was split into several segments and subsegments. Data triangulation and market breakdown procedures were employed to complete the overall market engineering process and arrive at the exact statistics of each market segment and subsegment. The data was triangulated by studying various factors and trends from both the demand and supply sides in the quantum computing in healthcare market.
Market Definition
The quantum computing in healthcare market refers to the application of quantum technologies to enhance medical research and healthcare delivery. It includes the use of quantum hardware, software, and services to accelerate tasks such as drug discovery, genetic analysis, disease modeling, and personalized treatment by processing complex data more efficiently than classical systems.
Stakeholders
- Healthcare providers
- Healthcare vendors
- Quantum computing service providers
- Healthcare payers
- Academic research institutes
- Pharmaceutical and biotechnology companies
- Diagnostic labs
- Imaging labs
- Government institutions
- Market research and consulting firms
- Venture capitalists and investors
Report Objectives
- To define, describe, and forecast the global quantum computing in healthcare market based on component, application, deployment, technology, end user, and region
- To provide detailed information regarding the factors influencing the growth of the market (such as the drivers, restraints, opportunities, and challenges)
- To strategically analyze micromarkets with respect to individual growth trends, prospects, and contributions to the overall quantum computing in healthcare market
- To analyze market opportunities for stakeholders and provide details of the competitive landscape for market leaders
- To forecast the size of the quantum computing in healthcare market in five main regions (along with their respective key countries): North America, Europe, the Asia Pacific, Latin America, and the Middle East & Africa
- To profile key players and comprehensively analyze their product portfolios, market positions, and core competencies in the market
- To track and analyze competitive developments such as product & service launches; expansions; partnerships, agreements, and collaborations; and acquisitions in the quantum computing in healthcare market
- To benchmark players within the quantum computing in healthcare market using the Company Evaluation Matrix framework, which analyzes market players on various parameters within the broad categories of business strategy, market share, and product offering
Frequently Asked Questions (FAQ)
Which are the top industry players in the global quantum computing in healthcare market?
Rigetti & Co, LLC (US), IBM (US), D-Wave Quantum Inc. (Canada), Microsoft (US), IonQ (US), Quantinuum, Ltd. (US & UK), Google, Inc. (US), Atos SE (France), QC Ware (California), Classiq Technologies, Inc. (US), Xanadu Quantum Technologies Inc. (Canada), Hefei Origin Quantum Computing Technology Co., Ltd. (China), Protiviti, Inc. (US), Quandela (France), Deloitte (UK), Accenture (Ireland), Amazon Web Services (AWS) (US), Fujitsu (Japan), Qnami (Switzerland), SEEQC (US), SandboxAQ (US), Pasqal (France), Qubit Pharmaceuticals (France), Polaris Quantum Biotech (US), and QSimulate (US).
Which products & services have been included in the quantum computing in healthcare market report?
This report contains the following products & services:
- Software
- Hardware
- Services
Which geographical region is dominating the global quantum computing in healthcare market?
North America holds the largest market share. Asia Pacific is expected to register the highest growth rate during the forecast period.
Which end-user segments have been included in the quantum computing in healthcare market report?
The report contains the following end-user segments:
- Pharmaceutical & biotechnology companies
- Labs & research institutes
- Healthcare providers
- Healthcare payers
What is the total CAGR expected to be recorded for the quantum computing in healthcare market during 2025–2030?
The market is expected to record a CAGR of 37.9% from 2025–2030.
Need a Tailored Report?
Customize this report to your needs
Get 10% FREE Customization
Customize This ReportPersonalize This Research
- Triangulate with your Own Data
- Get Data as per your Format and Definition
- Gain a Deeper Dive on a Specific Application, Geography, Customer or Competitor
- Any level of Personalization
Let Us Help You
- What are the Known and Unknown Adjacencies Impacting the Quantum Computing in Healthcare Market
- What will your New Revenue Sources be?
- Who will be your Top Customer; what will make them switch?
- Defend your Market Share or Win Competitors
- Get a Scorecard for Target Partners

Custom Market Research Services
We Will Customise The Research For You, In Case The Report Listed Above Does Not Meet With Your Requirements
Get 10% Free CustomisationTESTIMONIALS

JAYANT RAJPUROHIT
Director of Market Insights, Data and Analytics
SFI Health,
Leading Pharmaceutical Companywww.sfihealth.com/

We at SFI Health approached MarketsandMarkets for an Opportunity Assessment on "Incidence and Prevalence of Focus Indications" as we wanted to know the most attractive HCPs like Physician, Functional MD, Naturopath and Pharmacist. The project was critical for us to ensure our focus on the right target which would enable sustainable growth and profitability for SFI Health. The business insights provided exceeded our expectations and we were extremely impressed. The team at MarketsandMarkets is highly professional and detail oriented and very well understood our business needs. MarketsandMarkets offers a unique combination of expertise and dedicated engagement model. We identified 2 new products to be launched in coming months, based on the research findings provided by MarketsandMarkets. We are happy with the services and would strongly recommend MarketsandMarkets to my peers in the industry.

BEATRIZ DE LA CALLE
Head of Commercial Analytics
Qualicaps,
Leading Pharmaceutical Companywww.qualicaps.com/

We partnered with MarketsandMarkets for an assessment study on hard empty capsules. The team was extremely professional in understanding our business requirements and we received timely responses to all our queries. The market intelligence and the recommendations has met our business requirements. We were extremely impressed to see the final study results; it really exceeded our expectations. The market intelligence offered by MarketsandMarkets, and clarity on next steps will help us achieve our business objective for the Year 2021. We are happy with the services and would strongly recommend MarketsandMarkets to my peers in the industry.

Bob Williams,
Senior Director Business Development & Innovation
Bracco Diagnostics Inc.,
Italian Multinational in life sciences sector and a World Leader in imaging diagnosticsimaging.bracco.com/us-en
We were pleased with targeted insights that MarketsandMarkets identified from a custom study on the 'Radiation Dose Management Solutions Market'. Your team identified and characterized the market participants as well as underlying trends accurately. This study was useful to Bracco in formulating business strategies for our dose monitoring product lines and we thank MarketsandMarkets for the job well done.
Cody Coonradt,
Market Development and Strategy Manager
3M Health Information Systems,
Leader in Health care Coding, Payment & Analytics Solutions.www.3m.com/3M/en_US/health-information-systems-us
The value for our organization comes from three things: depth of research, specificity of segments and being easy to work with. As important as the first two are, the third can't be underestimated. MarketsandMarkets, maybe more than any other research vendor, wants to know what is top of mind for our team and what big questions we are grappling to answer.
Their customer first approach and high value engagement model, have given us great analysis and excellent value for money


Growth opportunities and latent adjacency in Quantum Computing in Healthcare Market