
Quantum Computing Market Size, Share & Trends

Quantum Computing Market Size, Share & Trends by Offering, Deployment (On-Premises and Cloud), Application (Optimization, Simulation, Machine Learning), Technology (Trapped Ions, Quantum Annealing, Superconducting Qubits), End User and Region - Global Forecast to 2030


QUANTUM COMPUTING MARKET SIZE, SHARE & TRENDS
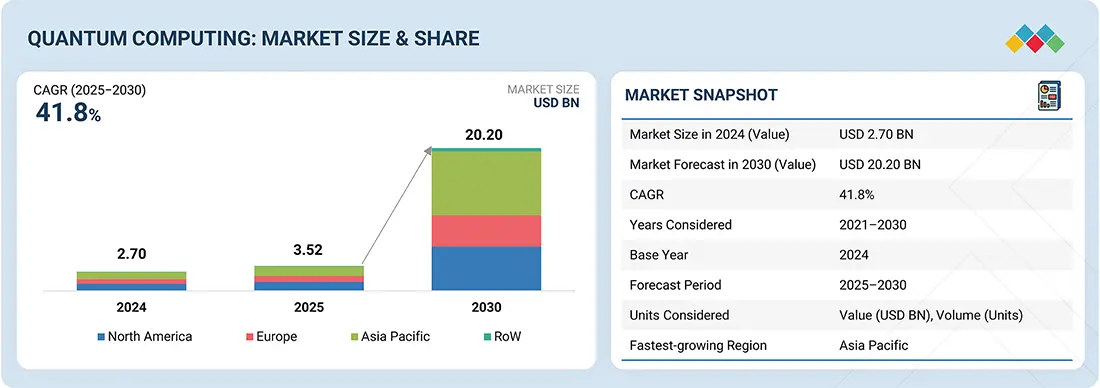
According to Marketsandmarkets, The global Quantum computing market size was valued at USD 3.52 billion in 2025 and is projected to reach USD 20.20 billion by 2030, growing at a CAGR of 41.8%. from 2025 to 2030. The growth pattern of the quantum computing market growth is marked by rapid advancements in hardware, increasing cloud-based accessibility, and rising investments from both private and public sectors. Key segments positively impacting the market include machine learning, optimization, and simulation applications, as well as cloud-based deployments, which lower entry barriers. Government agencies and regulatory bodies are playing a pivotal role, with initiatives such as the US National Quantum Initiative Act and the EU Quantum Flagship Program, as well as similar strategies in Asia, driving R&D funding, workforce development, and industry collaboration. These efforts are accelerating commercialization and shaping the market's trajectory.
MARKET SNAPSHOT TABLE
| REPORT METRIC | DETAILS |
|---|---|
| Market Size in 2025 (Value) | USD 3.52 Billion |
| Market Forecast in 2030 (Value) | USD 20.20 Billion |
| Growth Rate | CAGR of 41.8% from 2025-2030 |
| Years Considered | 2021-2030 |
| Base Year | 2024 |
| Forecast Period | 2025-2030 |
| Units Considered | Value (USD Billion), Volume (Units) |
| Report Coverage | Revenue forecast, company ranking, competitive landscape, growth factors, and trends |
| Top Companies |
|
| Growth Driver |
|
| Segments Covered |
|
| Regions Covered | North America, Asia Pacific, Europe, and RoW |
Market Size & Forecast
KEY TAKEAWAYS
-
BY OFFERINGThe service segment held the largest share, as it provides on-demand access to quantum resources without costly hardware investments. By enabling cloud-based, democratized access, QCaaS drives faster adoption, innovation, and competitiveness across industries.
-
BY DEPLOYMENTCloud-based deployment is projected to hold the largest share, as it offers flexible access to NISQ systems without requiring ownership of rapidly advancing, non-portable hardware. This model allows users to leverage diverse quantum devices and simulators remotely, making it a key revenue stream for service providers.
-
BY TECHNOLOGYSuperconducting qubits dominate the quantum computing market trends due to their maturity, scalability, and compatibility with existing cryogenic technologies, enabling faster gate operations and commercial viability. Backed by heavy investments from IBM, Google, and Rigetti, they drive widespread cloud adoption and foster a strong ecosystem that secures their market leadership.
-
BY APPLICATIONThe optimization segment is estimated to account for the largest market share, as quantum algorithms enable faster and more efficient solutions to complex problems compared to traditional methods. Applications span finance, logistics, AI, and operations research, helping organizations enhance decision-making, streamline operations, and lower costs.
-
BY END USER INDUSTRYThe banking & finance sector is expected to hold the largest market share, leveraging quantum computing for risk modeling, trading strategies, asset pricing, and portfolio optimization. Its ability to address the industry’s complexities makes quantum computing a valuable tool for enhancing financial decision-making.
-
BY REGIONAsia Pacific is projected to witness the fastest growth in the quantum computing market, driven by strong government initiatives, rising investments, and rapid digital transformation. Countries like China, Japan, South Korea, India, and Australia are actively funding quantum R&D to achieve technological leadership.
-
COMPETITIVE LANDSCAPEMajor vendors in the quantum computing market include IBM (US), D-Wave Quantum Inc. (Canada), Microsoft (US), Amazon Web Services (US), Rigetti Computing (US), IonQ (US), QC Ware (US), QUANTINUUM (US), Toshiba (Japan), Google (US), and Intel (US). Key strategies adopted by the players in the quantum computing market ecosystem to enhance their product portfolios, increase their market share, and expand their presence in the market mainly include new product launches, partnerships, and acquisitions.
A major driver of the quantum computing industry is the rising need for advanced computational power to solve complex problems beyond the scope of classical computers. Industries such as healthcare, finance, and materials science are increasingly exploring quantum solutions for drug discovery, portfolio optimization, and new material design. Additionally, growing investments from tech giants and governments worldwide are accelerating research, commercialization, and ecosystem development in quantum computing.
Source: Secondary Research, Interviews with Experts, MarketsandMarkets Analysis
TRENDS & DISRUPTIONS IMPACTING CUSTOMERS' CUSTOMERS
The emergence of technologies like superconducting qubits and topological qubits, among others, resulted in the demand for enhanced computing systems due to shifting from classical to quantum computing systems. Quantum computing enables quantum sensing, quantum imaging, cryptography, and communications. Technological advancements have fueled the demand for security in banking & finance, space & defense, transportation & logistics, healthcare & pharmaceuticals, energy & power, chemicals, academia, and government verticals.
Source: Secondary Research, Interviews with Experts, MarketsandMarkets Analysis
QUANTUM COMPUTING MARKET DYNAMICS
Level
-
Rising adoption in BFSI sector

-
Increasing investments in quantum computing technology

Level
-
High error rates and qubit instability

Level
-
Technological advancements in quantum computing technology

-
Growing application for drug discovery

Level
-
Difficulties associated with engineering and developing quantum computing

Source: Secondary Research, Interviews with Experts, MarketsandMarkets Analysis
Driver: Rising adoption in BFSI sector
Quantum computing is increasingly adopted in banking and finance to enhance trade speed, data processing, and risk management, offering faster and more cost-efficient solutions than classical systems. Its applications include next-gen cryptography for cybersecurity, fraud detection through behavior analysis, and optimized portfolio management when combined with AI. Furthermore, integrating quantum computing with blockchain is expected to deliver highly secure, faster, and cost-efficient transactions, reducing downtime and boosting efficiency in financial services.
Restraint: High error rates and qubit instability
A key restraint for the quantum computing market is the high error rates and instability of qubits, which are highly sensitive to environmental interference, causing decoherence and computational errors. Achieving stability requires complex error correction techniques and fault-tolerant architectures that demand vast numbers of qubits, advanced cryogenic cooling, and costly infrastructure. These challenges make systems resource-intensive and expensive, slowing commercialization and limiting practical adoption in the near term.
Opportunity: Growing application for drug discovery
Biopharmaceutical R&D is costly, time-intensive, and risky, with drug development taking 10–15 years, costing over USD 2 billion, and having less than a 10% success rate. Quantum computing offers advanced capabilities for simulating complex biological systems, accelerating early-stage drug discovery and development. By enabling faster molecular modeling and drug–target interaction analysis, quantum tools can significantly reduce optimization time compared to conventional high-performance computing.
Challenge: Difficulties associated with engineering and developing quantum computing
Qubits require ultra-low temperatures for stable operation, as they heat up quickly during calculations, with systems like D-Wave’s needing cooling to 0.02 K (-460°F). Standard cooling methods are inadequate, making specialized mechanisms essential to run algorithms back-to-back. Additionally, quantum computers face challenges such as decoherence, noise, and faults from environmental interactions, often leading to errors and unreliable outputs.
Quantum Computing Market: COMMERCIAL USE CASES ACROSS INDUSTRIES
| COMPANY | USE CASE DESCRIPTION | BENEFITS |
|---|---|---|
 |
IBM and Daimler AG are collaborating to apply quantum computing for optimizing chemical reactions and reactor design. The partnership aims to improve reaction efficiency, reduce energy use, and enhance reactor performance. This effort supports advanced material development for the automotive industry. | While specific outcomes of this collaboration may not be publicly available due to the early stage of quantum computing, it highlights how leading companies are actively exploring quantum computing for reactor design and optimization in the chemical industry. |
 |
BASF is developing new materials across industries using quantum techniques combined with classical computing to enhance cheminformatics and machine learning models predicting molecular properties. | Collaborating with Zapata, BASF benchmarks quantum-enhanced machine learning against classical methods using the Orquestra platform, focusing on feature selection and classification in supervised learning. |
Logos and trademarks shown above are the property of their respective owners. Their use here is for informational and illustrative purposes only.
QUANTUM COMPUTING MARKET ECOSYSTEM
The figure illustrates the comprehensive ecosystem of the quantum computing companies , showcasing players across core systems, platforms, services, and adjacent technologies. It highlights the diversity of approaches, including superconducting qubits, trapped ions, spin-based systems, and quantum annealers, with contributions from global technology leaders. The framework also maps supporting elements such as software development kits, error correction tools, and provisioned services, reflecting the collaborative nature of the industry. Additionally, it emphasizes adjacent segments like quantum-inspired computing and cryptography, underlining how the broader innovation landscape supports commercialization and scalability of quantum technologies.
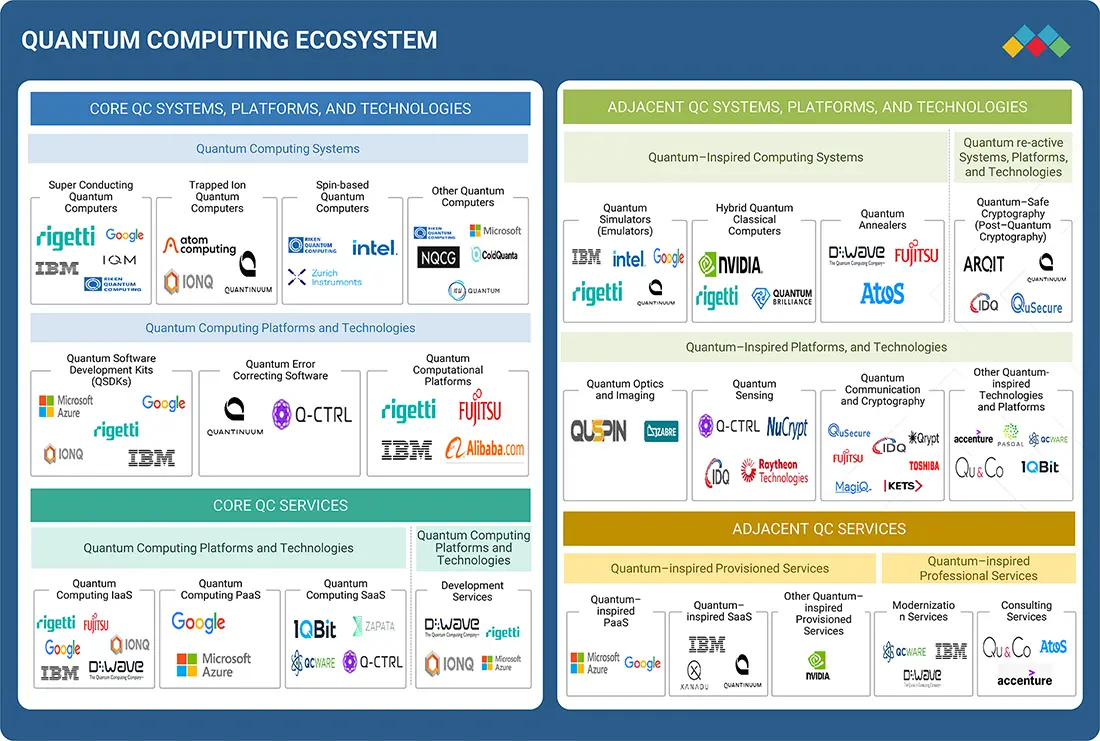
Logos and trademarks shown above are the property of their respective owners. Their use here is for informational and illustrative purposes only.
QUANTUM COMPUTING MARKET SEGMENTS
Source: Secondary Research, Interviews with Experts, MarketsandMarkets Analysis
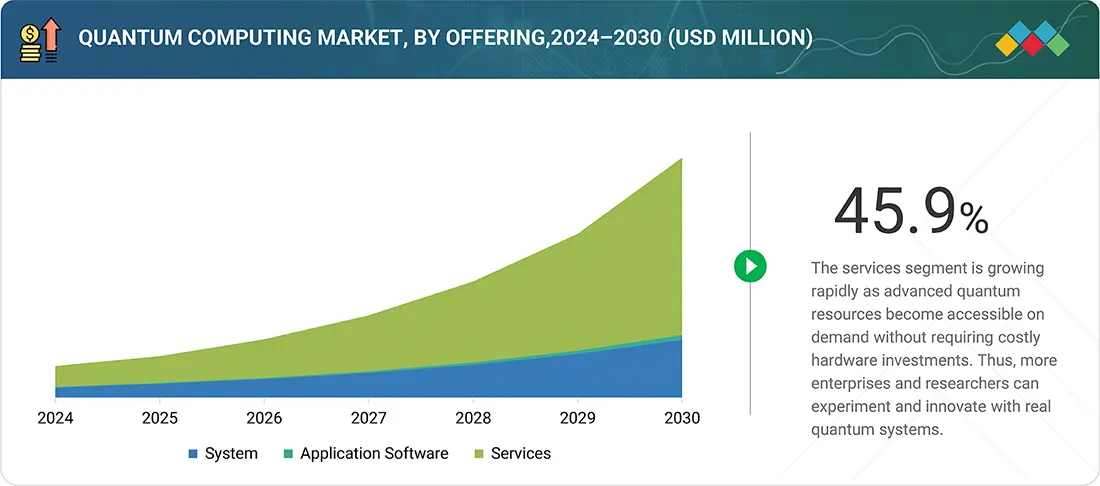
Quantum Computing Market, By Offering
The services segment accounted for the largest share of the overall quantum computing market. QCaaS accelerates market growth by making advanced quantum resources accessible on demand, without requiring costly hardware investments, thus allowing more enterprises and researchers to experiment and innovate with real quantum systems. This democratized, cloud-based access fuels rapid adoption across multiple industries, driving expansion and competitive differentiation in the quantum computing ecosystem.
Quantum Computing Market, By Deployment
Cloud-based deployment is expected to have the largest market share during the forecast period. The cloud approach is expected to become a significant revenue source for quantum computing service providers, with users paying for access to noisy intermediate-scale quantum (NISQ) systems that can solve real-world problems. The limited lifespan of rapidly advancing quantum computing systems also favors cloud service providers. The flexibility offered by quantum computing systems to users is another factor favoring the adoption of cloud quantum computing systems and services. For the foreseeable future, quantum computers are expected not to be portable. A cloud can give users access to different devices and simulators from their laptops.
Quantum Computing Market, By Application
The optimization application is expected to have the largest market size during the forecast period. Quantum computing optimization is the process of using quantum computing to improve the performance of optimization algorithms. This involves using quantum algorithms to solve optimization problems more quickly and efficiently than traditional methods. Quantum computing can be used in various fields, including finance, logistics, artificial intelligence, and operations research. In addition, quantum computing can be used to solve difficult optimization problems that are too difficult to solve using traditional methods. By leveraging the power and speed of quantum computing, organizations can optimize their operations, improve their decision-making, and reduce costs.
Quantum Computing Market, By End-use Industry
The banking & finance end-use industry is expected to account for the largest market share during the forecast period. In the banking & finance industry, quantum computing is used for risk modeling applications and trading strategies. It is also used to detect market instabilities and optimize trading trajectories, portfolios, and asset pricing and hedging. As the financial sector is difficult to understand, the quantum computing approach is expected to help users understand its complexities
QUANTUM COMPUTING MARKET BY REGION
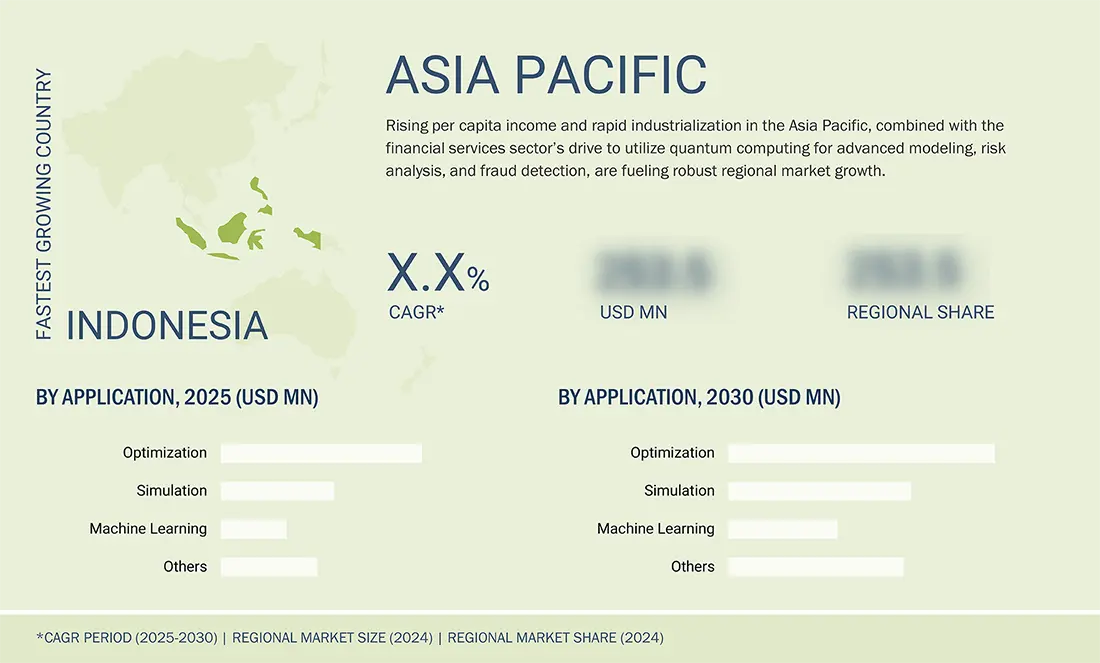
Asia Pacific to be the fastest-growing region in the global quantum computing market during the forecast period
Asia Pacific is expected to record the highest growth rate in the quantum computing market growth due to a combination of government initiatives, rising investments, and the rapid digital transformation of industries in the region. Countries such as China, Japan, South Korea, India, and Australia are heavily investing in quantum research and development, with national strategies and funding programs aimed at achieving technological leadership
The US Quantum Computing Market is projected to grow from USD 0.97 billion in 2025 to USD 4.59 billion by 2030, registering a CAGR of 36.4%.The US quantum computing market size has experienced remarkable growth, driven by substantial investments from the US government and advancements by major technology corporations such as IBM, Google, and Microsoft
The Germany quantum computing market is projected to grow from USD 0.19 billion in 2025 to USD 0.93 billion by 2030, registering a CAGR of 37.5%. The Germany quantum computing market size is witnessing strong growth, driven by substantial government investments aimed at advancing quantum technology capabilities.
Quantum Computing Market: COMPANY EVALUATION MATRIX
Stars are the leading market players in terms of new product launches, introduction of innovative technologies, and the adoption of growth strategies. These players have a broad portfolio, innovative product offerings, and a global presence. They have well-established channels throughout the value chain. IBM (US) comes under this category. Emerging leaders demonstrate more substantial product innovations than their competitors. Companies are investing more in R&D to launch several products in the market. A few players have a unique portfolio, while some have heavily invested in R&D or recently launched several products or innovative products. Google (US) comes under this category.
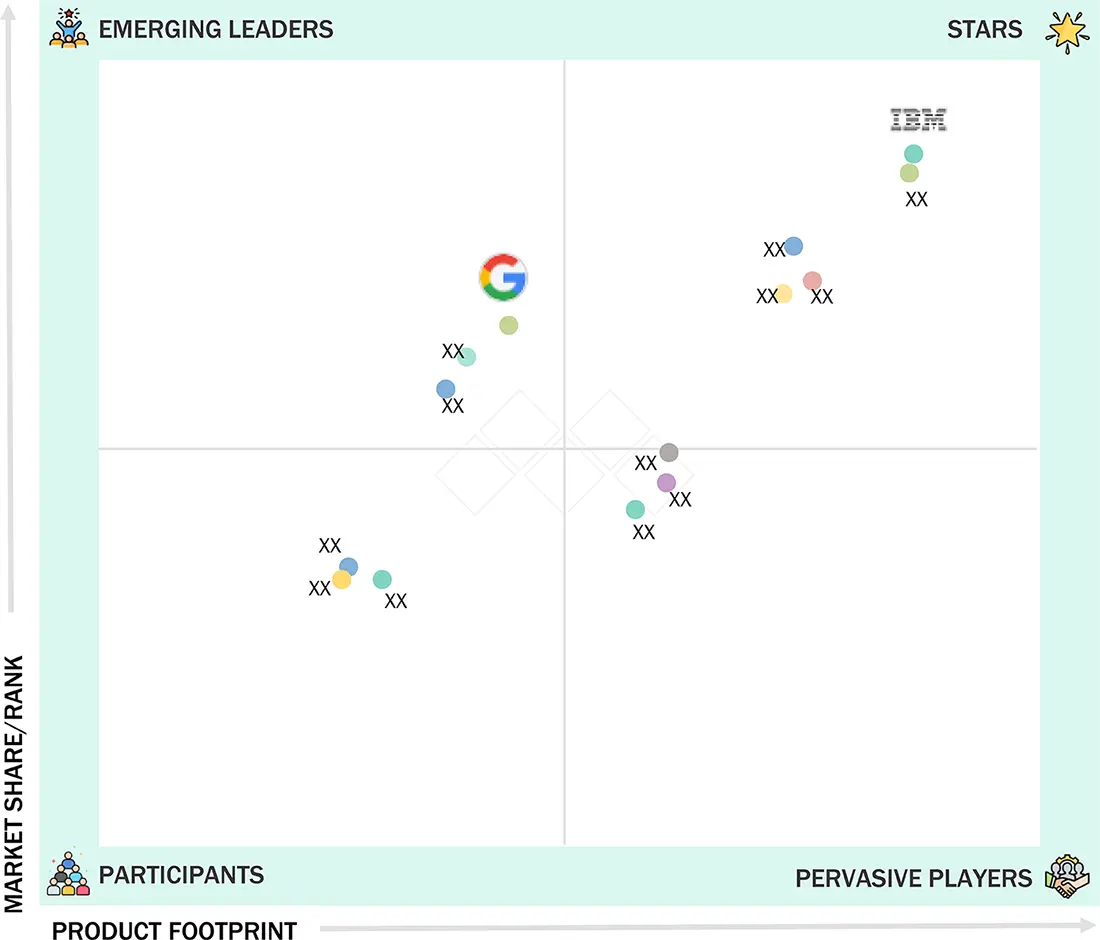
Source: Secondary Research, Interviews with Experts, MarketsandMarkets Analysis
KEY MARKET PLAYERS
WHAT IS IN IT FOR YOU: Quantum Computing Market REPORT CONTENT GUIDE
DELIVERED CUSTOMIZATIONS
We have successfully delivered the following deep-dive customizations:
| CLIENT REQUEST | CUSTOMIZATION DELIVERED | VALUE ADDS |
|---|---|---|
| South Korea Quantum Computing Startup | Market Scouting, Market Sizing/Forecasting, Market Entry, Market Expansion, PESTEL Analysis, Customer Gap Analysis, Market Share Assessment, Competitive Benchmarking, Channel Benchmarking, Pricing Intelligence, Competitive Assessment, Collaboration Strategy, Product Assessment, Consumer Behaviour, Positioning & Segmentation, Conjoint Analysis | Assist the startup in securing investment and funding within the quantum computing market |
RECENT DEVELOPMENTS IN QUANTUM COMPUTING MARKET
- August 2025 : D-Wave announced the launch of a new suite of resources aimed at accelerating innovation in quantum artificial intelligence (AI) and machine learning (ML). The release includes an open-source quantum AI toolkit and a demonstration project. Now available for download, the toolkit enables developers to integrate quantum computing into contemporary ML architectures seamlessly. The accompanying demo showcases how developers can use D-Wave™ quantum processors to generate simple images—an advancement the company views as a significant milestone in the evolution of quantum AI capabilities.
- May 2025 : QphoX, Rigetti, and the UK's National Quantum Computing Centre (NQCC) announced a collaboration in May 2025 focused on advancing multi-channel optical readout technology for quantum processors. The project aims to enable optical readout of all qubits in Rigetti's 9-qubit Novera quantum processor unit (QPU) by scaling QphoX's microwave-to-optical transduction technology. This approach replaces conventional microwave amplifiers and coaxial wiring with optical fibers, significantly reducing heat load on cryogenic systems—a critical bottleneck in scaling superconducting quantum computers.
- January 2025 : Microsoft launched the Quantum Ready Program in early 2025 to help businesses prepare for the emerging quantum computing era. The program is designed to equip business and government leaders with tools, insights, and strategies to navigate the transformative potential of quantum computing.
- August 2024 : IBM's quantum-safe cryptographic algorithms were officially published as part of the first post-quantum cryptography standards by NIST. Among the three new standards, IBM's ML-KEM (CRYSTALS-Kyber) and ML-DSA (CRYSTALS-Dilithium) were developed in collaboration with industry partners, while SLH-DSA (SPHINCS+) was co-developed by a researcher at IBM. These standards are crucial for securing data against future quantum computer threats. IBM continues to lead in post-quantum cryptography, integrating these advancements into its products and services to ensure a quantum-safe future.
- December 2023 : Rigetti unveiled its Novera QPU. This 9-qubit quantum processing unit (QPU) boasts innovative features like tunable couplers and a square lattice design, which enable faster two-qubit operations and increased connectivity. Notably, the Novera QPU is manufactured in Rigetti's own Fab-1 facility, setting it apart as the first commercially available QPU produced in a dedicated quantum device manufacturing plant.
Table of Contents
 Exclusive indicates content/data unique to MarketsandMarkets and not available with any competitors.
Methodology
The study involved four major activities in estimating the size of the quantum computing market. Exhaustive secondary research has been done to collect information on the market, peer, and parent markets. The next steps are to validate these findings, assumptions, and size with industry experts across the value chain through primary research. Both top-down and bottom-up approaches have been employed to estimate the global market size. After that, market breakdown and data triangulation have been used to estimate the market sizes of segments and subsegments.
Secondary Research
Secondary sources for this research study include corporate filings (such as annual reports, investor presentations, and financial statements), trade, business, and professional associations, white papers, certified publications, articles from recognized authors, directories, and databases. Secondary data was collected and analysed to determine the overall market size, further validated by primary research.
Primary Research
Extensive primary research was conducted after understanding and analysing the quantum computing market scenario through the secondary research process. Several primary interviews were conducted with key opinion leaders from the demand- and supply-side vendors across four major regions—North America, Asia Pacific, Europe, and RoW (including the Middle East, Africa, and South America). After interacting with industry experts, brief sessions were conducted with highly experienced independent consultants to reinforce the findings from our primary research. This and the in-house subject matter experts’ opinions have led us to the findings described in the remainder of this report.

Note: Three tiers of the companies were defined based on their total/segmental revenue as of 2024; Tier 1 = >USD 1 billion, Tier 2 = USD 1 billion–USD 500 million, and Tier 3 = USD 500 million. Others include sales, marketing, and product managers.
To know about the assumptions considered for the study, download the pdf brochure
Market Size Estimation
Both top-down and bottom-up approaches have been used to estimate and validate the total size of the quantum computing market. These methods have also been extensively used to estimate the sizes of various market subsegments. The research methodology used to estimate the market sizes includes the following:
- Identifying various applications that use or are expected to use the quantum computing market.
- Analyzing historical and current data pertaining to the size of the quantum computing market for each application
- Analyzing the average selling prices of quantum computing based on different technologies
- Studying various paid and unpaid sources, such as annual reports, press releases, white papers, and databases
- Identifying leading providers of quantum computing, studying their portfolios, and understanding features of their products and their underlying technologies, as well as the types of quantum computing products offered
- Tracking ongoing and identifying upcoming developments in the market through investments, research and development activities, product launches, expansions, and partnerships, and forecasting the market size based on these developments and other critical parameters
- Carrying out multiple discussions with key opinion leaders to understand the technologies used in quantum computing, and products wherein they are deployed, and analyzing the breakdown of the scope of work carried out by key manufacturers of quantum computing providers
- Verifying and cross-checking estimates at every level through discussions with key opinion leaders, such as CXOs, directors, and operations managers, and finally with domain experts at MarketsandMarkets
Quantum Computing Market : Top-Down and Bottom-Up Approach

Data Triangulation
The market has been split into several segments and subsegments after arriving at the overall market size, using the market size estimation processes explained above. Data triangulation and market breakdown procedures have been employed to complete the overall market engineering process and arrive at the exact statistics of each market segment and subsegment, wherever applicable. The data has been triangulated by studying various factors and trends from both the demand and supply sides.
Market Definition
Quantum computing involves phenomena such as quantum entanglement and quantum mechanics superposition that quantum computers use for their enhanced computing power. The improved computing power of quantum computers can be attributed to how data is represented. Conventional computers use bits that can either be 1s or 0s, while quantum computers use qubits (quantum bits), which can be both 0s and 1s simultaneously due to superposition. Quantum computing devices or quantum computers operate with nanoscale components at low temperatures, and they have the potential to address some of the most challenging computational problems.
Key Stakeholders
- Research organizations and universities
- Original equipment manufacturers (OEMs)
- Technology standard organizations, forums, alliances, and associations
- Analysts and strategic business planners
- Government bodies, venture capitalists, and private equity firms
- End users
Report Objectives
- To define, describe, segment, and forecast the quantum computing market in terms of value based on offering, deployment, technology, application, end-user, and region.
- To estimate the size of the market and its segments concerning four main regions, namely, North America, Europe, Asia Pacific, and the Rest of the World (RoW), along with their key countries.
- To provide detailed information regarding the key factors influencing market growth, such as drivers, restraints, opportunities, and challenges
- To offer a detailed analysis of the quantum computing value chain
- To analyze the opportunities in the market for stakeholders and provide a detailed competitive landscape of the market leaders
- To strategically profile the key players and comprehensively analyze their market ranking and core competencies
- To analyze key growth strategies such as expansions, contracts, joint ventures, acquisitions, product launches and developments, and research and development activities undertaken by players operating in the quantum computing market.
Available Customizations
With the given market data, MarketsandMarkets offers customizations according to the specific requirements of companies. The following customization options are available for the report:
Company Information:
- Detailed analysis and profiling of 34 market players
Key Questions Addressed by the Report
What is the current size of the Quantum Computing Market?
Global Quantum computing market size was valued at USD 3.52 billion in 2025 and is projected to reach USD 20.20 billion by 2030, growing at a CAGR of 31.3%. from 2025 to 2030
What is the projected market size of the Quantum Computing Market by 2030?
Quantum Computing Industry worth $20.20 billion by 2030
What CAGR is expected for the Quantum Computing Market between 2025 and 2030?
The market is forecast to register a CAGR of 31.3% during the 2025–2030 period.
What are the major trends shaping the Quantum Computing Market?
Key trends include increasing cloud-based quantum computing access, growth of Quantum Computing as a Service (QCaaS), rising AI integration, and expanding applications in optimization, simulation, and machine learning.
What is the primary growth driver for the Quantum Computing Market?
One of the major growth drivers is the rising adoption of quantum computing in the BFSI sector for portfolio optimization, fraud detection, risk analysis, and next-generation cybersecurity applications.
Which companies are leading the Quantum Computing Market?
Major market participants include IBM, Amazon Web Services, Microsoft, Google, Intel, D-Wave Quantum, Rigetti Computing, Quantinuum, and IonQ.
Which industry is expected to generate the highest demand for quantum computing?
The Banking, Financial Services, and Insurance (BFSI) sector is expected to hold the largest market share due to its demand for advanced analytics, optimization, simulation, and fraud detection capabilities.
Which region is expected to grow the fastest in the Quantum Computing Market?
The Asia Pacific region is projected to be the fastest-growing market, supported by increasing investments and government initiatives in countries such as China, India, Japan, and South Korea.
What opportunities are highlighted in the Quantum Computing Market report?
Key opportunities include drug discovery, financial modeling, supply chain optimization, machine learning, cybersecurity, and advanced simulation applications where classical computing faces limitations.
What does the report analysis indicate about the future of the Quantum Computing Market?
The report indicates strong long-term growth driven by rising investments, increasing partnerships, cloud-based quantum access, government funding programs, and advancements in quantum hardware and software technologies.
Need a Tailored Report?
Customize this report to your needs
Get 10% FREE Customization
Customize This ReportPersonalize This Research
- Triangulate with your Own Data
- Get Data as per your Format and Definition
- Gain a Deeper Dive on a Specific Application, Geography, Customer or Competitor
- Any level of Personalization
Let Us Help You
- What are the Known and Unknown Adjacencies Impacting the Quantum Computing Market
- What will your New Revenue Sources be?
- Who will be your Top Customer; what will make them switch?
- Defend your Market Share or Win Competitors
- Get a Scorecard for Target Partners

Custom Market Research Services
We Will Customise The Research For You, In Case The Report Listed Above Does Not Meet With Your Requirements
Get 10% Free CustomisationTESTIMONIALS

Tetsuya Ohhira
Business Development Manager-Technology Business
Nikon Corporation,
Leading Japanese MNC specializing in optics and imaging productswww.nikon.com
MarketsandMarkets™ response
is quick. Their attitude is flexible and positive. Analyst Insights are globally considered and
significant. Client Services quickly respond to our inquiry and demand. Their wide range of global
surveys help us make our strategic plan.
We hope Knowledge Store will be easier to search
for a report.
VP - Marketing & Business Development
Leading Provider of Process Control Solutions
We engaged with MarketsandMarkets on a study to perform an analysis and recommend a Go-To-Market strategy for metrology and process control in the semiconductor market. The study was tailored to our targets and needs with well-defined milestones. Our overall experience with the MarketsandMarkets team was very good throughout the project in all aspects including the analysis methodologies used, the quality and depth of primary and secondary data sets, the professionalism and flexibility of the team and the ability to meet the target schedule and milestones. We want to thank MarketsandMarkets team for a job well done.
Growth opportunities and latent adjacency in Quantum Computing Market


Jordan
Apr, 2026
What is the expected ROI and exit timeline (IPO, acquisition, or long-term hold) for investments in this space.
Roger
Apr, 2026
What role will quantum computing play in disrupting industries such as banking, cybersecurity, and drug discovery, and where are the earliest monetization opportunities.
Jane
Apr, 2022
I have a specific Interest in Commercialisation of quantum technologies .
Ishani
Apr, 2022
Interested in learning more about the quantum computing market. .
Peter
Apr, 2022
Photonics application for quantum computer qbit device fabrication .
Giovanni
Apr, 2022
To gain an insight of the economic perspectives of quantum computing, as an essential part of scientific planning (I am a professional physicist working in superconductivity).
Michal
Sep, 2022
Quantum simulation market size over years, use cases, most promising approaches..