Rail Infrastructure Market by Investment Type (New Construction, Upgradation, Maintenance), Railway (Mainline, High Speed, Metro, Commuter, Freight), Application (AC, DC, Dual-System, Third Rail), Infrastructure type, and Region - Global Forecast to 2033

icon1
USD 462.13 BN
MARKET SIZE, 2033
icon2
CAGR 5.6%
(2026-2033)
icon3
300
REPORT PAGES
icon4
200
MARKET TABLES

OVERVIEW

rolling-stock-market-infrastructure-analysis Overview

Source: Secondary Research, Interviews with Experts, MarketsandMarkets Analysis

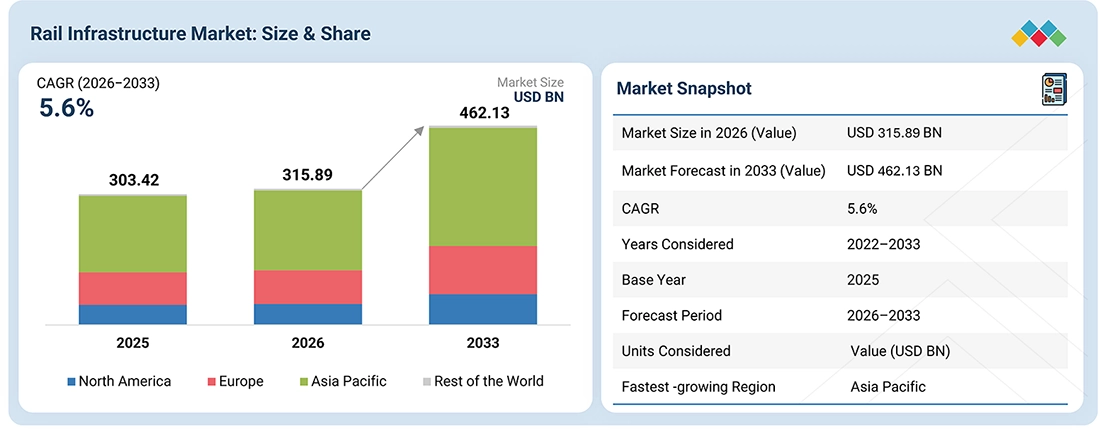
The rail infrastructure market is projected to grow from USD 315.89 billion in 2026 to USD 462.13 billion in 2033, at a CAGR of 5.6%. Rail infrastructure development is shifting from standalone track construction to integrated systems that combine track, electrification, signaling, telecommunications, digital asset management, stations, and operational control. This shift is increasing demand for interoperable infrastructure packages as high-speed, cross-border, freight, and urban networks expand. In Europe, investment is increasingly focused on modernization and interoperability, supported by the European Commission’s USD 1.26 billion CEF Transport call in June 2026, targeting rail infrastructure, high-speed connectivity, and network resilience. New EU railway capacity rules are also strengthening cross-border coordination and digital capacity management. Technologically, operators are shifting toward connected, software-enabled systems using AI-based traffic management, predictive maintenance, digital twins, cloud-based signaling, and real-time asset monitoring. These technologies improve asset utilization, operational control, maintenance planning, and lifecycle efficiency. In India, the 2026 to 2027 railway budget continues to support major expenditure on track, works, rolling stock, and equipment, reinforcing the combined expansion and modernization of railway networks.

KEY TAKEAWAYS

  • By Region
    The Asia Pacific segment is projected to grow at a CAGR of 5.8% during the forecast period.
  • By Infrastructure Type
    The rail electrification segment is estimated to account for 11% of the market in 2026.
  • By Railway Type
    The high-speed railway segment is projected to grow at a CAGR of 7.9% during the forecast period.
  • By Investment Type
    The new construction segment holds a 42% share in 2026.
  • By Application
    The application segment is projected to grow fastest during the forecast period.
  • Competitive Landscape - Key Players
    China Railway Group Limited is positioned as a Star, and Wabtec Corporation is positioned as an Emerging Leader.
  • Competitive Landscape - Startups
    Colas Rail is categorized as a Progressive Company, and Egis is classified as a Responsive Company.

Rail infrastructure is shifting from standalone network expansion to integrated railway systems, particularly across high-speed, mainline, freight, and urban rail applications where higher capacity, reliability, and operational efficiency are required. Track, electrification, signaling, telecommunications, stations, and digital control systems are increasingly planned as connected infrastructure rather than individual assets, creating greater demand for integrated project delivery. Infrastructure availability and corridor capacity are becoming key factors in determining where new railway capacity can be developed, while brownfield networks require upgrades that can be executed within limited track-access windows. Market growth is increasingly determined by total lifecycle cost rather than construction expenditure alone, with asset reliability, maintenance requirements, energy efficiency, infrastructure utilization, digital monitoring, and long-term network performance collectively shaping the commercial viability of railway infrastructure investments.

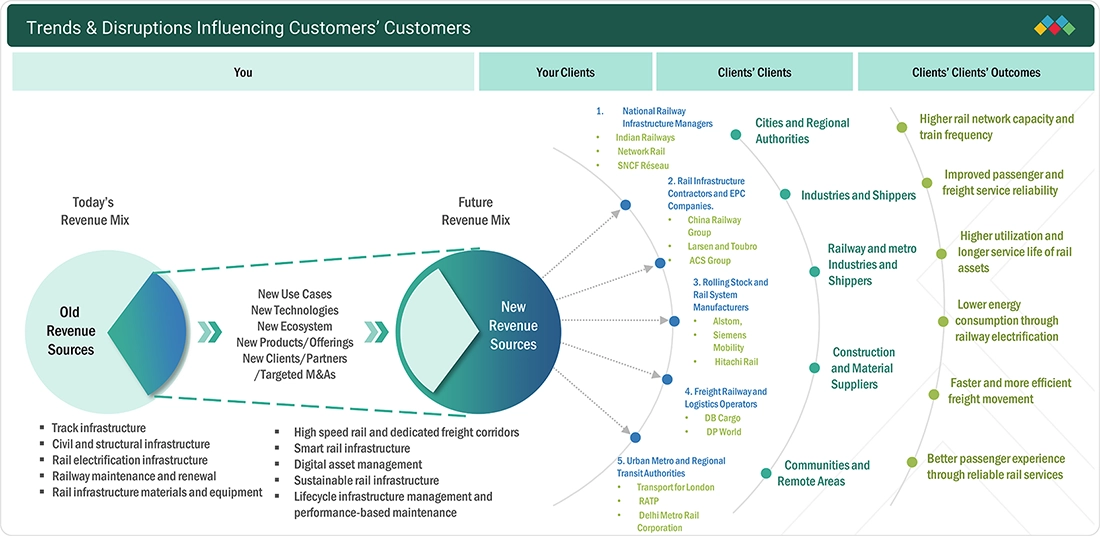
TRENDS & DISRUPTIONS IMPACTING CUSTOMERS' CUSTOMERS

The rail infrastructure market is shifting from traditional track and civil infrastructure toward integrated railway solutions, supported by new construction, network modernization, digital technologies, and lifecycle service requirements. Demand is expanding among railway infrastructure managers, national and regional authorities, metro operators, rail and logistics operators, industries, shippers, and construction suppliers. Emerging revenue opportunities include high-speed and dedicated freight corridors, smart rail infrastructure, digital asset management, sustainable rail infrastructure, and lifecycle infrastructure management. These requirements can translate into higher network capacity and train frequency, improved passenger and freight reliability, greater asset utilization and service life, lower energy consumption, faster freight movement, and more efficient passenger rail services.
rolling-stock-market-infrastructure-analysis Disruptions

Source: Secondary Research, Interviews with Experts, MarketsandMarkets Analysis

MARKET DYNAMICS

Drivers
Impact
Level
  • Cross-border Trade Corridors Creating Infrastructure Demand Beyond Domestic Railway Requirements
  • Network Capacity Expansion & Bottleneck Removal Driving Infrastructure Investment
RESTRAINTS
Impact
Level
  • Restricted Track Access Windows Limiting Brownfield Upgrade Productivity
  • Legacy Infrastructure Complexity Increasing Retrofit & Integration Risk
OPPORTUNITIES
Impact
Level
  • Digital Asset Intelligence Enabling Predictive & Condition-based Infrastructure Management
  • Integrated Corridor Upgrades Unlocking Railway Capacity & Infrastructure Value
CHALLENGES
Impact
Level
  • Mega Projects Expose Contractors to Long Duration Cost Escalation

Source: Secondary Research, Interviews with Experts, MarketsandMarkets Analysis

Driver: Cross-border trade corridors are creating infrastructure demand beyond domestic railway requirements

Cross-border rail corridors are increasing demand for integrated track, signaling, electrification, communications, and station infrastructure. Greater interoperability requirements across national networks are also expanding the need for compatible railway systems and coordinated infrastructure planning.

Restraint: Restricted Track Access Windows Limiting Brownfield Upgrade Productivity

Limited access to operating railway corridors can reduce the time available for track renewal, electrification, signaling upgrades, and other brownfield work. Short possession windows increase coordination requirements, restrict construction productivity, and can extend project completion schedules.

Opportunities: Digital Asset Intelligence Enabling Predictive & Condition-Based Infrastructure Management

Digital asset intelligence can connect infrastructure condition data across track, signaling, electrification, and other railway assets. Predictive and condition based management can support earlier fault identification, targeted maintenance, improved asset availability, and better allocation of maintenance resources.

Challenge: Mega projects expose contractors to long duration cost escalation

Large rail infrastructure projects often involve long execution periods, complex construction activities, multiple contractors, and changing project requirements. These factors can increase exposure to material price increases, labor costs, equipment costs, financing expenses, and schedule-related cost escalation.

RAIL INFRASTRUCTURE MARKET: COMMERCIAL USE CASES ACROSS INDUSTRIES

COMPANY USE CASE DESCRIPTION BENEFITS
company logo
Provides integrated railway infrastructure delivery covering survey and design, railway construction, bridges, tunnels, electrification, high speed rail turnouts, track systems, and infrastructure equipment. CREC also provides vertically integrated turnkey services across large and complex railway projects Enables railway owners to consolidate multiple infrastructure packages under an integrated contractor, reducing interface complexity across civil works, track, electrification, and railway systems. Its broad execution and equipment capabilities support delivery of large corridor projects with greater control over project coordination and construction timelines.
company logo
Provides integrated engineering and construction capabilities across high speed rail, mainline rail, track, bridges, tunnels, electrification, stations, and associated railway infrastructure. Its business model supports large scale railway projects spanning multiple engineering disciplines Enables infrastructure owners to coordinate civil infrastructure and railway systems within large corridor programs, reducing dependency on multiple specialized contractors. The integrated model increases the supplier’s addressable project scope across new construction, network expansion, and modernization programs.
company logo
Provides connected rail infrastructure combining signaling, rail automation, electrification, railway communications, control systems, and digital infrastructure. Its Signaling X platform supports centralized and cloud ready signaling architecture, while its infrastructure portfolio covers freight, transit, and mainline networks Enables operators to increase network capacity and operational visibility by connecting signaling, automation, electrification, and digital control infrastructure. The integrated architecture supports migration from conventional infrastructure toward centralized and software driven railway operations, creating opportunities for recurring digital and infrastructure services.
company logo
Provides track, electrification, signaling, telecommunications, control center, and infrastructure solutions for mainline, high speed, freight, and urban rail. Its portfolio includes ERTMS, digital interlocking, traffic management, catenary, power supply, and track systems Enables railway operators to modernize multiple infrastructure layers through coordinated technology deployment. Integration of signaling, electrification, track, and traffic management increases capacity and reliability while expanding Alstom’s scope from individual equipment supply toward larger modernization and turnkey infrastructure programs.
company logo
Provides mainline and urban rail infrastructure solutions covering ETCS, signaling, interlocking, telecommunications, operations control centers, traffic management, digital asset management, and cybersecurity. Its HMAX platform integrates operational data from signaling and infrastructure assets for predictive maintenance and network optimization Enables operators to connect infrastructure modernization with digital asset management and lifecycle optimization. By combining signaling, communications, control systems, and predictive maintenance, Hitachi Rail can extend its role beyond project deployment into long term infrastructure performance and maintenance services.

Logos and trademarks shown above are the property of their respective owners. Their use here is for informational and illustrative purposes only.

MARKET ECOSYSTEM

The rail infrastructure ecosystem comprises owners and operators of railway infrastructure, signaling and train control providers, track and rail system suppliers, rail electrification and power suppliers, digital and communications providers, and railway EPC and engineering contractors. Infrastructure owners and operators such as Deutsche Bahn InfraGO, SNCF, Network Rail, and Indian Railways manage railway networks and infrastructure assets, while signaling providers such as Siemens, Hitachi Rail, Wabtec, and Alstom support train control and railway safety systems. Track and rail system suppliers, including Vossloh, Pandrol, and voestalpine, supply track components and rail systems, while ABB, Siemens, and Alstom provide electrification and power solutions. Digital and communications providers such as Nokia, Siemens, and Cordel support railway connectivity, diagnostics, and asset monitoring, while EPC and engineering contractors, including China Railway Group, Ferrovial, and other infrastructure contractors, deliver railway construction and integrated infrastructure projects.
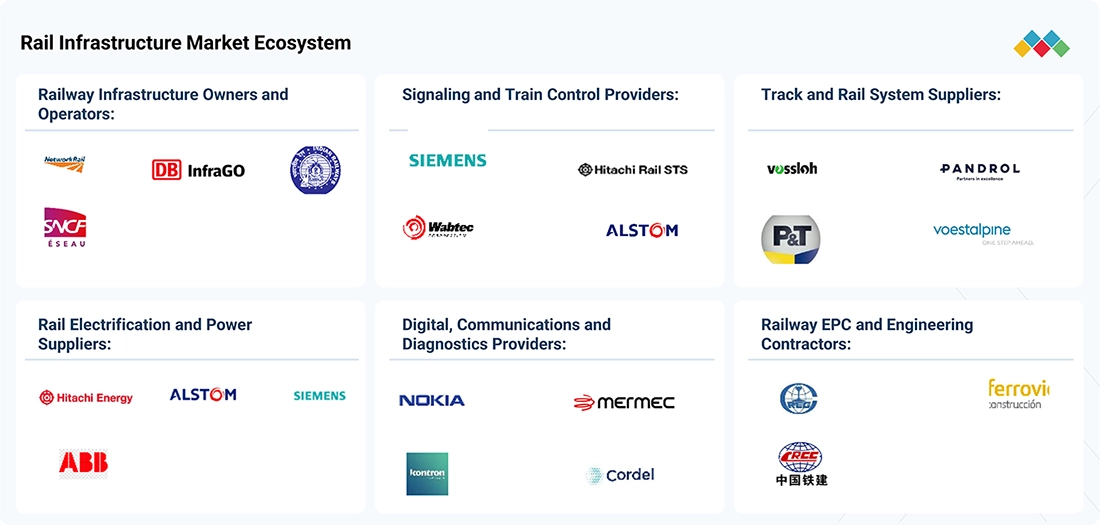
rolling-stock-market-infrastructure-analysis Ecosystem

Logos and trademarks shown above are the property of their respective owners. Their use here is for informational and illustrative purposes only.

MARKET SEGMENTS
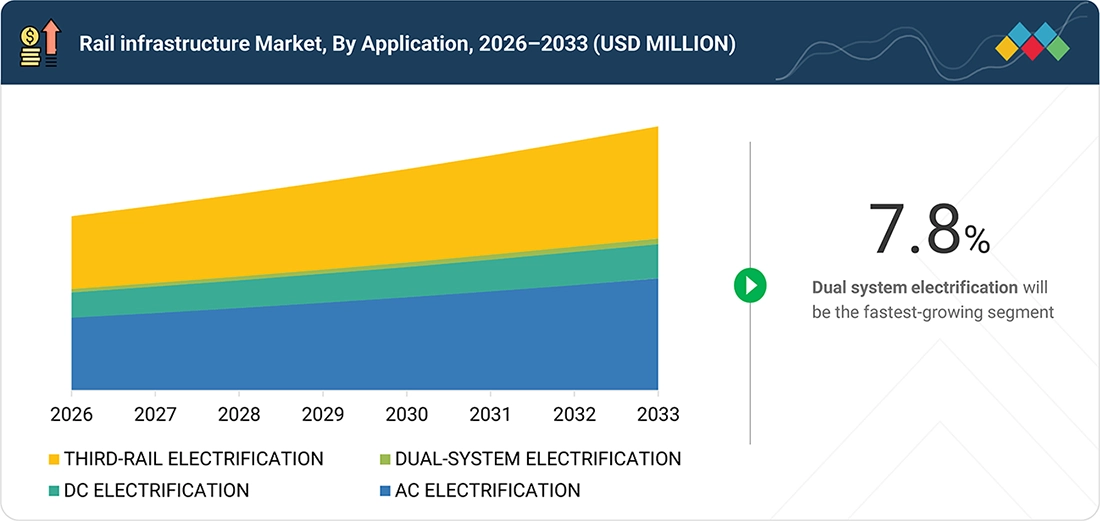
rolling-stock-market-infrastructure-analysis Segments

Source: Secondary Research, Interviews with Experts, MarketsandMarkets Analysis

Rail Infrastructure Market, by Infrastructure Type

Track infrastructure forms the core physical layer of railway networks, including rails, sleepers, fastening systems, ballast, switches, crossings, and track beds. Demand is supported by new railway construction, route expansion, capacity upgrades, and the renewal of aging assets. Track infrastructure requirements vary by railway type and operating conditions, with high-speed and heavy-haul networks requiring higher performance standards, greater structural strength, and tighter maintenance controls.

Rail Infrastructure Market, by Railway Type

Mainline rail encompasses a broad range of railway infrastructure across passenger and freight networks, with requirements spanning track, signaling, electrification, stations, bridges, tunnels, and communications. High-speed rail requires specialized infrastructure designed for higher operating speeds, while urban rail and metro systems place greater emphasis on capacity, station integration, signaling, and constrained corridor development. Regional and commuter rail focuses on reliable passenger connectivity, while freight and heavy-haul rail requires higher axle load capacity, durable track systems, and infrastructure capable of supporting intensive freight operations.

Rail Infrastructure Market, by Investment Type

New construction requires substantial investment across track, civil structures, stations, signaling, electrification, and power infrastructure to establish new railway corridors. Upgradation and Modernization focus on increasing capacity, improving operating speeds, replacing legacy signaling and electrification systems, and adapting existing infrastructure to changing traffic requirements. Maintenance and Renewal involve recurring expenditure on track replacement, signaling equipment, electrification assets, bridges, tunnels, and other infrastructure to maintain network safety, availability, and service performance.

Rail Infrastructure Market, by Application

AC electrification is widely used for mainline and high-speed railway networks where higher power availability and efficient long-distance operation are required. DC electrification remains relevant in urban, regional, and legacy railway networks, particularly where existing systems are already based on direct current supply. Dual-system electrification supports interoperability across networks operating with different traction power standards, while third-rail Electrification is commonly suited to urban and suburban routes where compact infrastructure and high-frequency passenger operations are required.

REGION

Asia Pacific to be the largest region in the rail infrastructure market

In Asia-Pacific, the rail infrastructure market is being shaped by large-scale network expansion, high-speed rail development, freight capacity enhancement, and the modernization of existing railway assets, particularly across China and India. China’s railway fixed-asset investment reached approximately USD 75.7 billion during the first eight months of 2026, while its operating railway network is targeted to expand from 165,000 km at the end of 2025 to around 180,000 km by 2030, including approximately 60,000 km of high-speed rail. India has allocated approximately USD 30.5 billion for railway capital expenditure in 2026 to 2027, including major investments in new tracks, seven proposed high-speed corridors, dedicated freight infrastructure, and railway safety systems. The regional investment mix is shifting from standalone track construction to integrated corridor development, combining civil infrastructure with electrification, signaling, communications, safety systems, and digital railway control. This shift is increasing the infrastructure value per project and creating larger procurement opportunities for suppliers that can address multiple railway system requirements within the same program.
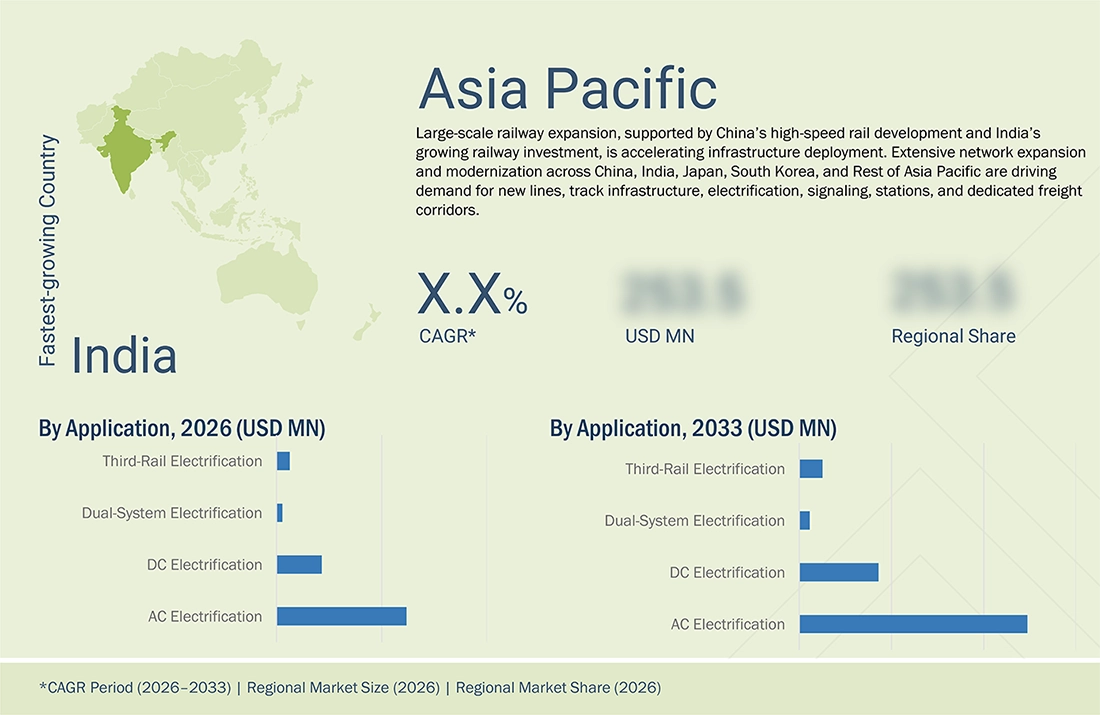
rolling-stock-market-infrastructure-analysis Region

RAIL INFRASTRUCTURE MARKET: COMPANY EVALUATION MATRIX

China Railway Group is positioned as a Star for its extensive global rail footprint, broad portfolio of railway systems, and strong capabilities in rolling stock, signaling, electrification, and integrated rail solutions. Wabtec Corporation is positioned as an Emerging Leader for its broad portfolio of rail technologies, established global presence, and capabilities in locomotives, train control, digital systems, and rail services.
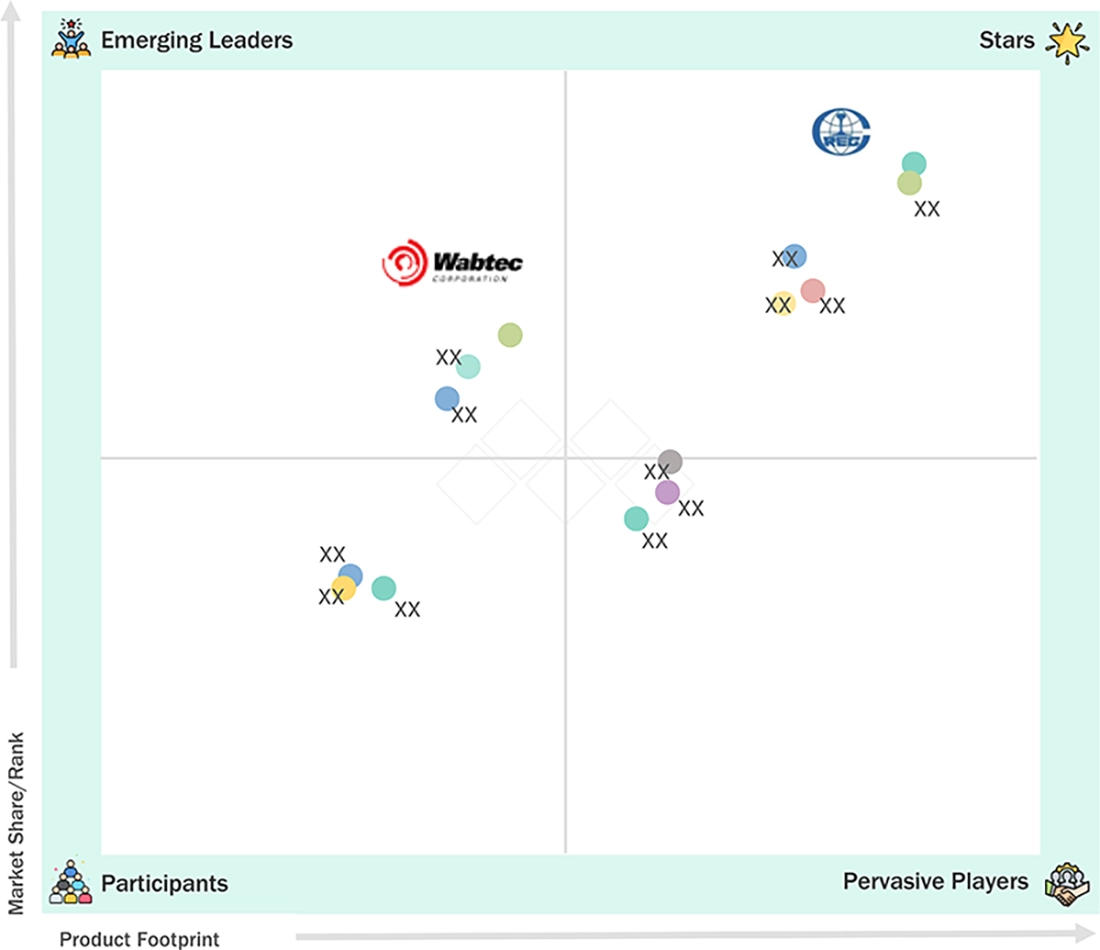
rolling-stock-market-infrastructure-analysis Evaluation Metrics

Source: Secondary Research, Interviews with Experts, MarketsandMarkets Analysis

KEY MARKET PLAYERS

MARKET SCOPE

REPORT METRIC DETAILS
Market Size in 2025 (Value) USD 303.42 Billion
Market Size in 2026 (Value) USD 315.89 Billion
Market Forecast in 2033 (Value) USD 462.13 Billion
Growth Rate CAGR of 5.6% from 2026–2033
Years Considered 2022-2033
Base Year 2025
Forecast Period 2026-2033
Units Considered Value (USD Million)
Report Coverage Revenue Forecast, Competitive Landscape, Company Share, Growth Factors and Trends
Segments Covered
  • Infrastructure Type:
    • Track Infrastructure
    • Rail Electrification
    • Traction Power Infrastructure
    • Station Infrastructure
    • Civil Infrastructure
    • Trackside Infrastructure
  • Railway Type:
    • Mainline Rail
    • High Speed Rail
    • Urban Rail/Metro
    • Regional & Commuter Rail
    • Freight/Heavy Haul Rail
  • Investment Type:
    • New Construction
    • Upgradation & Modernization
    • Maintenance & Renewal
  • Application:
    • AC Electrification
    • DC Electrification
    • Dual System Electrification
    • Third Rail Electrification
Regional Scope Asia Pacific, North America, Europe, Rest of the World

WHAT IS IN IT FOR YOU: RAIL INFRASTRUCTURE MARKET REPORT CONTENT GUIDE
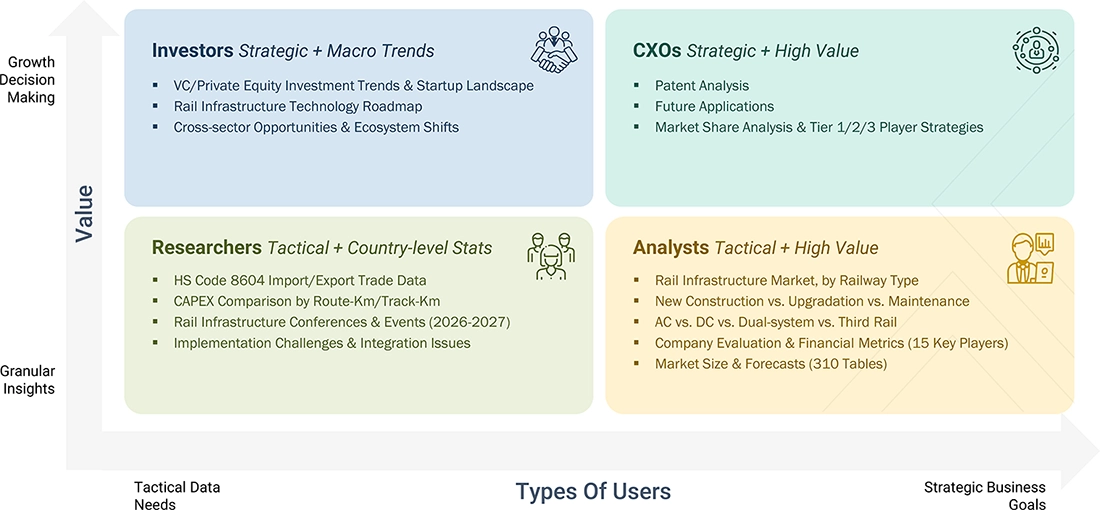
rolling-stock-market-infrastructure-analysis Content Guide

DELIVERED CUSTOMIZATIONS

We have successfully delivered the following deep-dive customizations:

CLIENT REQUEST CUSTOMIZATION DELIVERED VALUE ADDS
Global Rail OEM/System Supplier Benchmarking of signaling, ETCS, CBTC, PTC, railway telecommunications, traffic management, and control systems across key markets, with assessment of infrastructure modernization programs and technology adoption
  • Identify technology white spaces
  • Benchmark competitor system portfolios
  • Prioritize markets with upcoming signaling and digital rail investments
Rail Infrastructure EPC/Contractor Assessment of country level railway construction pipelines covering new lines, track upgrades, electrification, bridges, tunnels, stations, and maintenance programs, with project level investment mapping
  • Identify high value project pipelines
  • Prioritize countries and corridors for bidding
  • Align infrastructure capabilities with upcoming procurement opportunities
Railway Operator/Infrastructure Manager Network level assessment covering route length, electrification, signaling penetration, asset age, capacity constraints, and modernization requirements across passenger and freight corridors
  • Identify infrastructure renewal priorities
  • Quantify modernization opportunities
  • Develop asset replacement and capacity expansion roadmap
Rail Signaling Supplier Benchmarking of ETCS, CBTC, CTCS, PTC, interlocking, train protection, traffic management, and digital signaling deployment across countries and railway applications
  • Identify signaling technology gaps
  • Prioritize markets for system deployment
  • Align product roadmap with railway modernization programs
Rail Electrification Supplier Assessment of electrified route networks, traction power infrastructure, catenary systems, electrification plans, and upcoming railway corridors across target countries
  • Identify electrification project pipeline
  • Prioritize high potential corridors
  • Map opportunities across catenary, traction power, and associated infrastructure
Rail Infrastructure Component Supplier Benchmarking of track systems, turnouts, sleepers, rail fastening systems, overhead line components, signaling equipment, and railway infrastructure components across major railway projects
  • Identify component supply gaps
  • Map OEM and EPC sourcing opportunities
  • Prioritize high growth infrastructure components
Digital Rail/Software Provider Assessment of railway digitalization covering centralized traffic control, SCADA, predictive maintenance, asset monitoring, telecommunications, digital signaling, and railway data platforms
  • Identify digital infrastructure gaps
  • Develop railway software opportunity roadmap
  • Identify opportunities for recurring digital and lifecycle services
Investment/Infrastructure Fund Project level assessment of railway infrastructure investment, government funding, construction pipeline, modernization expenditure, and private participation across target markets
  • Identify investable infrastructure opportunities
  • Assess project pipeline visibility
  • Prioritize markets based on committed investment and infrastructure requirements

RECENT DEVELOPMENTS

  • July 2026 : Siemens received an order from Rail Vikas Nigam Limited for approximately USD 27.4 million for overhead electrification technology for the Rishikesh to Karnaprayag rail line, covering rigid and flexible catenary systems over 102.5 track kilometers.
  • July 2026 : Alstom signed a contract to modernize the 44-kilometer Filiasi to Igiroasa section in Romania with ERTMS Level 2 signaling, GSM-R communications, and upgraded electrification, supporting higher passenger and freight operating speeds.
  • April 2026 : China Railway Group commenced construction of the Wuhan Baishazhou Yangtze River Road Rail Bridge, incorporating a four-track railway section with a double-track high-speed railway and reserved intercity railway capacity.
  • March 2026 : Alstom secured a contract for signaling works in the newly constructed Lódz long distance railway tunnel in Poland, supporting the emerging national high speed rail network and future connections between major Polish cities.
  • March 2026 : China Railway Construction Corporation completed the full track installation of Algeria’s 950-kilometer Western Mining Railway, including a 575-kilometer section constructed by CRCC and local state-owned companies, supporting heavy-haul mineral transport.


Table of Contents

checkmarkExclusive indicates content/data unique to MarketsandMarkets and not available with any competitors.

TITLE
PAGE NO
1
INTRODUCTION


25
2
EXECUTIVE SUMMARY


34
3
PREMIUM INSIGHTS


40
4
MARKET OVERVIEW
Cross-border trade corridors and digital intelligence reshape rail infrastructure investment and management.


44
 
4.1
INTRODUCTION


4.2
MARKET DYNAMICS


4.2.1
DRIVERS


4.2.1.1
CROSS-BORDER TRADE CORRIDORS CREATING INFRASTRUCTURE DEMAND BEYOND DOMESTIC RAILWAY REQUIREMENTS


4.2.1.2
NETWORK CAPACITY EXPANSION & BOTTLENECK REMOVAL DRIVING INFRASTRUCTURE INVESTMENT


4.2.2
RESTRAINTS


4.2.2.1
RESTRICTED TRACK ACCESS WINDOWS LIMITING BROWNFIELD UPGRADE PRODUCTIVITY


4.2.3
OPPORTUNITIES


4.2.3.1
DIGITAL ASSET INTELLIGENCE ENABLING PREDICTIVE & CONDITION-BASED INFRASTRUCTURE MANAGEMENT


4.2.3.2
INTEGRATED CORRIDOR UPGRADES UNLOCKING RAILWAY CAPACITY & INFRASTRUCTURE VALUE


4.2.4
CHALLENGES


4.2.4.1
MEGA PROJECTS EXPOSING CONTRACTORS TO LONG-DURATION COST ESCALATION


4.3
UNMET NEEDS AND WHITE SPACES


4.3.1
UNMET NEEDS IN RAIL INFRASTRUCTURE MARKET


4.3.2
WHITE SPACE OPPORTUNITIES


4.4
INTERCONNECTED MARKETS AND CROSS-SECTOR OPPORTUNITIES


4.4.1
INTERCONNECTED MARKETS


4.4.2
CROSS-SECTOR OPPORTUNITIES


4.5
STRATEGIC MOVES BY TIER 1/2/3 PLAYERS


4.6
INSIGHT ON RAIL INFRASTRUCTURE BY INVESTMENT TYPE


4.6.1
GREENFIELD


4.6.2
BROWNFIELD MODERNIZATION


4.6.3
CAPACITY EXPANSION


4.6.4
RENEWAL AND REHABILITATION


5
INDUSTRY TRENDS
Discover transformative rail infrastructure trends and disruptions reshaping global supply chains and investments.


60
 
5.1
MACROECONOMIC INDICATORS


5.1.1
INTRODUCTION


5.1.2
GDP TRENDS AND FORECAST


5.1.3
TRENDS IN RAIL INFRASTRUCTURE MARKET


5.2
SUPPLY CHAIN ANALYSIS


5.3
ECOSYSTEM ANALYSIS


5.4
TRADE ANALYSIS


5.4.1
IMPORT SCENARIO (HS CODE 8604)


5.4.2
EXPORT SCENARIO (HS CODE 8604)


5.5
KEY CONFERENCES AND EVENTS, 2026–2027


5.6
TRENDS AND DISRUPTIONS IMPACTING CUSTOMER BUSINESS


5.7
INVESTMENT AND FUNDING SCENARIO


5.8
CASE STUDY ANALYSIS


ALSTOM AND SNCF RÉSEAU DEPLOY ARGOS DIGITAL


5.8.2
SIEMENS MODERNIZES NEW YORK CITY FULTON LIBERTY LINES WITH CBTC


5.8.3
HITACHI RAIL UPGRADES TORONTO SUBWAY LINE 2 WITH DIGITAL CBTC


5.8.4
ALSTOM DEPLOYS ETCS LEVEL 2 FOR QUEENSLAND RAIL NETWORK


SIEMENS MODERNIZES RAILWAY SIGNALING


5.8.6
INDIAN RAILWAYS MODERNIZES SIGNALING WITH ELECTRONIC INTERLOCKING AND KAVACH


VOSSLOH AND CORDEL INTEGRATE LIDAR AND AI FOR


6
TECHNOLOGICAL ADVANCEMENTS, AI-DRIVEN IMPACT, PATENTS, INNOVATIONS, AND FUTURE APPLICATIONS
AI-driven innovations revolutionize rail infrastructure with predictive maintenance and advanced monitoring technologies.


77
 
6.1
TECHNOLOGY ANALYSIS


6.1.1
KEY EMERGING TECHNOLOGIES


6.1.1.1
AUTONOMOUS TRACK INSPECTION


6.1.1.2
AI-BASED PREDICTIVE INFRASTRUCTURE MAINTENANCE


6.1.2
COMPLEMENTARY TECHNOLOGIES


6.1.2.1
LIDAR AND 3D RAILWAY ASSET MAPPING


6.1.2.2
FIBER OPTIC SENSING FOR TRACK AND STRUCTURAL MONITORING


6.1.3
ADJACENT TECHNOLOGIES


6.1.3.1
ADVANCED RAILWAY ELECTRIFICATION SYSTEMS


6.1.3.2
ENERGY STORAGE FOR RAILWAY INFRASTRUCTURE


6.2
TECHNOLOGY/PRODUCT ROADMAP


6.3
PATENT ANALYSIS


6.4
IMPACT OF AI ON RAIL INFRASTRUCTURE MARKET


6.4.1
TOP USE CASES AND MARKET POTENTIAL


BEST PRACTICES FOLLOWED BY MANUFACTURERS IN RAIL


CASE STUDIES RELATED TO AI IMPLEMENTATION IN RAIL


6.4.3.1
ALSTOM HEALTHHUB FOR AI-SUPPORTED INFRASTRUCTURE AND SIGNALING MAINTENANCE


6.4.3.2
NETWORK RAIL’S AI-BASED INSIGHT PLATFORM FOR PREDICTIVE TRACK MAINTENANCE


6.4.3.3
HITACHI RAIL’S HMAX AI PLATFORM FOR AUTOMATED INFRASTRUCTURE MONITORING


6.4.4
INTERCONNECTED ECOSYSTEM AND IMPACT ON MARKET PLAYERS


6.4.5
CLIENTS’ READINESS TO ADOPT AI-RAIL INFRASTRUCTURE


7
REGULATORY LANDSCAPE AND SUSTAINABILITY INITIATIVES
Discover how global regulations and sustainability initiatives drive modern, resilient rail infrastructure.


93
 
7.1
REGIONAL REGULATIONS AND COMPLIANCE


REGULATORY BODIES, GOVERNMENT AGENCIES,


7.1.1.1
ASIA PACIFIC


7.1.1.2
EUROPE


7.1.1.3
NORTH AMERICA


7.1.1.4
REST OF THE WORLD


7.2
INDUSTRY STANDARDS


7.2.1
ASIA PACIFIC


7.2.2
EUROPE


7.2.3
NORTH AMERICA


7.2.4
REST OF THE WORLD


7.3
SUSTAINABILITY INITIATIVES


7.3.1
LOW CARBON RAIL INFRASTRUCTURE


7.3.2
RESOURCE EFFICIENCY & CIRCULAR INFRASTRUCTURE


7.3.3
CLIMATE RESILIENCE & SUSTAINABLE ASSET MANAGEMENT


7.4
IMPACT OF REGULATORY POLICIES ON SUSTAINABILITY INITIATIVES


7.4.1
EUROPEAN UNION


7.4.2
US


7.4.3
CHINA


7.4.4
INDIA


7.5
SUSTAINABILITY GOVERNMENT SPENDING AND POLICY ANALYSIS


7.5.1
INFRASTRUCTURE MODERNIZATION PROGRAMS


8
CUSTOMER LANDSCAPE AND BUYER BEHAVIOR
Unlock the hidden dynamics of stakeholder influence and unmet needs in railway purchasing decisions.


108
 
8.1
DECISION-MAKING PROCESS


8.2
KEY STAKEHOLDERS INVOLVED IN BUYING PROCESS AND THEIR EVALUATION CRITERIA


8.2.1
KEY STAKEHOLDERS IN BUYING PROCESS


8.2.2
BUYING CRITERIA


8.3
ADOPTION BARRIERS AND INTERNAL CHALLENGES


8.4
UNMET NEEDS OF VARIOUS END-USE INDUSTRIES


9
RAIL INFRASTRUCTURE MARKET, BY INFRASTRUCTURE TYPE
Market Size & Growth Rate Forecast Analysis to 2033 in USD Million | 14 Data Tables


115
 
9.1
INTRODUCTION


9.2
TRACK INFRASTRUCTURE


9.2.1
TRACK INFRASTRUCTURE DEMAND DRIVEN BY HIGHER AXLE LOADS AND INCREASING PERFORMANCE REQUIREMENTS


9.2.2
RAIL TRACK


9.2.3
SLEEPERS


9.2.4
BALLAST


9.2.5
FASTENING SYSTEMS


9.2.6
TURNOUTS & CROSSINGS


9.2.7
TRACK BED


9.2.8
BALLASTLESS TRACK


9.3
RAIL ELECTRIFICATION


9.3.1
RAIL ELECTRIFICATION DEMAND DRIVEN BY NETWORK ELECTRIFICATION AND RENEWABLE ENERGY INTEGRATION


9.4
TRACTION POWER INFRASTRUCTURE


9.4.1
TRACTION POWER INFRASTRUCTURE DEMAND DRIVEN BY ELECTRIFICATION EXPANSION AND GRID MODERNIZATION


9.5
STATION INFRASTRUCTURE


9.5.1
STATION INFRASTRUCTURE DEMAND DRIVEN BY PASSENGER CAPACITY, ACCESSIBILITY, AND MULTIMODAL INTEGRATION


9.6
CIVIL INFRASTRUCTURE


9.6.1
CIVIL INFRASTRUCTURE DEMAND DRIVEN BY CLIMATE RESILIENCE AND STRUCTURAL UPGRADES


9.7
TRACKSIDE INFRASTRUCTURE


9.7.1
TRACKSIDE INFRASTRUCTURE DEMAND DRIVEN BY REPLACEMENT OF CONVENTIONAL SIGNALING WITH ADVANCED TRAIN CONTROL SYSTEMS


9.8
KEY PRIMARY INSIGHTS


10
RAIL INFRASTRUCTURE MARKET, BY INVESTMENT TYPE
Market Size & Growth Rate Forecast Analysis to 2033 in USD Million | 8 Data Tables


126
 
10.1
INTRODUCTION


10.2
NEW CONSTRUCTION


10.2.1
NEW RAIL INFRASTRUCTURE FOR NETWORK CAPACITY EXPANSION


10.3
UPGRADE & MODERNIZATION


10.3.1
AGING RAILWAY ASSETS DRIVING INFRASTRUCTURE MODERNIZATION


10.4
MAINTENANCE & RENEWAL


10.4.1
RAILWAY INFRASTRUCTURE RENEWAL AND ASSET REHABILITATION


10.5
KEY PRIMARY INSIGHTS


11
RAIL INFRASTRUCTURE MARKET, BY RAILWAY TYPE
Market Size & Growth Rate Forecast Analysis to 2033 in USD Million | 12 Data Tables


133
 
11.1
INTRODUCTION


11.2
MAINLINE RAIL


11.2.1
MAINLINE RAIL DEMAND DRIVEN BY CAPACITY EXPANSION AND NETWORK UPGRADES


11.3
HIGH-SPEED RAIL


11.3.1
HIGH-SPEED CORRIDOR EXPANSION DRIVES HIGHER INFRASTRUCTURE SPECIFICATIONS


11.4
URBAN RAIL/METRO


11.4.1
URBAN PASSENGER GROWTH DRIVES HIGH-CAPACITY METRO EXPANSION


11.5
REGIONAL & COMMUTER RAIL


11.5.1
REGIONAL AND COMMUTER RAIL DEMAND DRIVEN BY CAPACITY EXPANSION AND CORRIDOR UPGRADES


11.6
FREIGHT/HEAVY HAUL RAIL


11.6.1
FREIGHT AND HEAVY HAUL RAIL DEMAND DRIVEN BY DEDICATED CORRIDORS AND CAPACITY EXPANSION


11.7
KEY PRIMARY INSIGHTS


12
RAIL INFRASTRUCTURE MARKET, BY APPLICATION
Market Size & Growth Rate Forecast Analysis to 2033 in USD Million | 10 Data Tables


143
 
12.1
INTRODUCTION


12.2
AC ELECTRIFICATION


12.2.1
AC ELECTRIFICATION DEMAND DRIVEN BY HIGH-CAPACITY RAIL CORRIDORS AND TRACTION POWER UPGRADES


12.2.2
15 KV AC


12.2.3
25 KV AC


12.2.4
2 X 25 KV AC


12.3
DC ELECTRIFICATION


12.3.1
DC ELECTRIFICATION DEMAND DRIVEN BY EXPANDING METRO AND SUBURBAN RAIL NETWORKS


12.3.2
1.5 KV DC


12.3.3
3 KV DC


12.4
DUAL-SYSTEM ELECTRIFICATION


12.4.1
DUAL-SYSTEM ELECTRIFICATION FOR MULTI-VOLTAGE RAILWAY NETWORKS


12.5
THIRD-RAIL ELECTRIFICATION


12.5.1
INFRASTRUCTURE DEMAND FROM THIRD-RAIL ELECTRIFICATION RENEWAL


12.6
KEY PRIMARY INSIGHTS


13
RAIL INFRASTRUCTURE MARKET, BY REGION
Comprehensive coverage of 5 Regions with country-level deep-dive of 14 Countries | 42 Data Tables.


152
 
13.1
INTRODUCTION


13.2
ASIA PACIFIC


13.2.1
CHINA


13.2.1.1
INCREASING RAIL INVESTMENT IN CAPACITY, MAINTENANCE, AND DIGITAL CONTROL


13.2.2
JAPAN


13.2.2.1
STRENGTHENING RAIL INFRASTRUCTURE THROUGH RENEWAL AND DIGITAL CONTROL


13.2.3
SOUTH KOREA


13.2.3.1
COMBINING HIGH-SPEED EXPANSION WITH DIGITAL SIGNALING AND NETWORK MODERNIZATION


13.2.4
INDIA


13.2.4.1
SCALING DIGITAL TRAIN PROTECTION ACROSS RAIL NETWORK


13.2.5
REST OF ASIA PACIFIC


13.3
EUROPE


13.3.1
GERMANY


13.3.1.1
CORRIDOR MODERNIZATION DRIVING DEMAND FOR DIGITAL RAIL INFRASTRUCTURE


13.3.2
FRANCE


13.3.2.1
RAIL MODERNIZATION DRIVING FUTURE INFRASTRUCTURE DEMAND


13.3.3
UK


13.3.3.1
SHIFTING RAIL DEMAND TOWARD DIGITAL SIGNALING AND FREIGHT INFRASTRUCTURE


13.3.4
ITALY


13.3.4.1
ACCELERATING RAIL NETWORK MODERNIZATION AND ERTMS DEPLOYMENT


13.3.5
SPAIN


13.3.5.1
STRENGTHENING RAIL CAPACITY THROUGH MAJOR INFRASTRUCTURE PROJECTS


13.3.6
REST OF EUROPE


13.4
NORTH AMERICA


13.4.1
US


13.4.1.1
SHIFTING RAIL INFRASTRUCTURE INVESTMENT TOWARD MAJOR ASSET RENEWAL AND CAPACITY UPGRADES


13.4.2
CANADA


13.4.2.1
RAIL INFRASTRUCTURE EXPANSION FOCUSED ON FREIGHT CORRIDORS AND TRADE CONNECTIVITY


13.4.3
MEXICO


13.4.3.1
RAIL EXPANSION DRIVEN BY PASSENGER CORRIDORS AND DIGITAL RAILWAY INFRASTRUCTURE


13.5
REST OF THE WORLD


13.5.1
SOUTH AFRICA


13.5.1.1
EXPANDING RAIL CAPACITY THROUGH CORRIDOR RESTORATION, INFRASTRUCTURE REHABILITATION, AND OPEN-ACCESS REFORM


13.5.2
BRAZIL


13.5.2.1
PRIORITIZING EXISTING CORRIDOR MODERNIZATION


14
COMPETITIVE LANDSCAPE
Discover market leaders' winning strategies and emerging competitors shaping the industry's future.


179
 
14.1
OVERVIEW


14.2
KEY PLAYER COMPETITIVE STRATEGIES/RIGHT TO WIN, 2022–2026


14.3
MARKET SHARE ANALYSIS, 2025


14.4
REVENUE ANALYSIS, 2021–2025


14.5
BRAND/PRODUCT COMPARISON


14.5.1
STRATEGIC OEM BENCHMARKING


14.6
COMPANY VALUATION AND FINANCIAL METRICS


14.7
COMPANY EVALUATION MATRIX: KEY PLAYERS, 2025


14.7.1
STARS


14.7.2
EMERGING LEADERS


14.7.3
PERVASIVE PLAYERS


14.7.4
PARTICIPANTS


14.7.5
COMPANY FOOTPRINT: KEY PLAYERS, 2025


14.7.5.1
COMPANY FOOTPRINT


14.7.5.2
REGION FOOTPRINT


14.7.5.3
RAILWAY TYPE FOOTPRINT


14.7.5.4
INVESTMENT TYPE FOOTPRINT


14.8
COMPANY EVALUATION MATRIX: STARTUPS/SMES, 2025


14.8.1
PROGRESSIVE COMPANIES


14.8.2
RESPONSIVE COMPANIES


14.8.3
DYNAMIC COMPANIES


14.8.4
STARTING BLOCKS


14.8.5
COMPETITIVE BENCHMARKING: STARTUPS/SMES, 2025


14.8.5.1
DETAILED LIST OF KEY STARTUPS/SMES


14.8.5.2
COMPETITIVE BENCHMARKING OF KEY STARTUPS/SMES


14.9
COMPETITIVE SCENARIO


14.9.1
PRODUCT LAUNCHES


14.9.2
DEALS


14.9.3
EXPANSIONS


14.9.4
OTHER DEVELOPMENTS


15
COMPANY PROFILES
In-depth Company Profiles of Leading Market Players with detailed Business Overview, Product and Service Portfolio, Recent Developments, and Unique Analyst Perspective (MnM View)


198
 
15.1
KEY PLAYERS


15.1.1
CHINA RAILWAY GROUP LIMITED


15.1.1.1
BUSINESS OVERVIEW


15.1.1.2
PRODUCTS/SOLUTIONS/SERVICES OFFERED


15.1.1.3
RECENT DEVELOPMENTS


15.1.1.3.1
PRODUCT LAUNCHES/ENHANCEMENTS


15.1.1.3.2
DEALS


15.1.1.3.3
OTHER DEVELOPMENTS


15.1.1.4
MNM VIEW


15.1.1.4.1
KEY STRENGTHS


15.1.1.4.2
STRATEGIC CHOICES


15.1.1.4.3
WEAKNESSES AND COMPETITIVE THREATS


15.1.2
SIEMENS MOBILITY


15.1.3
CHINA RAILWAY CONSTRUCTION CORPORATION LIMITED


15.1.4
ALSTOM SA


15.1.5
CRRC CORPORATION LIMITED


15.1.6
HITACHI RAIL LTD.


15.1.7
WABTEC CORPORATION


15.1.8
STADLER RAIL AG


15.1.9
CONSTRUCCIONES Y AUXILIAR DE FERROCARRILES, S.A. (CAF)


15.1.10
HYUNDAI ROTEM COMPANY


15.1.11
VOSSLOH AG


15.1.12
KNORR-BREMSE AG


15.2
OTHER PLAYERS


15.2.1
COLAS RAIL


15.2.2
BALFOUR BEATTY


15.2.3
SYSTRA


15.2.4
MOTT MACDONALD


15.2.5
EGIS


15.2.6
VINCI


15.2.7
ATKINSRÉALIS


15.2.8
HARSCO RAIL


15.2.9
PLASSER & THEURER


15.2.10
VAE GROUP


15.2.11
SPENO INTERNATIONAL SA


15.2.12
BOUYGUES CONSTRUCTION


15.2.13
ACCIONA


16
RESEARCH METHODOLOGY


267
 
16.1
RESEARCH DATA


16.1.1
SECONDARY DATA


16.1.1.1
LIST OF SECONDARY SOURCES


16.1.1.2
KEY DATA FROM SECONDARY SOURCES


16.1.2
PRIMARY DATA


16.1.2.1
PRIMARY INTERVIEWS: DEMAND AND SUPPLY SIDES


16.1.2.2
BREAKDOWN OF PRIMARY INTERVIEWS


16.1.2.3
PRIMARY PARTICIPANTS


16.1.2.4
OBJECTIVES OF PRIMARY RESEARCH


16.2
MARKET SIZE ESTIMATION


16.2.1
TOP-DOWN APPROACH


16.3
DATA TRIANGULATION


16.4
FACTOR ANALYSIS


16.5
RESEARCH ASSUMPTIONS


16.6
RESEARCH LIMITATIONS


16.7
RISK ASSESSMENT


17
APPENDIX


280
 
17.1
DISCUSSION GUIDE


17.2
KNOWLEDGESTORE: MARKETSANDMARKETS’ SUBSCRIPTION PORTAL


17.3
CUSTOMIZATION OPTIONS


17.3.1
RAIL INFRASTRUCTURE MARKET, BY VEHICLE CLASS AT REGIONAL LEVEL


17.3.2
RAIL INFRASTRUCTURE MARKET, ADDITIONAL COUNTRIES (UP TO THREE)


17.3.3
PROFILING OF ADDITIONAL MARKET PLAYERS (UP TO FIVE)


17.4
RELATED REPORTS


17.5
AUTHOR DETAILS


LIST OF TABLES


TABLE 1
RAIL INFRASTRUCTURE MARKET DEFINITION, BY INFRASTRUCTURE TYPE


TABLE 2
RAIL INFRASTRUCTURE MARKET DEFINITION, BY RAILWAY TYPE


TABLE 3
RAIL INFRASTRUCTURE MARKET DEFINITION, BY INVESTMENT TYPE


TABLE 4
RAIL INFRASTRUCTURE MARKET DEFINITION, BY APPLICATION


TABLE 5
USD EXCHANGE RATE, 2022–2025


TABLE 6
CROSS-BORDER TRADE CORRIDOR INVESTMENTS DRIVING RAIL INFRASTRUCTURE DEMAND


TABLE 7
RAIL INFRASTRUCTURE INVESTMENTS TARGETING CAPACITY BY KEY COUNTRY


TABLE 8
DIGITAL ASSET INTELLIGENCE INVESTMENTS DRIVING PREDICTIVE RAILWAY INFRASTRUCTURE MANAGEMENT


TABLE 9
RAIL CORRIDOR DEVELOPMENTS AND ASSOCIATED INFRASTRUCTURE APPLICATIONS


TABLE 10
STRATEGIC MOVES BY TIER-1/2/3 PLAYERS


TABLE 11
GREENFIELD: RAIL INFRASTRUCTURE PROJECTS, BY COUNTRY


TABLE 12
BROWNFIELD MODERNIZATION: RAIL INFRASTRUCTURE PROJECTS, BY COUNTRY


TABLE 13
CAPACITY EXPANSION: RAIL INFRASTRUCTURE PROJECTS, BY COUNTRY


TABLE 14
RENEWAL AND REHABILITATION: RAIL INFRASTRUCTURE PROJECTS, BY COUNTRY


TABLE 15
GDP PERCENTAGE CHANGE, BY COUNTRY, 2022–2031


TABLE 16
ROLE OF COMPANIES IN ECOSYSTEM


TABLE 17
IMPORT DATA FOR HS CODE 8604-COMPLIANT PRODUCTS, BY COUNTRY, 2022–2025 (USD BILLION)


TABLE 18
EXPORT DATA FOR HS CODE 8604-COMPLIANT PRODUCTS, BY COUNTRY, 2022–2025 (USD BILLION)


TABLE 19
KEY CONFERENCES AND EVENTS, 2026–2027


TABLE 20
INVESTMENT AND FUNDING, 2023–2025


TABLE 21
TECHNOLOGY/PRODUCT ROADMAP


TABLE 22
SHORT TERM TECHNOLOGY ROADMAP, 2026 TO 2027


TABLE 23
MID TERM TECHNOLOGY ROADMAP, 2028 TO 2030


TABLE 24
LONG TERM TECHNOLOGY ROADMAP, 2031 TO 2033


TABLE 25
PATENT ANALYSIS, 2024–2026


TABLE 26
ASIA PACIFIC: LIST OF REGULATORY BODIES, GOVERNMENT AGENCIES, AND OTHER ORGANIZATIONS


TABLE 27
EUROPE: LIST OF REGULATORY BODIES, GOVERNMENT AGENCIES, AND OTHER ORGANIZATIONS


TABLE 28
NORTH AMERICA: LIST OF REGULATORY BODIES, GOVERNMENT AGENCIES, AND OTHER ORGANIZATIONS


TABLE 29
REST OF THE WORLD: LIST OF REGULATORY BODIES, GOVERNMENT AGENCIES, AND OTHER ORGANIZATIONS


TABLE 30
ASIA PACIFIC: INDUSTRY STANDARDS FOR RAILWAY INFRASTRUCTURE MARKET


TABLE 31
EUROPE: INDUSTRY STANDARDS FOR RAILWAY INFRASTRUCTURE MARKET


TABLE 32
NORTH AMERICA: INDUSTRY STANDARDS FOR RAILWAY INFRASTRUCTURE MARKET


TABLE 33
REST OF THE WORLD: INDUSTRY STANDARDS FOR RAILWAY INFRASTRUCTURE MARKET


TABLE 34
INFRASTRUCTURE MODERNIZATION PROGRAMS


TABLE 35
HIGH SPEED RAIL PROGRAMS


TABLE 36
URBAN RAIL INVESTMENT PROGRAMS


TABLE 37
RAILWAY ELECTRIFICATION TARGETS


TABLE 38
FREIGHT RAIL DEVELOPMENT PROGRAMS


TABLE 39
INFLUENCE OF STAKEHOLDERS ON BUYING PROCESS, BY RAIL TYPE


TABLE 40
KEY BUYING CRITERIA, BY TRAIN TYPE


TABLE 41
UNMET NEEDS IN RAILWAY SIGNALING MARKET, BY END-USE INDUSTRY


TABLE 42
RAIL INFRASTRUCTURE MARKET, BY INFRASTRUCTURE TYPE, 2022–2025 (USD MILLION)


TABLE 43
RAIL INFRASTRUCTURE MARKET, BY INFRASTRUCTURE TYPE, 2026–2033 (USD MILLION)


TABLE 44
TRACK INFRASTRUCTURE: RAIL INFRASTRUCTURE MARKET, BY REGION, 2022–2025 (USD MILLION)


TABLE 45
TRACK INFRASTRUCTURE: RAIL INFRASTRUCTURE MARKET, BY REGION, 2026–2033 (USD MILLION)


TABLE 46
RAIL ELECTRIFICATION: RAIL INFRASTRUCTURE MARKET, BY REGION, 2022–2025 (USD MILLION)


TABLE 47
RAIL ELECTRIFICATION: RAIL INFRASTRUCTURE MARKET, BY REGION, 2026–2033 (USD MILLION)


TABLE 48
TRACTION POWER INFRASTRUCTURE: RAIL INFRASTRUCTURE MARKET, BY REGION, 2022–2025 (USD MILLION)


TABLE 49
TRACTION POWER INFRASTRUCTURE: RAIL INFRASTRUCTURE MARKET, BY REGION, 2026–2033 (USD MILLION)


TABLE 50
STATION INFRASTRUCTURE: RAIL INFRASTRUCTURE MARKET, BY REGION, 2022–2025 (USD MILLION)


TABLE 51
STATION INFRASTRUCTURE: RAIL INFRASTRUCTURE MARKET, BY REGION, 2026–2033 (USD MILLION)


TABLE 52
CIVIL INFRASTRUCTURE: RAIL INFRASTRUCTURE MARKET, BY REGION, 2022–2025 (USD MILLION)


TABLE 53
CIVIL INFRASTRUCTURE: RAIL INFRASTRUCTURE MARKET, BY REGION, 2026–2033 (USD MILLION)


TABLE 54
TRACKSIDE INFRASTRUCTURE: RAIL INFRASTRUCTURE MARKET, BY REGION, 2022–2025 (USD MILLION)


TABLE 55
TRACKSIDE INFRASTRUCTURE: RAIL INFRASTRUCTURE MARKET, BY REGION, 2026–2033 (USD MILLION)


TABLE 56
RAIL INFRASTRUCTURE MARKET, BY INVESTMENT TYPE, 2022–2025 (USD MILLION)


TABLE 57
RAIL INFRASTRUCTURE MARKET, BY INVESTMENT TYPE, 2026–2033 (USD MILLION)


TABLE 58
NEW CONSTRUCTION: RAIL INFRASTRUCTURE MARKET, BY REGION, 2022–2025 (USD MILLION)


TABLE 59
NEW CONSTRUCTION: RAIL INFRASTRUCTURE MARKET, BY REGION, 2026–2033 (USD MILLION)


TABLE 60
UPGRADE & MODERNIZATION: RAIL INFRASTRUCTURE MARKET, BY REGION, 2022–2025 (USD MILLION)


TABLE 61
UPGRADE & MODERNIZATION: RAIL INFRASTRUCTURE MARKET, BY REGION, 2026–2033 (USD MILLION)


TABLE 62
MAINTENANCE & RENEWAL: RAIL INFRASTRUCTURE MARKET, BY REGION, 2022–2025 (USD MILLION)


TABLE 63
MAINTENANCE & RENEWAL: RAIL INFRASTRUCTURE MARKET, BY REGION, 2026–2033 (USD MILLION)


TABLE 64
RAIL INFRASTRUCTURE MARKET, BY RAILWAY TYPE, 2022–2025 (USD MILLION)


TABLE 65
RAIL INFRASTRUCTURE MARKET, BY TRAIN TYPE, 2026–2033 (USD MILLION)


TABLE 66
MAINLINE RAIL: RAIL INFRASTRUCTURE MARKET, BY REGION, 2022–2025 (USD MILLION)


TABLE 67
MAINLINE RAIL: RAIL INFRASTRUCTURE MARKET, BY REGION, 2026–2033 (USD MILLION)


TABLE 68
HIGH-SPEED RAIL: RAIL INFRASTRUCTURE MARKET, BY REGION, 2022–2025 (USD MILLION)


TABLE 69
HIGH-SPEED RAIL: RAIL INFRASTRUCTURE MARKET, BY REGION, 2026–2033 (USD MILLION)


TABLE 70
URBAN RAIL/METRO: RAIL INFRASTRUCTURE MARKET, BY REGION, 2022–2025 (USD MILLION)


TABLE 71
URBAN RAIL/METRO: RAIL INFRASTRUCTURE MARKET, BY REGION, 2026–2033 (USD MILLION)


TABLE 72
REGIONAL & COMMUTER RAIL: RAIL INFRASTRUCTURE MARKET, BY REGION, 2022–2025 (USD MILLION)


TABLE 73
REGIONAL & COMMUTER RAIL: RAIL INFRASTRUCTURE MARKET BY REGION, 2026–2033 (USD MILLION)


TABLE 74
FREIGHT/HEAVY HAUL RAIL: RAIL INFRASTRUCTURE MARKET, BY REGION, 2022–2025 (USD MILLION)


TABLE 75
FREIGHT/HEAVY HAUL RAIL: RAIL INFRASTRUCTURE MARKET, BY REGION, 2026–2033 (USD MILLION)


TABLE 76
RAIL INFRASTRUCTURE MARKET, BY APPLICATION, 2022–2025 (USD MILLION)


TABLE 77
RAIL INFRASTRUCTURE MARKET, BY APPLICATION, 2026–2033 (USD MILLION)


TABLE 78
AC ELECTRIFICATION: RAIL INFRASTRUCTURE MARKET, BY REGION, 2022–2025 (USD MILLION)


TABLE 79
AC ELECTRIFICATION: RAIL INFRASTRUCTURE MARKET, BY REGION, 2026–2033 (USD MILLION)


TABLE 80
DC ELECTRIFICATION: RAIL INFRASTRUCTURE MARKET, BY REGION, 2022–2025 (USD MILLION)


TABLE 81
DC ELECTRIFICATION: RAIL INFRASTRUCTURE MARKET, BY REGION, 2026–2033 (USD MILLION)


TABLE 82
DUAL-SYSTEM ELECTRIFICATION: RAIL INFRASTRUCTURE MARKET, BY REGION, 2022–2025 (USD MILLION)


TABLE 83
DUAL-SYSTEM ELECTRIFICATION: RAIL INFRASTRUCTURE MARKET, BY REGION, 2026–2033 (USD MILLION)


TABLE 84
THIRD-RAIL ELECTRIFICATION: RAIL INFRASTRUCTURE MARKET, BY REGION, 2022–2025 (USD MILLION)


TABLE 85
THIRD-RAIL ELECTRIFICATION: RAIL INFRASTRUCTURE MARKET, BY REGION, 2026–2033 (USD MILLION)


TABLE 86
RAIL INFRASTRUCTURE MARKET, BY REGION, 2022–2025 (USD MILLION)


TABLE 87
RAIL INFRASTRUCTURE MARKET, BY REGION, 2026–2033 (USD MILLION)


TABLE 88
ASIA PACIFIC: RAIL INFRASTRUCTURE MARKET, BY COUNTRY, 2022–2025 (USD MILLION)


TABLE 89
ASIA PACIFIC: RAIL INFRASTRUCTURE MARKET, BY COUNTRY, 2026–2033 (USD MILLION)


TABLE 90
CHINA: RAIL INFRASTRUCTURE MARKET, BY INVESTMENT TYPE, 2022–2025 (USD MILLION)


TABLE 91
CHINA: RAIL INFRASTRUCTURE MARKET, BY INVESTMENT TYPE, 2026–2033 (USD MILLION)


TABLE 92
JAPAN: RAIL INFRASTRUCTURE MARKET, BY INVESTMENT TYPE 2022–2025 (USD MILLION)


TABLE 93
JAPAN: RAIL INFRASTRUCTURE MARKET, BY INVESTMENT TYPE, 2026–2033 (USD MILLION)


TABLE 94
SOUTH KOREA: RAIL INFRASTRUCTURE MARKET, BY INVESTMENT TYPE, 2022–2025 (USD MILLION)


TABLE 95
SOUTH KOREA: RAIL INFRASTRUCTURE MARKET, BY INVESTMENT TYPE, 2026–2033 (USD MILLION)


TABLE 96
INDIA: RAIL INFRASTRUCTURE MARKET, BY INVESTMENT TYPE, 2022–2025 (USD MILLION)


TABLE 97
INDIA: RAIL INFRASTRUCTURE MARKET, BY INVESTMENT TYPE, 2026–2033 (USD MILLION)


TABLE 98
REST OF ASIA PACIFIC: RAIL INFRASTRUCTURE MARKET, BY INVESTMENT TYPE, 2022–2025 (USD MILLION)


TABLE 99
REST OF ASIA PACIFIC: RAIL INFRASTRUCTURE MARKET, BY INVESTMENT TYPE, 2026–2033 (USD MILLION)


TABLE 100
EUROPE: RAIL INFRASTRUCTURE MARKET, BY COUNTRY, 2022–2025 (USD MILLION)


TABLE 101
EUROPE: RAIL INFRASTRUCTURE MARKET, BY COUNTRY, 2026–2033 (USD MILLION)


TABLE 102
GERMANY: RAIL INFRASTRUCTURE MARKET, BY INVESTMENT TYPE, 2022–2025 (USD MILLION)


TABLE 103
GERMANY: RAIL INFRASTRUCTURE MARKET, BY INVESTMENT TYPE, 2026–2033 (USD MILLION)


TABLE 104
FRANCE: RAIL INFRASTRUCTURE MARKET, BY INVESTMENT TYPE, 2022–2025 (USD MILLION)


TABLE 105
FRANCE: RAIL INFRASTRUCTURE MARKET, BY INVESTMENT TYPE, 2026–2033 (USD MILLION)


TABLE 106
UK: RAIL INFRASTRUCTURE MARKET, BY INVESTMENT TYPE, 2022–2025 (USD MILLION)


TABLE 107
UK: RAIL INFRASTRUCTURE MARKET, BY INVESTMENT TYPE, 2026–2033 (USD MILLION)


TABLE 108
ITALY: RAIL INFRASTRUCTURE MARKET, BY INVESTMENT TYPE, 2022–2025 (USD MILLION)


TABLE 109
ITALY: RAIL INFRASTRUCTURE MARKET, BY INVESTMENT TYPE, 2026–2033 (USD MILLION)


TABLE 110
SPAIN: RAIL INFRASTRUCTURE MARKET, BY INVESTMENT TYPE, 2022–2025 (USD MILLION)


TABLE 111
SPAIN: RAIL INFRASTRUCTURE MARKET, BY INVESTMENT TYPE, 2026–2033 (USD MILLION)


TABLE 112
REST OF EUROPE: RAIL INFRASTRUCTURE MARKET, BY INVESTMENT TYPE, 2022–2025 (USD MILLION)


TABLE 113
REST OF EUROPE: RAIL INFRASTRUCTURE MARKET, BY INVESTMENT TYPE, 2026–2033 (USD MILLION)


TABLE 114
NORTH AMERICA: RAIL INFRASTRUCTURE MARKET, BY COUNTRY, 2022–2025 (USD MILLION)


TABLE 115
NORTH AMERICA: RAIL INFRASTRUCTURE MARKET, BY COUNTRY, 2026–2033 (USD MILLION)


TABLE 116
US: RAIL INFRASTRUCTURE MARKET, BY INVESTMENT TYPE, 2022–2025 (USD MILLION)


TABLE 117
US: RAIL INFRASTRUCTURE MARKET, BY INVESTMENT TYPE, 2026–2033 (USD MILLION)


TABLE 118
CANADA: RAIL INFRASTRUCTURE MARKET, BY INVESTMENT TYPE, 2022–2025 (USD MILLION)


TABLE 119
CANADA: RAIL INFRASTRUCTURE MARKET, BY INVESTMENT TYPE, 2026–2033 (USD MILLION)


TABLE 120
MEXICO: RAIL INFRASTRUCTURE MARKET, BY INVESTMENT TYPE, 2022–2025 (USD MILLION)


TABLE 121
MEXICO: RAIL INFRASTRUCTURE MARKET, BY INVESTMENT TYPE, 2026–2033 (USD MILLION)


TABLE 122
REST OF THE WORLD: RAIL INFRASTRUCTURE MARKET, BY COUNTRY, 2022–2025 (USD MILLION)


TABLE 123
REST OF THE WORLD: RAIL INFRASTRUCTURE MARKET, BY COUNTRY, 2026–2033 (USD MILLION)


TABLE 124
SOUTH AFRICA: RAIL INFRASTRUCTURE MARKET, BY INVESTMENT TYPE, 2022–2025 (USD MILLION)


TABLE 125
SOUTH AFRICA: RAIL INFRASTRUCTURE MARKET, BY INVESTMENT TYPE, 2026–2033 (USD MILLION)


TABLE 126
BRAZIL: RAIL INFRASTRUCTURE MARKET, BY INVESTMENT TYPE, 2022–2025 (USD MILLION)


TABLE 127
BRAZIL: RAIL INFRASTRUCTURE MARKET, BY INVESTMENT TYPE, 2026–2033 (USD MILLION)


TABLE 128
STRATEGIES ADOPTED BY KEY PLAYERS IN RAIL INFRASTRUCTURE MARKET, JANUARY 2022–AUGUST 2026


TABLE 129
RAIL INFRASTRUCTURE MARKET: DEGREE OF COMPETITION, 2025


TABLE 130
RAIL INFRASTRUCTURE MARKET: REGION FOOTPRINT


TABLE 131
RAIL INFRASTRUCTURE MARKET: RAILWAY TYPE FOOTPRINT


TABLE 132
RAIL INFRASTRUCTURE MARKET: INVESTMENT TYPE FOOTPRINT


TABLE 133
RAIL INFRASTRUCTURE MARKET: LIST OF KEY STARTUPS/SMES


TABLE 134
RAIL INFRASTRUCTURE MARKET: COMPETITIVE BENCHMARKING OF KEY STARTUPS/SMES (RAILWAY TYPE)


TABLE 135
RAIL INFRASTRUCTURE MARKET: COMPETITIVE BENCHMARKING OF KEY STARTUPS/SMES (INVESTMENT TYPE)


TABLE 136
RAIL INFRASTRUCTURE MARKET: COMPETITIVE BENCHMARKING OF KEY STARTUPS/SMES (REGION)


TABLE 137
RAIL INFRASTRUCTURE MARKET: PRODUCT LAUNCHES 2022–SEPTEMBER 2026


TABLE 138
RAIL INFRASTRUCTURE MARKET: DEALS, 2022–SEPTEMBER 2026


TABLE 139
RAIL INFRASTRUCTURE MARKET: EXPANSIONS, 2022–SEPTEMBER 2026


TABLE 140
RAIL INFRASTRUCTURE MARKET: OTHER DEVELOPMENTS, 2022–SEPTEMBER 2026


TABLE 141
CHINA RAILWAY GROUP LIMITED: COMPANY OVERVIEW


TABLE 142
CHINA RAILWAY GROUP LIMITED: PRODUCTS/SOLUTIONS/SERVICES OFFERED


TABLE 143
CHINA RAILWAY GROUP LIMITED: PRODUCT LAUNCHES/ENHANCEMENTS


TABLE 144
CHINA RAILWAY GROUP LIMITED: DEALS


TABLE 145
CHINA RAILWAY GROUP LIMITED: OTHER DEVELOPMENTS


TABLE 146
SIEMENS MOBILITY: COMPANY OVERVIEW


TABLE 147
SIEMENS MOBILITY: PRODUCTS/SOLUTIONS/SERVICES OFFERED


TABLE 148
SIEMENS MOBILITY: PRODUCT LAUNCHES/ENHANCEMENTS


TABLE 149
SIEMENS MOBILITY: EXPANSIONS


TABLE 150
SIEMENS MOBILITY: OTHER DEVELOPMENTS


TABLE 151
CHINA RAILWAY CONSTRUCTION CORPORATION LIMITED: COMPANY OVERVIEW


TABLE 152
CHINA RAILWAY CONSTRUCTION CORPORATION LIMITED: PRODUCTS/SOLUTIONS/SERVICES OFFERED


TABLE 153
CHINA RAILWAY CONSTRUCTION CORPORATION LIMITED: DEALS


TABLE 154
CHINA RAILWAY CONSTRUCTION CORPORATION LIMITED: EXPANSIONS


TABLE 155
CHINA RAILWAY CONSTRUCTION CORPORATION LIMITED: OTHER DEVELOPMENTS


TABLE 156
ALSTOM SA: COMPANY OVERVIEW


TABLE 157
ALSTOM SA: PRODUCTS/SOLUTIONS/SERVICES OFFERED


TABLE 158
ALSTOM SA: PRODUCT LAUNCHES/ENHANCEMENTS


TABLE 159
ALSTOM SA: DEALS


TABLE 160
ALSTOM SA: EXPANSIONS


TABLE 161
ALSTOM SA: OTHER DEVELOPMENTS


TABLE 162
CRRC CORPORATION LIMITED: COMPANY OVERVIEW


TABLE 163
CRRC CORPORATION LIMITED: PRODUCTS/SOLUTIONS/SERVICES OFFERED


TABLE 164
CRRC CORPORATION LIMITED: PRODUCT LAUNCHES/ENHANCEMENTS


TABLE 165
CRRC CORPORATION LIMITED: DEALS


TABLE 166
CRRC CORPORATION LIMITED: EXPANSIONS


TABLE 167
CRRC CORPORATION LIMITED: OTHER DEVELOPMENTS


TABLE 168
HITACHI RAIL LTD.: COMPANY OVERVIEW


TABLE 169
HITACHI RAIL LTD.: PRODUCTS/SOLUTIONS/SERVICES OFFERED


TABLE 170
HITACHI RAIL LTD.: PRODUCT LAUNCHES/ENHANCEMENTS


TABLE 171
HITACHI RAIL LTD.: DEALS


TABLE 172
HITACHI RAIL LTD.: EXPANSIONS


TABLE 173
WABTEC CORPORATION: COMPANY OVERVIEW


TABLE 174
WABTEC CORPORATION: PRODUCTS/SOLUTIONS/SERVICES OFFERED


TABLE 175
WABTEC CORPORATION: DEALS


TABLE 176
WABTEC CORPORATION: EXPANSIONS


TABLE 177
WABTEC CORPORATION: OTHER DEVELOPMENTS


TABLE 178
STADLER RAIL AG: COMPANY OVERVIEW


TABLE 179
STADLER RAIL AG: PRODUCTS/SOLUTIONS/SERVICES OFFERED


TABLE 180
STADLER RAIL AG.: PRODUCT LAUNCHES/ENHANCEMENTS


TABLE 181
STADLER RAIL AG: DEALS


TABLE 182
STADLER RAIL AG: EXPANSIONS


TABLE 183
STADLER RAIL AG: OTHER DEVELOPMENTS


TABLE 184
CONSTRUCCIONES Y AUXILIAR DE FERROCARRILES, S.A.: COMPANY OVERVIEW


TABLE 185
CONSTRUCCIONES Y AUXILIAR DE FERROCARRILES, S.A.: PRODUCTS/SOLUTIONS/SERVICES OFFERED


TABLE 186
CONSTRUCCIONES Y AUXILIAR DE FERROCARRILES, S.A.: PRODUCT LAUNCHES/ENHANCEMENTS


TABLE 187
CONSTRUCCIONES Y AUXILIAR DE FERROCARRILES, S.A.: DEALS


TABLE 188
CONSTRUCCIONES Y AUXILIAR DE FERROCARRILES, S.A.: EXPANSIONS


TABLE 189
CONSTRUCCIONES Y AUXILIAR DE FERROCARRILES, S.A.: OTHER DEVELOPMENTS


TABLE 190
HYUNDAI ROTEM COMPANY: COMPANY OVERVIEW


TABLE 191
HYUNDAI ROTEM COMPANY: PRODUCTS/SOLUTIONS/SERVICES OFFERED


TABLE 192
HYUNDAI ROTEM COMPANY: PRODUCT LAUNCHES/ENHANCEMENTS


TABLE 193
HYUNDAI ROTEM COMPANY: DEALS


TABLE 194
HYUNDAI ROTEM COMPANY: EXPANSIONS


TABLE 195
HYUNDAI ROTEM COMPANY: OTHER DEVELOPMENTS


TABLE 196
VOSSLOH AG: COMPANY OVERVIEW


TABLE 197
VOSSLOH AG: PRODUCTS/SOLUTIONS/SERVICES OFFERED


TABLE 198
VOSSLOH AG: PRODUCT LAUNCHES/ENHANCEMENTS


TABLE 199
VOSSLOH AG: DEALS


TABLE 200
VOSSLOH AG: EXPANSIONS


TABLE 201
VOSSLOH AG: OTHER DEVELOPMENTS


TABLE 202
KNORR-BREMSE AG: COMPANY OVERVIEW


TABLE 203
KNORR-BREMSE AG: PRODUCTS/SOLUTIONS/SERVICES OFFERED


TABLE 204
KNORR-BREMSE AG: PRODUCT LAUNCHES/ENHANCEMENTS


TABLE 205
KNORR-BREMSE AG DEALS


TABLE 206
KNORR-BREMSE AG: EXPANSIONS


TABLE 207
KNORR-BREMSE AG: OTHER DEVELOPMENTS


TABLE 208
COLAS RAIL: COMPANY OVERVIEW


TABLE 209
BALFOUR BEATTY: COMPANY OVERVIEW


TABLE 210
SYSTRA: COMPANY OVERVIEW


TABLE 211
MOTT MACDONALD: COMPANY OVERVIEW


TABLE 212
EGIS: COMPANY OVERVIEW


TABLE 213
VINCI: COMPANY OVERVIEW


TABLE 214
ATKINSRÉALIS: COMPANY OVERVIEW


TABLE 215
HARSCO RAIL: COMPANY OVERVIEW


TABLE 216
PLASSER & THEURER: COMPANY OVERVIEW


TABLE 217
VAE GROUP: COMPANY OVERVIEW


TABLE 218
SPENO INTERNATIONAL SA: COMPANY OVERVIEW


TABLE 219
BOUYGUES CONSTRUCTION: COMPANY OVERVIEW


TABLE 220
ACCIONA: COMPANY OVERVIEW


LIST OF FIGURES


FIGURE 1
RAIL INFRASTRUCTURE MARKET SEGMENTATION


FIGURE 2
MARKET SCENARIO


FIGURE 3
RAIL INFRASTRUCTURE MARKET, 2022–2033


FIGURE 4
MAJOR STRATEGIES ADOPTED BY KEY PLAYERS IN RAIL INFRASTRUCTURE MARKET, 2022–2026


FIGURE 5
DISRUPTIONS INFLUENCING GROWTH OF RAIL INFRASTRUCTURE MARKET


FIGURE 6
HIGH-GROWTH SEGMENTS IN RAIL INFRASTRUCTURE MARKET, 2026–2033


FIGURE 7
ASIA PACIFIC TO LEAD MARKET DURING FORECAST PERIOD


FIGURE 8
DIGITAL SIGNALING AND SMART INFRASTRUCTURE TO ACCELERATE MARKET GROWTH


FIGURE 9
ASIA PACIFIC TO BE FASTEST-GROWING MARKET DURING FORECAST PERIOD


FIGURE 10
HIGH-SPEED RAIL SEGMENT TO EXHIBIT FASTEST GROWTH DURING FORECAST PERIOD


FIGURE 11
NEW CONSTRUCTION SEGMENT TO LEAD MARKET DURING FORECAST PERIOD


FIGURE 12
RAIL ELECTRIFICATION SEGMENT TO EXHIBIT HIGHEST GROWTH RATE DURING FORECAST PERIOD


FIGURE 13
AC ELECTRIFICATION SEGMENT TO SURPASS OTHER SEGMENTS DURING FORECAST PERIOD


FIGURE 14
RAIL INFRASTRUCTURE MARKET: DRIVERS, RESTRAINTS, OPPORTUNITIES, AND CHALLENGES


FIGURE 15
NUMBER OF RAIL PROJECTS ACROSS KEY COUNTRIES


FIGURE 16
SUPPLY CHAIN ANALYSIS


FIGURE 17
ECOSYSTEM ANALYSIS


FIGURE 18
IMPORT DATA FOR HS CODE 8604-COMPLIANT PRODUCTS, BY COUNTRY, 2022–2025 (USD BILLION)


FIGURE 19
EXPORT DATA FOR HS CODE 8604-COMPLIANT PRODUCTS, BY COUNTRY, 2022–2025 (USD BILLION)


FIGURE 20
TRENDS AND DISRUPTIONS IMPACTING CUSTOMER BUSINESS


FIGURE 21
INVESTMENT AND FUNDING SCENARIO, 2023–2025


FIGURE 22
PATENT ANALYSIS, 2016–2026


FIGURE 23
INFLUENCE OF STAKEHOLDERS ON BUYING PROCESS, BY RAIL TYPE


FIGURE 24
KEY BUYING CRITERIA, BY TRAIN TYPE


RAIL INFRASTRUCTURE MARKET, BY INFRASTRUCTURE TYPE,


2026
VS. 2033 (USD MILLION)


116
 
RAIL INFRASTRUCTURE MARKET, BY INVESTMENT TYPE,


2026
VS. 2033 (USD MILLION)


127
 
RAIL INFRASTRUCTURE MARKET, BY RAILWAY TYPE,


2026
VS. 2033 (USD MILLION)


134
FIGURE 28
RAIL INFRASTRUCTURE MARKET, BY APPLICATION, 2026 VS. 2033 (USD MILLION)


FIGURE 29
RAIL INFRASTRUCTURE MARKET, BY REGION, 2026 VS. 2033 (USD MILLION)


FIGURE 30
ASIA PACIFIC: RAIL INFRASTRUCTURE MARKET SNAPSHOT


EUROPE: RAIL INFRASTRUCTURE MARKET, BY COUNTRY,


2026
VS. 2033 (USD MILLION)


162
FIGURE 32
NORTH AMERICA: RAIL INFRASTRUCTURE MARKET SNAPSHOT


REST OF THE WORLD: RAIL INFRASTRUCTURE MARKET, BY COUNTRY,


2026
VS. 2033 (USD MILLION)


176
FIGURE 34
SHARE ANALYSIS OF KEY PLAYERS IN RAIL INFRASTRUCTURE MARKET, 2025


FIGURE 35
REVENUE ANALYSIS OF KEY PLAYERS IN RAIL INFRASTRUCTURE MARKET, 2021–2025 (USD BILLION)


FIGURE 36
STRATEGIC OEM BENCHMARKING BASED ON TECHNOLOGY


FIGURE 37
COMPANY VALUATION OF KEY SOLUTION PROVIDERS


FIGURE 38
FINANCIAL METRICS OF KEY SOLUTION PROVIDERS


FIGURE 39
RAIL INFRASTRUCTURE MARKET: COMPANY EVALUATION MATRIX (KEY PLAYERS), 2025


FIGURE 40
RAIL INFRASTRUCTURE MARKET: COMPANY FOOTPRINT


FIGURE 41
RAIL INFRASTRUCTURE MARKET: COMPANY EVALUATION MATRIX (STARTUPS/SMES), 2025


FIGURE 42
CHINA RAILWAY GROUP LIMITED: COMPANY SNAPSHOT


FIGURE 43
SIEMENS MOBILITY: COMPANY SNAPSHOT


FIGURE 44
CHINA RAILWAY CONSTRUCTION CORPORATION LIMITED: COMPANY SNAPSHOT


FIGURE 45
ALSTOM SA: COMPANY SNAPSHOT


FIGURE 46
CRRC CORPORATION LIMITED: COMPANY SNAPSHOT


FIGURE 47
HITACHI RAIL LTD.: COMPANY SNAPSHOT


FIGURE 48
WABTEC CORPORATION: COMPANY SNAPSHOT


FIGURE 49
STADLER RAIL AG: COMPANY SNAPSHOT


FIGURE 50
CONSTRUCCIONES Y AUXILIAR DE FERROCARRILES, S.A.: COMPANY SNAPSHOT


FIGURE 51
HYUNDAI ROTEM COMPANY: COMPANY SNAPSHOT


FIGURE 52
VOSSLOH AG: COMPANY SNAPSHOT


FIGURE 53
KNORR-BREMSE AG: COMPANY SNAPSHOT


FIGURE 54
RESEARCH DESIGN


FIGURE 55
RESEARCH DESIGN MODEL


FIGURE 56
TOP-DOWN APPROACH


FIGURE 57
DATA TRIANGULATION


FIGURE 58
GROWTH PROJECTIONS FROM DEMAND-SIDE DRIVERS


FIGURE 59
DEMAND- AND SUPPLY-SIDE FACTOR ANALYSIS


Methodology

The study involved four major activities to estimate the current size of the Rail Infrastructure Market. Exhaustive secondary research was conducted to collect information on the market, the peer market, and the parent market. The next step was to validate these findings, assumptions, and sizing with industry experts across value chains through primary research. A top-down approach was employed to estimate the total market size. Thereafter, market breakdown and data triangulation processes were used to estimate the market size of segments and subsegments.

Secondary Research

Secondary sources for this research study included Rail Infrastructure Industry organizations; corporate filings such as annual reports, investor presentations, and financial statements; trade and business whitepapers and databases; and articles from recognized associations and government publishing sources. Secondary data were collected and analyzed to determine the overall market size, which was further validated by primary research.

Primary Research

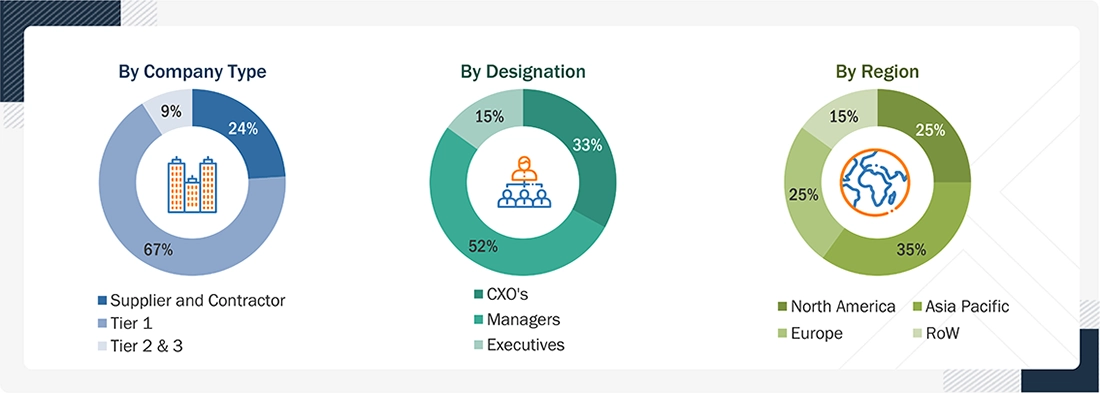
After gaining an understanding of the market through secondary research, we conducted extensive primary research. We interviewed market experts from demand- and supply-side OEMs (in terms of component supply), country-level government and trade associations, and component manufacturers across three major regions: Asia Pacific, Europe, and North America. Approximately 25% of the interviews were conducted with demand-side participants, and 75% with supply-side participants. We collected primary data through questionnaires, emails, LinkedIn, and telephone interviews. To provide a holistic perspective, we interviewed representatives from various departments within organizations, including sales, operations, and administration.

Brief sessions with highly experienced independent consultants were conducted to reinforce findings from primary research after interacting with industry experts. This, along with the in-house subject matter experts’ opinions, led to the findings described in the remainder of this report.

In the primary research process, interviews with various primary sources from the supply and demand sides were conducted to gather qualitative and quantitative information for the report. The primary sources from the supply side included industry experts, such as Vice Presidents (VPs), marketing directors, technology and innovation directors, and other key executives from various companies and organizations. The primary sources from the demand side included end users, such as Chief Information Officers (CIOs), consultants, service professionals, technicians and technologists, and managers at public and investor-owned utilities.
Rail Infrastructure Market 
 Size, and Share

To know about the assumptions considered for the study, download the pdf brochure

Market Size Estimation

The top-down approach has been used to estimate and validate the size of the global railway infrastructure market by value. This approach identifies railway infrastructure expenditure across key regions and countries based on investment in new construction, infrastructure modernization, and maintenance and renewal.

Using the top-down approach, the railway infrastructure market has been segmented into key investment types, namely new construction, upgradation & modernization, and maintenance & renewal. Market size by value has been derived at the regional and country levels for each segment using this method. The total railway infrastructure expenditure has been multiplied by the penetration breakdown percentage of these segments at the regional and country levels, considering railway type, infrastructure type, and application.

Rail Infrastructure Market Top Down and Bottom Up Approach

Data Triangulation

After determining the overall market size using the market size estimation processes explained above, the market was segmented into several segments and subsegments. To complete the overall market engineering process and arrive at the exact statistics for each market segment and subsegment, data triangulation and market breakdown procedures were employed wherever applicable. The data was triangulated by analyzing various factors and trends from both the demand and supply sides.

Market Definition

Rail infrastructure comprises the physical and technical systems that support rail transportation, including tracks, bridges, tunnels, stations, signaling, electrification, and trackside systems. It enables safe, reliable, and efficient movement of passengers and freight across mainline, high-speed, urban, regional, and freight rail networks. Rail infrastructure supports network expansion, increased train capacity, faster operations, and improved connectivity. It also incorporates digital signaling, electrification, and automated monitoring technologies to enhance safety, operational efficiency, and network performance.

Key Stakeholders

  • Government and Transport Authorities
  • Railway Operators
  • Rail Infrastructure Suppliers and OEMs
  • Engineering and Construction Contractors
  • Government departments
  • Passengers and Freight Customers
  • Transit Agencies

Report Objectives

  • To analyze and forecast the rail infrastructure market in terms of value (USD million) from 2026 to 2033
  • To segment the rail infrastructure market by infrastructure type, by railway type, by investment type, by application, and region
  • To segment and forecast the size of the rail infrastructure market in terms of value, by infrastructure type (track infrastructure, rail electrification, traction power infrastructure, traction power infrastructure, civil infrastructure, trackside infrastructure)
  • To segment and forecast the size of the rail infrastructure market in terms of value, by motor power, by railway type (mainline rail, high-speed rail, urban rail/metro, regional & commuter rail, freight/heavy-haul rail)
  • To segment and forecast the size of the rail infrastructure market in terms of value, by investment type (new construction, upgradation & modernization, maintenance & renewal, key primary insights)
  • To segment and forecast the size of the rail infrastructure market in terms of value, by application (AC electrification, DC electrification, dual-system electrification, third-rail electrification)
  • To segment and forecast the size of the rail infrastructure market in terms of value, by region (Asia Pacific, Europe, and North America, Rest of the world)
  • To provide detailed information about the factors influencing market growth (drivers, challenges, restraints, and opportunities)
  • To strategically analyze the market for individual growth trends, prospects, and contributions to the total market
  • To study the following with respect to the market:
  • Supply Chain Analysis
  • Ecosystem Analysis
  • Technology Analysis
  • Trade Analysis
  • Case Study Analysis
  • Patent Analysis
  • Tariff and Regulatory Landscape
  • Key Stakeholders and Buying Criteria
  • Impact of AI on Railway Infrastructure Market
  • Regulatory Landscape
  • Key Conferences and Events
  • Investment and Funding Scenario
  • To strategically profile the key players and comprehensively analyze their market share and core competencies
  • To analyze the opportunities for stakeholders and the competitive landscape for market leaders
  • To analyze competitive developments, such as deals, product launches/developments, expansions, and other activities undertaken by the key industry participants

Available customizations:

With the given market data, MarketsandMarkets offers customizations in line with company-specific needs.

  • Rail Infrastructure market, by railway type at country level
  • Profiling of additional market players (up to five)

 

Personalize This Research

  • Triangulate with your Own Data
  • Get Data as per your Format and Definition
  • Gain a Deeper Dive on a Specific Application, Geography, Customer or Competitor
  • Any level of Personalization
Request A Free Customisation

Let Us Help You

  • What are the Known and Unknown Adjacencies Impacting the Rail Infrastructure Market
  • What will your New Revenue Sources be?
  • Who will be your Top Customer; what will make them switch?
  • Defend your Market Share or Win Competitors
  • Get a Scorecard for Target Partners
Customized Workshop Request

Custom Market Research Services

We Will Customise The Research For You, In Case The Report Listed Above Does Not Meet With Your Requirements

Get 10% Free Customisation

TESTIMONIALS

Growth opportunities and latent adjacency in Rail Infrastructure Market

DMCA.com Protection Status
popup img