[175 Pages Report] The global recombinant proteins market is projected to reach USD 1.7 billion by 2026 from USD 1.0 billion in 2021, at a CAGR of 9.8% during the forecast period. Growth in the recombinant proteins market is primarily driven by factors such as increasing government investments and R&D expenditure in pharmaceutical & biotechnology companies, growing industry academia collaborations, and the patent expiry of biologic products.
Emerging markets in Asian countries and the rising focus on personalized medicine & protein therapeutics are other factors expected to offer strong growth opportunities for players in the recombinant proteins market. In contrast, the declining cost of recombinant proteins may restrict market growth to a certain extent.
To know about the assumptions considered for the study, Request for Free Sample Report
The COVID-19 outbreak has boosted research activity due to efforts to understand the dynamics of the infection. We estimate that the major share of recombinant protein manufacturing, along with personalized medicine, will grow at a stable pace in the next five years. Due to the increase in research activity, both the availability of funding for research and the demand & manufacturing of recombinant proteins (especially immune response proteins related to COVID-19) are expected to grow. The COVID-19 has significantly impacted the life science industry. The companies with COVID- 19 specific products have been impacted positively. However, there was a major disruption in research & development activities because of the laboratory closures and the interruption of clinical studies. This, in turn, has reduced the demand for products other than those related to COVID-19.
The R&D sector has conventionally remained capital-intensive due to long development periods and approval cycles. R&D investments occupy a prime position in global expenditure. Governments recognize R&D as a crucial aspect of a nations progress, international competitiveness, and public benefit. Due to this, R&D expenditure and funding have witnessed a steady increase over the years. According to the 2019 Global R&D Funding Forecast, the global life science R&D spending is estimated to grow by 3.6% to reach USD 2.3 trillion by 2019. While the industry majorly funds R&D expenditure, academia is also central to funding, since research papers originate from academic authors.
Price erosion typically happens when a large number of players enter a niche market and offer similar products without any differentiation. In this case, the price of such products is observed to decline continuously, which then slows market growth. Advancements in the field of recombinant protein production have changed the earlier trend, making the yield much higher and the cost much lower, which permits the production of such proteins on an industrial scale and opening the door for the treatment of multiple diseases and disorders.
The Asia Pacific region is expected to offer potential growth opportunities to market players in the coming years, due to the diversified healthcare markets in this region, the growing incidence of infectious and chronic disorders, and increasing R&D initiatives to develop innovative proteomic and genomic techniques. Additionally, the growth of the aging population, increasing income levels, developments in healthcare infrastructure, increasing healthcare expenditure, and the low-cost manufacturing advantage offered by emerging APAC countries are expected to encourage market players to invest in the region. Regulatory policies in Asia are also more adaptive and business-friendly, which serves to attract the attention of large corporations already facing increasing competition in mature markets.
Based on product, the recombinant proteins market is classified into growth factors and chemokines, structural proteins, kinase proteins, regulatory proteins, membrane proteins, recombinant metabolic enzymes, adhesion molecules and receptors, immune response proteins, and other recombinant proteins. Growth factors and chemokines commanded the largest share of the recombinant proteins market in 2020. The large share of the growth factors and chemokines segment can be attributed to its use in various research areas such as chemotaxis, neurobiology, wound healing, immunology, transplantation, apoptosis, cancer, HIV/AIDS, COVID-19, cell culture, and stem cell research.
Based on type, the drug discovery & development market is segmented into biologics, vaccines, and cell & gene therapy. Biologics accounted for the largest share of the drug discovery & development application for the recombinant proteins market and is also extecpted to witness the highest CAGR during the forecast period. This is attributed to the factors such as the increasing prevalence & incidence of target diseases, increasing research & development, and the strong development pipeline for recombinant protein-based biologics.
To know about the assumptions considered for the study, download the pdf brochure
The recombinant proteins is segmented into North America, Europe, the Asia Pacific, and the Rest of the World. In 2019, North America was the largest regional segment of the overall market, followed by Europe. The large share of North America in the global market is attributed to the rising incidences of chronic & infectious diseases, increasing R&D spending, increasing research activities, favorable government funding, and the presence of key players in this region.
The prominent players operating in this market include Thermo Fisher Scientific, Inc. (US), R&D Systems (US), Abcam plc (UK), Merck KGaA (Germany), and Proteintech Group, Inc. (US)
Report Metric |
Details |
Market size available for years |
20192026 |
Base year considered |
2019 |
Forecast period |
20212026 |
Forecast units |
Value (USD Billion) |
Segments covered |
Product, Application, End User and Region |
Geographies covered |
North America, Europe, Asia Pacific, and the Rest of the World |
Companies covered |
Thermo Fisher Scientific, Inc. (US), Miltenyi Biotech (Germany), Sino Biological Inc. (China), Merck KGaA (Germany), Abcam plc (UK), Biolegend (US), Bio-Rad Laboratories, Inc. (US), GenScript Biotech Corporation (China), Enzo Life Sciences, Inc. (US), BPS Bioscience, Inc. (US), PeproTech, Inc. (US), Proteintech Group, Inc. (US), Abnova Corporation (Taiwan), R&D Systems (US), STEMCELL Technologies Inc (Canada), RayBiotech Inc (US), CellGenix GmbH (Germany), ACROBiosystems (US), ProSpec-TechnoGene Ltd. (Israel), Neuromics (US), RICHCORE LIFESCIENCES PVT LTD (India), Icosagen AS (US), ProteoGenix (France), United States Biological (US), StressMarq Biosciences Inc (Canada), and Aviva Systems Biology Corporation (US). |
This report categorizes the recombinant proteins market into the following segments and subsegments:
What is the impact of COVID-19 on the recombinant proteins market?
The COVID-19 pandemic has a mixed impact on the recombinant proteins market. The shift in demand towards relevant technology has forced key players operating in the market to strategize their manufacturing capabilities, focus on new product development, and provide optimum supply chain strategies concentrated towards COVID-19 essentials. The COVID-19 has significantly impacted the life science industry. The companies with COVID- 19 specific products have been impacted positively. However, there was a major disruption in research & development activities because of the laboratory closures and the interruption of clinical studies. This, in turn, has reduced the demand for products other than those related to COVID-19.
Who are the key players in the recombinant proteins market?
The prominent players operating in this market include Thermo Fisher Scientific, Inc. (US), R&D Systems (US), Merck KGaA (Germany), PeproTech, Inc. (US), Miltenyi Biotech (Germany), Sino Biological Inc. (China), Abcam plc (UK), GenScript Biotech Corporation (China), Biolegend (US), and STEMCELL Technologies Inc (Canada).
Which product dominates in the recombinant proteins market?
The Growth Factors and Chemokines segment accounted for the largest share of the market in 2020. Growth factors and chemokines are used in various research areas such as chemotaxis, neurobiology, wound healing, immunology, transplantation, apoptosis, cancer, HIV/AIDS, COVID-19, cell culture, and stem cell research
What factors are driving the recombinant proteins market?
Market growth is largely driven by factors such as increasing government investments and R&D expenditure in pharmaceutical & biotechnology companies, growing industry-academia collaborations, and the patent expiry of biologics.
What is the market for global recombinant proteins?
The global recombinant proteins market is projected to reach USD 1,705.9 million by 2026 from USD 1,070.9 million in 2021, at a CAGR of 9.8% during the forecast period. .
To speak to our analyst for a discussion on the above findings, click Speak to Analyst
TABLE OF CONTENTS
1 INTRODUCTION (Page No. - 22)
1.1 OBJECTIVES OF THE STUDY
1.2 MARKET DEFINITION
1.2.1 INCLUSION & EXCLUSIONS
1.3 MARKET SCOPE
FIGURE 1 RECOMBINANT PROTEINS MARKET
1.3.1 YEARS CONSIDERED FOR THE STUDY
1.4 CURRENCY
1.5 LIMITATIONS
1.6 STAKEHOLDERS
2 RESEARCH METHODOLOGY (Page No. - 26)
2.1 RESEARCH DATA
FIGURE 2 RESEARCH DESIGN
2.2 SECONDARY DATA
2.2.1 SECONDARY SOURCES
2.3 PRIMARY DATA
2.3.1 KEY DATA FROM PRIMARY SOURCES
FIGURE 3 BREAKDOWN OF PRIMARY INTERVIEWS: BY COMPANY TYPE, DESIGNATION, AND REGION
2.4 MARKET SIZE ESTIMATION
2.4.1 BOTTOM-UP APPROACH
FIGURE 4 MARKET SIZE ESTIMATION: BOTTOM-UP APPROACH
2.4.2 TOP-DOWN APPROACH
FIGURE 5 MARKET SIZE ESTIMATION: TOP-DOWN APPROACH
2.4.3 GROWTH FORECAST
2.5 MARKET BREAKDOWN AND DATA TRIANGULATION
FIGURE 6 DATA TRIANGULATION METHODOLOGY
2.6 ASSUMPTIONS FOR THE STUDY
3 EXECUTIVE SUMMARY (Page No. - 33)
FIGURE 7 RECOMBINANT PROTEINS MARKET, BY PRODUCT, 2021 VS. 2026 (USD MILLION)
FIGURE 8 RECOMBINANT PROTEINS MARKET, BY APPLICATION, 2021 VS. 2026 (USD MILLION)
FIGURE 9 RECOMBINANT PROTEINS MARKET FOR DRUG DISCOVERY & DEVELOPMENT APPLICATION, BY TYPE, 20212026 (USD MILLION)
FIGURE 10 RECOMBINANT PROTEINS MARKET, BY END USER, 2021 VS. 2026 (USD MILLION)
FIGURE 11 GEOGRAPHIC SNAPSHOT OF THE GLOBAL RECOMBINANT PROTEINS MARKET
4 PREMIUM INSIGHTS (Page No. - 39)
4.1 RECOMBINANT PROTEINS MARKET OVERVIEW
FIGURE 12 INCREASING GOVERNMENT INVESTMENTS & THE RISING FOCUS ON PERSONALIZED MEDICINE TO DRIVE MARKET GROWTH DURING THE FORECAST PERIOD
4.2 ASIA PACIFIC: RECOMBINANT PROTEINS MARKET, BY APPLICATION & BY COUNTRY (2021)
FIGURE 13 THE DRUG DISCOVERY & DEVELOPMENT SEGMENT IS EXPECTED TO ACCOUNT FOR THE LARGEST SHARE, BY APPLICATION, FOR 2021
4.3 RECOMBINANT PROTEINS MARKET, BY END USER, 2021-2026
FIGURE 14 PHARMACEUTICAL & BIOPHARMACEUTICAL COMPANIES ARE EXPECTED TO BE THE LARGEST END USERS OF RECOMBINANT PROTEINS DURING THE FORECAST PERIOD
4.4 RECOMBINANT PROTEINS MARKET: GEOGRAPHIC SNAPSHOT
FIGURE 15 CHINA TO REGISTER THE HIGHEST GROWTH DURING THE FORECAST PERIOD
5 MARKET OVERVIEW (Page No. - 43)
5.1 INTRODUCTION
5.2 MARKET DYNAMICS
FIGURE 16 RECOMBINANT PROTEINS MARKET: DRIVERS, RESTRAINTS, AND OPPORTUNITIES
5.2.1 DRIVERS
5.2.1.1 Rising government funding and increasing R&D expenditure in pharmaceutical & biotechnology companies
TABLE 1 GOVERNMENT FUNDING FOR LIFE SCIENCE RESEARCH (2017-2020)
5.2.1.2 The high prevalence of infectious & chronic diseases
5.2.1.3 Growing industry-academia collaborations
5.2.1.4 Patent expiry of biologics
5.2.2 RESTRAINTS
5.2.2.1 The declining cost of recombinant proteins
5.2.3 OPPORTUNITIES
5.2.3.1 Emerging economies
5.2.3.2 Rising focus on personalized medicine and protein therapeutics
TABLE 2 COMMERCIALIZED RECOMBINANT PROTEINS USED IN MEDICINE
5.2.3.3 Increasing focus on biomarker discovery
5.2.4 COVID IMPACT ANALYSIS
5.3 PRICING ANALYSIS
TABLE 3 PRICE OF RECOMBINANT PROTEINS (USD)
5.4 STAKEHOLDER ANALYSIS
FIGURE 17 RECOMBINANT PROTEINS MARKET- STAKEHOLDER ANALYSIS
5.5 VALUE CHAIN ANALYSIS
FIGURE 18 VALUE CHAIN ANALYSIS: MAJOR VALUE IS ADDED DURING THE MANUFACTURING AND ASSEMBLY PHASE
5.6 RECOMBINANT PROTEINS FORMS AN INTEGRAL PART OF BIOTECHNOLOGY
FIGURE 19 BIOTECHNOLOGY ECOSYSTEM ANALYSIS
5.7 PORTERS FIVE FORCES ANALYSIS
FIGURE 20 REQUIREMENT OF HIGH CAPITAL INVESTMENTS TO RESTRICT THE ENTRY OF NEW PLAYERS
5.7.1 THREAT OF NEW ENTRANTS
5.7.2 THREAT OF SUBSTITUTES
5.7.3 BARGAINING POWER OF BUYERS
5.7.4 BARGAINING POWER OF SUPPLIERS
5.7.5 INTENSITY OF RIVALRY
6 RECOMBINANT PROTEINS MARKET, BY PRODUCT (Page No. - 56)
6.1 INTRODUCTION
TABLE 4 RECOMBINANT PROTEINS MARKET, BY PRODUCT, 20192026 (USD MILLION)
6.2 GROWTH FACTORS AND CHEMOKINES
6.2.1 THIS SEGMENT ACCOUNTED FOR THE LARGEST SHARE OF THE RECOMBINANT PROTEINS MARKET IN 2020
TABLE 5 GROWTH FACTORS AND CHEMOKINES MARKET, BY REGION, 20192026 (USD MILLION)
6.3 IMMUNE RESPONSE PROTEINS
6.3.1 IMMUNE CHECKPOINT PROTEINS PLAY A MAJOR ROLE IN CANCER IMMUNOTHERAPY
TABLE 6 IMMUNE RESPONSE PROTEINS MARKET, BY REGION, 20192026 (USD MILLION)
6.4 STRUCTURAL PROTEINS
6.4.1 STRUCTURAL PROTEINS ARE UTILIZED IN CELL CULTURE APPLICATIONS AS ATTACHMENT FACTORS
TABLE 7 STRUCTURAL PROTEINS MARKET, BY REGION, 20192026 (USD MILLION)
6.5 MEMBRANE PROTEINS
6.5.1 MEMBRANE PROTEINS ARE RESPONSIBLE FOR REGULATING PROCESSES THAT HELP BIOLOGICAL CELLS SURVIVE
TABLE 8 MEMBRANE PROTEINS MARKET, BY REGION, 20192026 (USD MILLION)
6.6 KINASE PROTEINS
6.6.1 KINASE PROTEINS PLAY A MAJOR ROLE IN SIGNAL TRANSDUCTION PATHWAYS
TABLE 9 KINASE PROTEINS MARKET, BY REGION, 20192026 (USD MILLION)
6.7 REGULATORY PROTEINS
6.7.1 REGULATORY PROTEINS HELP UNDERSTAND CELL CYCLE REGULATION AND CARCINOGENESIS
TABLE 10 REGULATORY PROTEINS MARKET, BY REGION, 20192026 (USD MILLION)
6.8 RECOMBINANT METABOLIC ENZYMES
6.8.1 ENZYMES REGULATE PROTEIN INTERACTIONS
TABLE 11 RECOMBINANT METABOLIC ENZYMES MARKET, BY REGION, 20192026 (USD MILLION)
6.9 ADHESION MOLECULES AND RECEPTORS
6.9.1 CELL ADHESION MOLECULES FACILITATE EXTRACELLULAR MATRIX (ECM) INTERACTIONS
TABLE 12 ADHESION MOLECULES AND RECEPTORS MARKET, BY REGION, 20192026 (USD MILLION)
6.10 OTHER RECOMBINANT PROTEINS
TABLE 13 OTHER RECOMBINANT PROTEINS MARKET, BY REGION, 20192026 (USD MILLION)
7 RECOMBINANT PROTEINS MARKET, BY APPLICATION (Page No. - 65)
7.1 INTRODUCTION
TABLE 14 RECOMBINANT PROTEINS MARKET, BY APPLICATION, 20192026 (USD MILLION)
7.2 DRUG DISCOVERY & DEVELOPMENT
TABLE 15 RECOMBINANT PROTEINS MARKET FOR DRUG DISCOVERY & DEVELOPMENT, BY REGION, 2019-2026 (USD MILLION)
TABLE 16 RECOMBINANT PROTEINS MARKET FOR DRUG DISCOVERY & DEVELOPMENT, BY TYPE, 2019-2026 (USD MILLION)
7.2.1 BIOLOGICS
7.2.1.1 Biologics are used to treat cancer, autoimmune diseases, and other serious disorders
TABLE 17 RECOMBINANT PROTEIN BIOLOGICS DRUGS
TABLE 18 RECOMBINANT PROTEINS MARKET FOR BIOLOGICS, BY REGION, 2019-2026 (USD MILLION)
7.2.2 VACCINES
7.2.2.1 Rising incidences of infectious diseases to boost the market growth for vaccines
TABLE 19 RECOMBINANT PROTEINS MARKET FOR VACCINES, BY REGION, 2019-2026 (USD MILLION)
7.2.3 CELL & GENE THERAPY
7.2.3.1 Stem cell therapy and CART therapies have increased the demand for recombinant proteins
TABLE 20 RECOMBINANT PROTEINS MARKET FOR CELL & GENE THERAPY, BY REGION, 2019-2026 (USD MILLION)
7.3 ACADEMIC RESEARCH STUDIES
7.3.1 RECOMBINANT PROTEINS ARE USED IN MOLECULAR AND GENE EXPRESSION STUDIES, THUS AIDING MARKET GROWTH
TABLE 21 RECOMBINANT PROTEINS MARKET FOR ACADEMIC RESEARCH STUDIES, BY REGION, 2019-2026 (USD MILLION)
7.4 BIOPHARMACEUTICAL PRODUCTION
7.4.1 RECOMBINANT PROTEINS ARE WIDELY USED FOR THE DEVELOPMENT OF PROTEIN-BASED DRUGS
TABLE 22 RECOMBINANT PROTEINS MARKET FOR BIOPHARMACEUTICAL PRODUCTION, BY REGION, 2019-2026 (USD MILLION)
7.5 BIOTECHNOLOGY RESEARCH
7.5.1 THE INCREASING NUMBER OF RESEARCH PROJECTS IN GENOMICS TO DRIVE MARKET GROWTH
TABLE 23 RECOMBINANT PROTEINS MARKET FOR BIOTECHNOLOGY RESEARCH, BY REGION, 2019-2026 (USD MILLION)
7.6 OTHER APPLICATIONS
TABLE 24 RECOMBINANT PROTEINS MARKET FOR OTHER APPLICATIONS, BY REGION, 2019-2026 (USD MILLION)
8 RECOMBINANT PROTEINS MARKET, BY END USER (Page No. - 74)
8.1 INTRODUCTION
TABLE 25 RECOMBINANT PROTEINS MARKET, BY END USER, 20192026 (USD MILLION)
8.2 PHARMACEUTICAL & BIOPHARMACEUTICAL COMPANIES
8.2.1 PHARMACEUTICAL & BIOPHARMACEUTICAL COMPANIES ARE THE LARGEST END-USER SEGMENT FOR RECOMBINANT PROTEINS USED IN TARGET DETECTION & DRUG DISCOVERY
TABLE 26 RECOMBINANT PROTEINS MARKET FOR PHARMACEUTICAL & BIOPHARMACEUTICAL COMPANIES, BY REGION, 20192026 (USD MILLION)
8.3 BIOTECHNOLOGY COMPANIES
8.3.1 INCREASING NUMBER OF PROJECTS FOR PROTEIN-BASED RESEARCH DRIVES MARKET GROWTH
TABLE 27 RECOMBINANT PROTEINS MARKET FOR BIOTECHNOLOGY COMPANIES, BY REGION, 20192026 (USD MILLION)
8.4 ACADEMIC RESEARCH INSTITUTES
8.4.1 GROWING GOVERNMENT INVESTMENTS TO PROPEL MARKET GROWTH
TABLE 28 RECOMBINANT PROTEINS MARKET FOR ACADEMIC RESEARCH INSTITUTES, BY REGION, 20192026 (USD MILLION)
8.5 CONTRACT RESEARCH ORGANIZATIONS (CROS)
8.5.1 INCREASING OUTSOURCING OF SERVICES TO CROS DRIVES MARKET GROWTH
TABLE 29 RECOMBINANT PROTEINS MARKET FOR CONTRACT RESEARCH ORGANIZATIONS, BY REGION, 20192026 (USD MILLION)
8.6 OTHER END USERS
TABLE 30 RECOMBINANT PROTEINS MARKET FOR OTHER END USERS, BY REGION, 20192026 (USD MILLION)
9 RECOMBINANT PROTEIN MARKET, BY REGION (Page No. - 80)
9.1 INTRODUCTION
TABLE 31 RECOMBINANT PROTEINS MARKET, BY REGION, 20192026 (USD MILLION)
9.2 NORTH AMERICA
FIGURE 21 NORTH AMERICA: RECOMBINANT PROTEINS MARKET SNAPSHOT
TABLE 32 NORTH AMERICA: RECOMBINANT PROTEINS MARKET, BY COUNTRY, 20192026 (USD MILLION)
TABLE 33 NORTH AMERICA: RECOMBINANT PROTEINS MARKET, BY PRODUCT, 20192026 (USD MILLION)
TABLE 34 NORTH AMERICA: RECOMBINANT PROTEINS MARKET, BY APPLICATION, 20192026 (USD MILLION)
TABLE 35 NORTH AMERICA: RECOMBINANT PROTEINS MARKET FOR DRUG DISCOVERY & DEVELOPMENT APPLICATION, BY TYPE, 20192026 (USD MILLION)
TABLE 36 NORTH AMERICA: RECOMBINANT PROTEINS MARKET, BY END USER, 20192026 (USD MILLION)
9.2.1 US
9.2.1.1 The US accounted for the largest share of the North American market for recombinant proteins during the forecast period
TABLE 37 US NIH BUDGET FOR VARIOUS DISCIPLINES, FY 2019 VS. FY 2020 (USD BILLION)
TABLE 38 US: RECOMBINANT PROTEINS MARKET, BY PRODUCT, 20192026 (USD MILLION)
TABLE 39 US: RECOMBINANT PROTEINS MARKET, BY APPLICATION, 20192026 (USD MILLION)
TABLE 40 US: RECOMBINANT PROTEINS MARKET FOR DRUG DISCOVERY & DEVELOPMENT APPLICATION, BY TYPE, 20192026 (USD MILLION)
TABLE 41 US: RECOMBINANT PROTEINS MARKET, BY END USER, 20192026 (USD MILLION)
9.2.2 CANADA
9.2.2.1 The high prevalence of cancer and favorable funding scenario in Canada is expected to support market growth
TABLE 42 CANADA: RECOMBINANT PROTEINS MARKET, BY PRODUCT, 20192026 (USD MILLION)
TABLE 43 CANADA: RECOMBINANT PROTEINS MARKET, BY APPLICATION, 20192026 (USD MILLION)
TABLE 44 CANADA: RECOMBINANT PROTEINS MARKET FOR DRUG DISCOVERY & DEVELOPMENT APPLICATION, BY TYPE, 20192026 (USD MILLION)
TABLE 45 CANADA: RECOMBINANT PROTEINS MARKET, BY END USER, 20192026 (USD MILLION)
9.3 EUROPE
TABLE 46 EUROPE: RECOMBINANT PROTEINS MARKET, BY COUNTRY, 20192026 (USD MILLION)
TABLE 47 EUROPE: RECOMBINANT PROTEINS MARKET, BY PRODUCT, 20192026 (USD MILLION)
TABLE 48 EUROPE: RECOMBINANT PROTEINS MARKET, BY APPLICATION, 20192026 (USD MILLION)
TABLE 49 EUROPE: RECOMBINANT PROTEINS MARKET FOR DRUG DISCOVERY & DEVELOPMENT APPLICATION, BY TYPE, 20192026 (USD MILLION)
TABLE 50 EUROPE: RECOMBINANT PROTEINS MARKET, BY END USER, 20192026 (USD MILLION)
9.3.1 GERMANY
9.3.1.1 Germany held the largest share of the market in Europe in 2020
TABLE 51 GERMANY: RECOMBINANT PROTEINS MARKET, BY PRODUCT, 20192026 (USD MILLION)
TABLE 52 GERMANY: RECOMBINANT PROTEINS MARKET, BY APPLICATION, 20192026 (USD MILLION)
TABLE 53 GERMANY: RECOMBINANT PROTEINS MARKET FOR DRUG DISCOVERY & DEVELOPMENT APPLICATION, BY TYPE, 20192026 (USD MILLION)
TABLE 54 GERMANY: RECOMBINANT PROTEINS MARKET, BY END USER, 20192026 (USD MILLION)
9.3.2 UK
9.3.2.1 Government initiatives to drive market growth in the UK
TABLE 55 UK: RECOMBINANT PROTEINS MARKET, BY PRODUCT, 20192026 (USD MILLION)
TABLE 56 UK: RECOMBINANT PROTEINS MARKET, BY APPLICATION, 20192026 (USD MILLION)
TABLE 57 UK: RECOMBINANT PROTEINS MARKET FOR DRUG DISCOVERY &DEVELOPMENT APPLICATION, BY TYPE, 20192026 (USD MILLION)
TABLE 58 UK: RECOMBINANT PROTEINS MARKET, BY END USER, 20192026 (USD MILLION)
9.3.3 FRANCE
9.3.3.1 Infrastructural development and rising life science R&D supports market growth in France
TABLE 59 FRANCE: RECOMBINANT PROTEINS MARKET, BY PRODUCT, 20192026 (USD MILLION)
TABLE 60 FRANCE: RECOMBINANT PROTEINS MARKET, BY APPLICATION, 20192026 (USD MILLION)
TABLE 61 FRANCE: RECOMBINANT PROTEINS MARKET FOR DRUG DISCOVERY & DEVELOPMENT APPLICATION, BY TYPE, 20192026 (USD MILLION)
TABLE 62 FRANCE: RECOMBINANT PROTEINS MARKET, BY END USER, 20192026 (USD MILLION)
9.3.4 ITALY
9.3.4.1 Life science research investments and a favorable funding scenario are the key growth drivers for market growth
TABLE 63 ITALY: RECOMBINANT PROTEINS MARKET, BY PRODUCT, 20192026 (USD MILLION)
TABLE 64 ITALY: RECOMBINANT PROTEINS MARKET, BY APPLICATION, 20192026 (USD MILLION)
TABLE 65 ITALY: RECOMBINANT PROTEINS MARKET FOR DRUG DISCOVERY & DEVELOPMENT APPLICATION, BY TYPE, 20192026 (USD MILLION)
TABLE 66 ITALY: RECOMBINANT PROTEINS MARKET, BY END USER, 20192026 (USD MILLION)
9.3.5 SPAIN
9.3.5.1 A favorable scenario for research initiatives drives the market growth in Spain
TABLE 67 SPAIN: RECOMBINANT PROTEINS MARKET, BY PRODUCT, 20192026 (USD MILLION)
TABLE 68 SPAIN: RECOMBINANT PROTEINS MARKET, BY APPLICATION, 20192026 (USD MILLION)
TABLE 69 SPAIN: RECOMBINANT PROTEINS MARKET FOR DRUG DISCOVERY & DEVELOPMENT APPLICATION, BY TYPE, 20192026 (USD MILLION)
TABLE 70 SPAIN: RECOMBINANT PROTEINS MARKET, BY END USER, 20192026 (USD MILLION)
9.3.6 REST OF EUROPE (ROE)
TABLE 71 ROE: RECOMBINANT PROTEINS MARKET, BY PRODUCT, 20192026 (USD MILLION)
TABLE 72 ROE: RECOMBINANT PROTEINS MARKET, BY APPLICATION, 20192026 (USD MILLION)
TABLE 73 ROE: RECOMBINANT PROTEINS MARKET FOR DRUG DISCOVERY & DEVELOPMENT APPLICATION, BY TYPE, 20192026 (USD MILLION)
TABLE 74 ROE: RECOMBINANT PROTEINS MARKET, BY END USER, 20192026 (USD MILLION)
9.4 ASIA PACIFIC
FIGURE 22 ASIA PACIFIC: RECOMBINANT PROTEINS MARKET SNAPSHOT
TABLE 75 ASIA PACIFIC: RECOMBINANT PROTEINS MARKET, BY COUNTRY, 20192026 (USD MILLION)
TABLE 76 ASIA PACIFIC: RECOMBINANT PROTEINS MARKET, BY PRODUCT, 20192026 (USD MILLION)
TABLE 77 ASIA PACIFIC: RECOMBINANT PROTEINS MARKET, BY APPLICATION, 20192026 (USD MILLION)
TABLE 78 ASIA PACIFIC: RECOMBINANT PROTEINS MARKET FOR DRUG DISCOVERY & DEVELOPMENT APPLICATION, BY TYPE, 20192026 (USD MILLION)
TABLE 79 ASIA PACIFIC: RECOMBINANT PROTEINS MARKET, BY END USER, 20192026 (USD MILLION)
9.4.1 JAPAN
9.4.1.1 Advanced healthcare infrastructure to support market growth in Japan
TABLE 80 JAPAN: RECOMBINANT PROTEINS MARKET, BY PRODUCT, 20192026 (USD MILLION)
TABLE 81 JAPAN: RECOMBINANT PROTEINS MARKET, BY APPLICATION, 20192026 (USD MILLION)
TABLE 82 JAPAN: RECOMBINANT PROTEINS MARKET FOR DRUG DISCOVERY & DEVELOPMENT APPLICATION, BY TYPE, 20192026 (USD MILLION)
TABLE 83 JAPAN: RECOMBINANT PROTEINS MARKET, BY END USER, 20192026 (USD MILLION)
9.4.2 CHINA
9.4.2.1 China is the fastest-growing segment of the overall APAC market during the forecast period
TABLE 84 CHINA: RECOMBINANT PROTEINS MARKET, BY PRODUCT, 20192026 (USD MILLION)
TABLE 85 CHINA: RECOMBINANT PROTEINS MARKET, BY APPLICATION, 20192026 (USD MILLION)
TABLE 86 CHINA: RECOMBINANT PROTEINS MARKET FOR DRUG DISCOVERY & DEVELOPMENT APPLICATION, BY TYPE, 20192026 (USD MILLION)
TABLE 87 CHINA: RECOMBINANT PROTEINS MARKET, BY END USER, 20192026 (USD MILLION)
9.4.3 INDIA
9.4.3.1 Strong biopharmaceutical growth and the rising demand for pharmaceuticals are key market drivers for growth in India
TABLE 88 INDIA: RECOMBINANT PROTEINS MARKET, BY PRODUCT, 20192026 (USD MILLION)
TABLE 89 INDIA: RECOMBINANT PROTEINS MARKET, BY APPLICATION, 20192026 (USD MILLION)
TABLE 90 INDIA: RECOMBINANT PROTEINS MARKET FOR DRUG DISCOVERY & DEVELOPMENT APPLICATION, BY TYPE, 20192026 (USD MILLION)
TABLE 91 INDIA: RECOMBINANT PROTEINS MARKET, BY END USER, 20192026 (USD MILLION)
9.4.4 REST OF ASIA PACIFIC (ROAPAC)
TABLE 92 ROAPAC: RECOMBINANT PROTEINS MARKET, BY PRODUCT, 20192026 (USD MILLION)
TABLE 93 ROAPAC: RECOMBINANT PROTEINS MARKET, BY APPLICATION, 20192026 (USD MILLION)
TABLE 94 ROAPAC: RECOMBINANT PROTEINS MARKET FOR DRUG DISCOVERY & DEVELOPMENT APPLICATION, BY TYPE, 20192026 (USD MILLION)
TABLE 95 ROAPAC: RECOMBINANT PROTEINS MARKET, BY END USER, 20192026 (USD MILLION)
9.5 REST OF THE WORLD (ROW)
TABLE 96 ROW: RECOMBINANT PROTEINS MARKET, BY PRODUCT, 20192026 (USD MILLION)
TABLE 97 ROW: RECOMBINANT PROTEINS MARKET, BY APPLICATION, 20192026 (USD MILLION)
TABLE 98 ROW: RECOMBINANT PROTEINS MARKET FOR DRUG DISCOVERY & DEVELOPMENT APPLICATION, BY TYPE, 20192026 (USD MILLION)
TABLE 99 ROW: RECOMBINANT PROTEINS MARKET, BY END USER, 20192026 (USD MILLION)
10 COMPETITIVE LANDSCAPE (Page No. - 119)
10.1 OVERVIEW
FIGURE 23 KEY PLAYERS ADOPTED ORGANIC AND INORGANIC GROWTH STRATEGIES BETWEEN 2018 AND 2020
FIGURE 24 MARKET EVOLUTION FRAMEWORK
10.2 MARKET SHARE ANALYSIS, 2019
FIGURE 25 RECOMBINANT PROTEINS MARKET, BY KEY PLAYERS, 2019
10.3 COMPETITIVE SCENARIO
10.3.1 PARTNERSHIPS, AGREEMENTS, AND COLLABORATIONS (20182020)
10.3.2 PRODUCT LAUNCHES & APPROVALS (2018-2020)
10.3.3 EXPANSIONS (2018-2020)
10.3.4 ACQUISITIONS (2018-2020)
10.4 COMPANY EVALUATION QUADRANT (2020)
10.4.1 VENDOR INCLUSION CRITERIA
10.4.2 STARS
10.4.3 EMERGING LEADERS
10.4.4 PERVASIVE PLAYERS
10.4.5 PARTICIPANTS
FIGURE 26 MNM VENDOR DIVE COMPARISON MATRIX: RECOMBINANT PROTEINS MARKET
11 COMPANY PROFILES (Page No. - 126)
(Business Overview, Products Offered, Recent Developments, MnM View)*
11.1 R&D SYSTEMS
FIGURE 27 BIO‑TECHNE CORPORATION: COMPANY SNAPSHOT (2019)
11.2 THERMO FISHER SCIENTIFIC INC.
FIGURE 28 THERMO FISHER SCIENTIFIC INC.: COMPANY SNAPSHOT (2019)
11.3 MERCK KGAA
FIGURE 29 MERCK KGAA: COMPANY SNAPSHOT (2019)
TABLE 100 EXCHANGE RATES (USED FOR THE CONVERSION OF EURO TO USD)
11.4 ABCAM PLC
FIGURE 30 ABCAM PLC: COMPANY SNAPSHOT (2020)
11.5 ABNOVA CORPORATION
11.6 BIOLEGEND
11.7 BIO-RAD LABORATORIES, INC.
FIGURE 31 BIO-RAD LABORATORIES, INC.: COMPANY SNAPSHOT (2019)
11.8 BPS BIOSCIENCE, INC.
11.9 ENZO LIFE SCIENCES, INC.
FIGURE 32 ENZO BIOCHEM, INC.: COMPANY SNAPSHOT (2019)
11.10 GENSCRIPT BIOTECH CORPORATION
FIGURE 33 GENSCRIPT BIOTECH CORPORATION: COMPANY SNAPSHOT (2019)
11.11 MILTENYI BIOTEC
11.12 PEPROTECH, INC.
11.13 PROTEINTECH GROUP
11.14 SINO BIOLOGICAL INC.
11.15 ACROBIOSYSTEMS
11.16 AVIVA SYSTEMS BIOLOGY CORPORATION
11.17 CELLGENIX GMBH
11.18 ICOSAGEN AS
11.19 NEUROMICS
11.20 PROSPEC-TECHNOGENE LTD.
11.21 PROTEOGENIX
11.22 RAYBIOTECH, INC.
11.23 RICHCORE LIFESCIENCES PVT LTD
11.24 STEMCELL TECHNOLOGIES INC.
11.25 STRESSMARQ BIOSCIENCES INC.
11.26 UNITED STATES BIOLOGICAL
*Business Overview, Products Offered, Recent Developments, MnM View might not be captured in case of unlisted companies.
12 APPENDIX (Page No. - 167)
12.1 DISCUSSION GUIDE
12.2 KNOWLEDGE STORE: MARKETSANDMARKETS SUBSCRIPTION PORTAL
12.3 AVAILABLE CUSTOMIZATION
12.4 RELATED REPORT
12.5 AUTHOR DETAILS
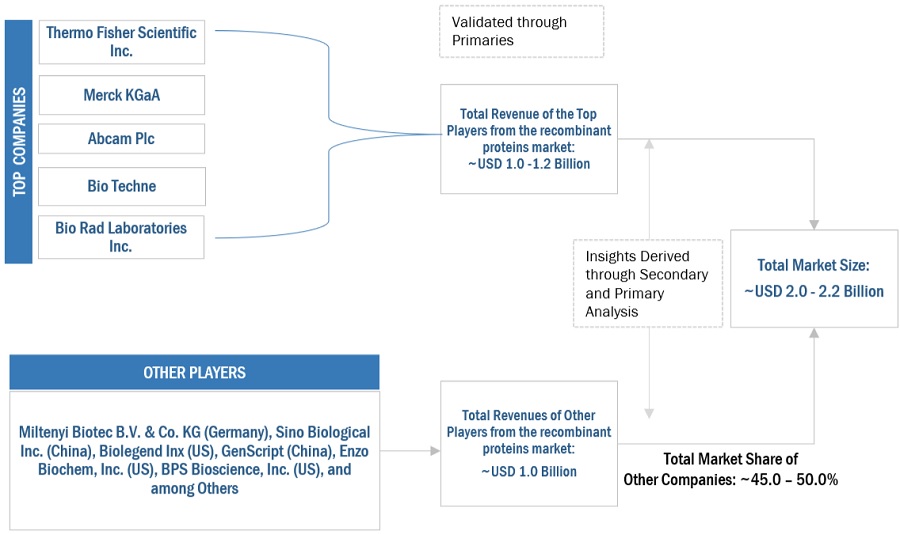
This study involved four major activities in estimating the current size of the recombinant proteins market. Exhaustive secondary research was carried out to collect information on the market, its peer markets, and its parent market. The next step was to validate these findings, assumptions, and sizing with industry experts across the value chain through primary research. Both top-down and bottom-up approaches were employed to estimate the complete market size. After that, market breakdown and data triangulation procedures were used to estimate the market size of segments and subsegments.
Secondary research was used mainly to identify and collect information for the extensive, technical, market-oriented, and commercial study of the recombinant proteins market. The secondary sources used for this study include The Antibody Society, Pharmaceutical Research and Manufacturers of America (PhRMA), National Institutes of Health (NIH), American Medical Association, Associations of Medical Laboratories, National Cancer Institute (NCI), Association of Medical Laboratory Immunologists (AMLI), American Society of Clinical Oncology (ASCO), American Association for Cancer Research (AACR), Biomolecular Interaction Network Database, European Medicines Agency (EMA), British Society for Immunology (BSI), Press Releases, Company Websites, Annual Reports, SEC Filings, Expert Interviews, and MarketsandMarkets Analysis. These sources were also used to obtain key information about major players, market classification, and segmentation according to industry trends, regional/country-level markets, market developments, and technology perspectives.
In-depth interviews were conducted with various primary respondents, including key industry participants, subject-matter experts (SMEs), C-level executives of key market players, and industry consultants, among other experts, to obtain and verify the critical qualitative and quantitative information as well as assess future prospects of the market. Various primary sources from both the supply and demand sides of the market were interviewed to obtain qualitative and quantitative information. The following is a breakdown of the primary respondents:
To know about the assumptions considered for the study, download the pdf brochure
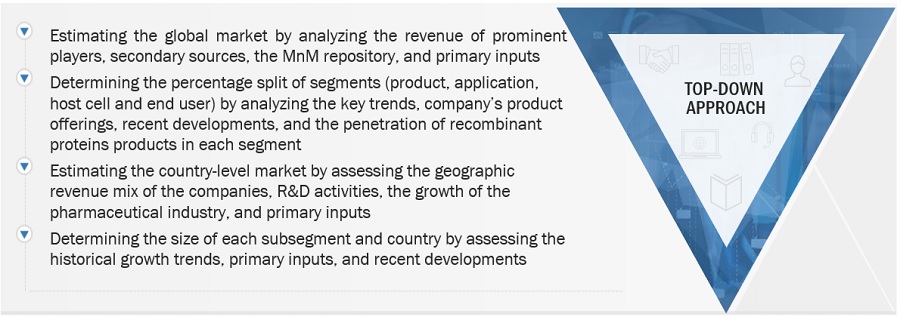
Both top-down and bottom-up approaches were used to estimate and validate the total size of the recombinant proteins market. These methods were also used extensively to estimate the size of various subsegments in the market. The research methodology used to estimate the market size includes the following:
After arriving at the overall market size from the market size estimation process, the total market was split into several segments and subsegments. To complete the overall market engineering process and arrive at the exact statistics for all segments and subsegments, data triangulation and market breakdown procedures were employed, wherever applicable. The data was triangulated by studying various factors and trends from both the demand and supply sides.
With the given market data, MarketsandMarkets offers customizations as per the companys specific needs. The following customization options are available for this report:
Benchmarking the rapid strategy shifts of the Top 100 companies in the Recombinant Proteins Market
Request For Special Pricing
Growth opportunities and latent adjacency in Recombinant Proteins Market