
Semiconductor Market for Robots Size, Share & Trends, 2030

Semiconductor Market for Robots Size, Share by Component (Compute, Sensors, Memory, Power Management ICs), Robot Type (Industrial Robots, Professional Service Robots, Personal & Household Service Robots, Drones), Vertical - Global Forecast to 2030


OVERVIEW
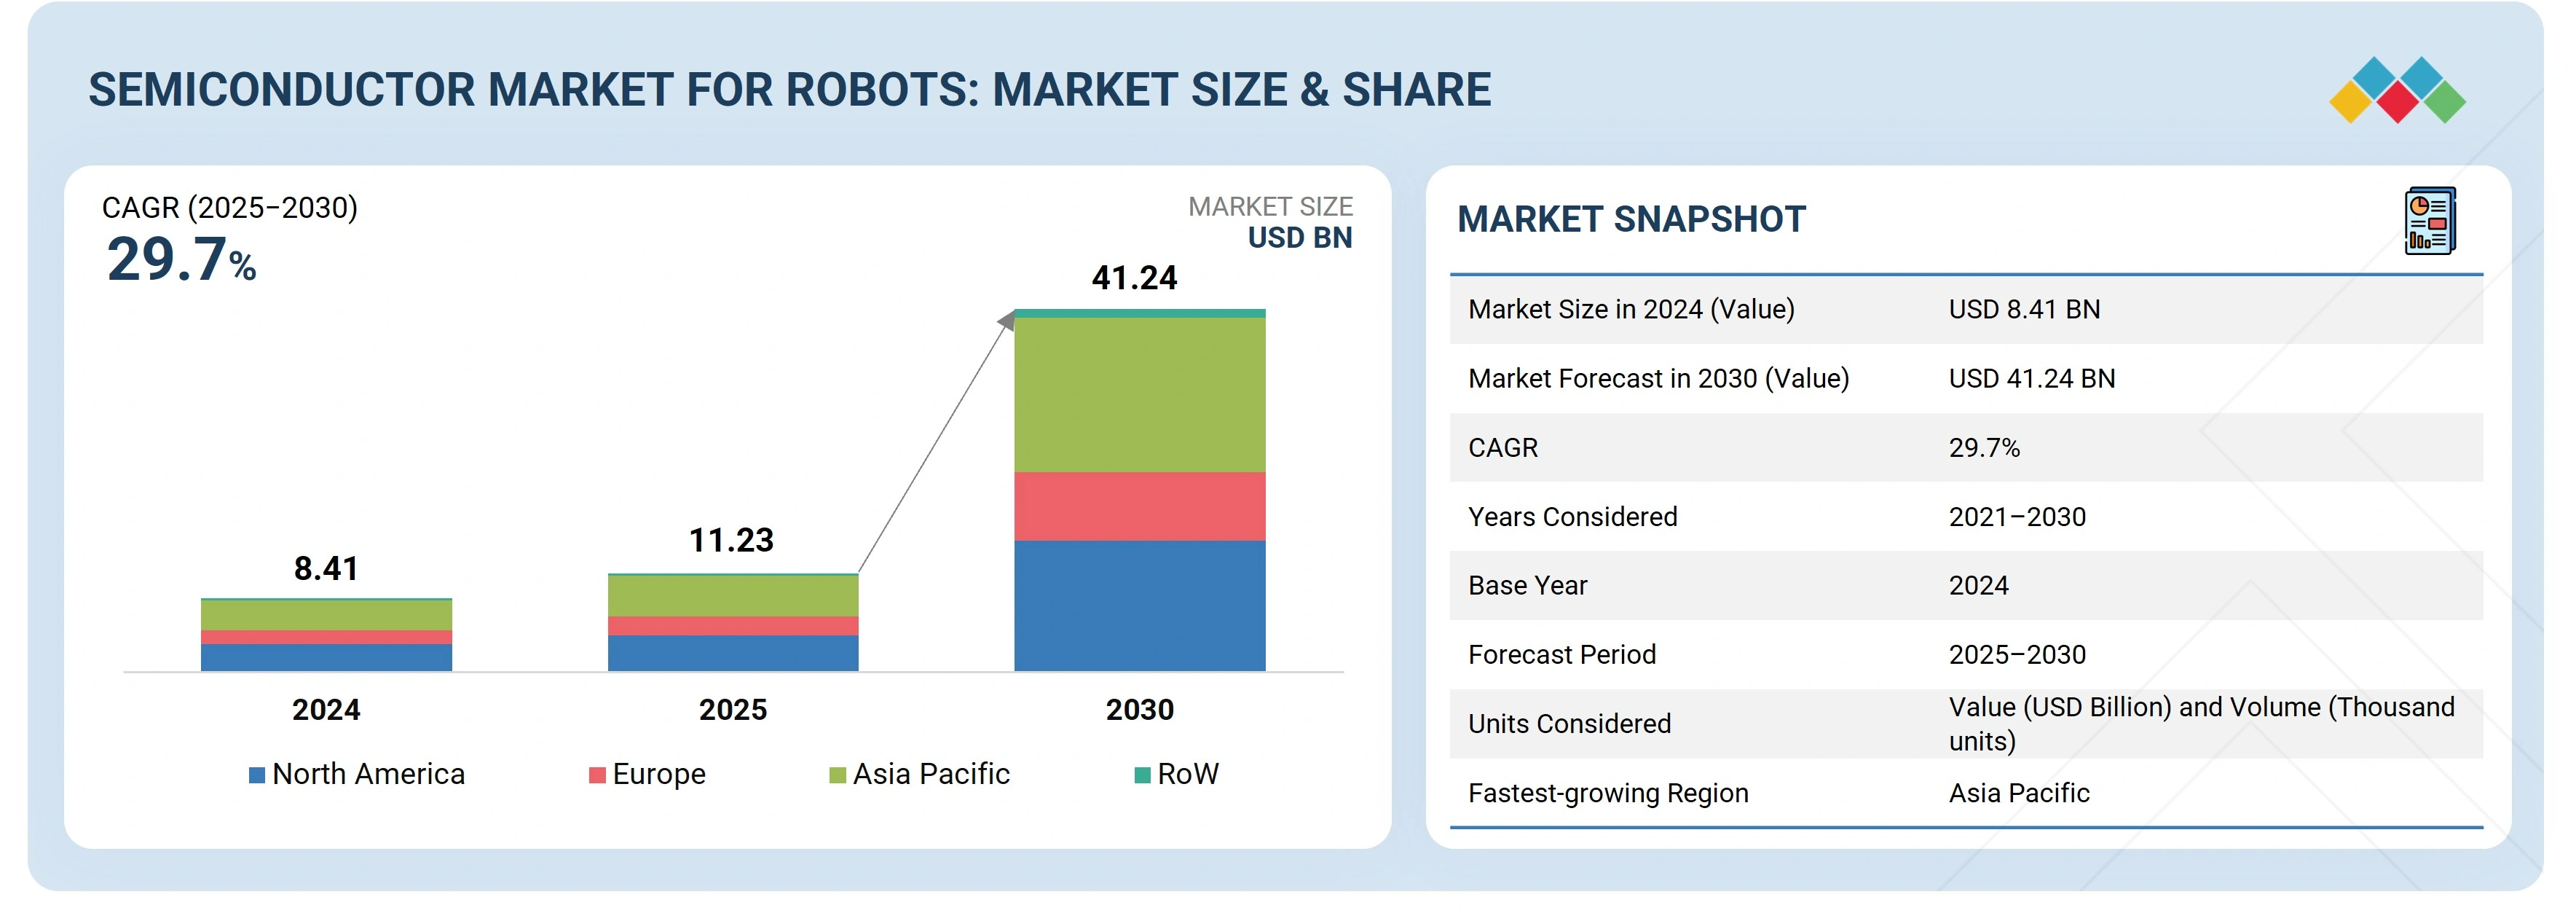
The semiconductor market for robots is projected to reach USD 41.24 billion by 2030 from USD 11.23 billion in 2025, at a CAGR of 29.7%. Semiconductors act as the core enablers of robotic systems, powering compute, sensing, memory, and connectivity functions critical for automation. Their adoption is rising due to the increasing deployment of robots across industries, such as manufacturing, healthcare, logistics, defense, and consumer applications. Market growth is further supported by advances in AI chips, power-efficient processors, and sensor integration, along with government incentives and investments in automation and smart manufacturing worldwide, which are driving semiconductor demand for next-generation robotic platforms.
Market Size & Forecast
• 2025 Market Size: USD 11.23 Billion
• 2030 Projected Market Size: USD 41.24 Billion
• CAGR (2025-2030): 29.7%
• Consumer Electronics: Largest Market Share
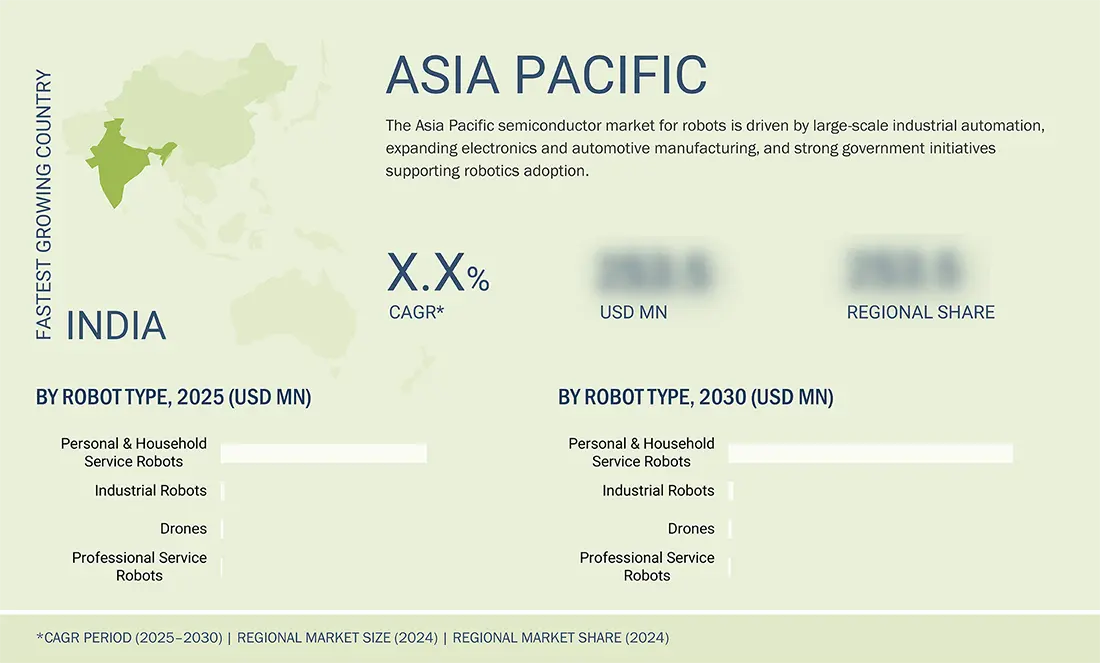
• Asia Pacific: Highest CAGR
KEY TAKEAWAYS
-
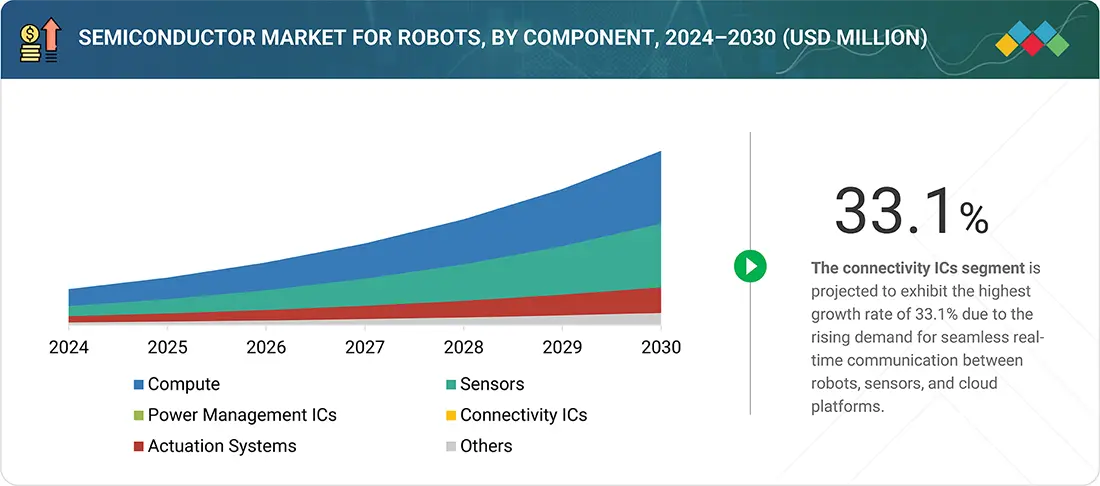
BY COMPONENTThe component segment consists of compute, sensors, memories, PMICs, connectivity ICs, actuation systems, and other analog/mixed-signal ICs. Among these, compute will hold the largest market share, as robots require processors for essential and required functions. The growing demand for robotics in different verticals will ensure a continued demand for compute.
-
BY ROBOT TYPEPersonal and household robots will hold the largest market share due to the rapid adoption of robotic vacuum cleaners, lawn mowers, and service robots, driven by rising consumer convenience demand and smart home integration.
-
BY VERTICALConsumer electronics will hold the largest market share driven by the increasing use of personal & household robots for cleaning, entertainment, and smart home functions, followed by industrial, logistics & warehousing, and automotive vertical.
-
BY REGIONAsia Pacific is expected to record the highest CAGR of 30.9% during the forecast period, fueled by rapid industrial automation, strong semiconductor manufacturing ecosystems in countries such as China, Japan, South Korea, and Taiwan, and supportive government initiatives for robotics and AI-driven technologies.
-
COMPETITIVE LANDSCAPEThe major market players have adopted both organic and inorganic strategies, including partnerships and investments. For instance, Texas Instruments Incorporated, Infineon Technologies AG, and NXP Semiconductors have entered into a number of collaborations and partnerships to meet the growing demand for semiconductors in robotics.
The semiconductor market for robots is projected to grow rapidly over the next decade, supported by advancements in AI chips, sensors, and power-efficient processors that enable smarter, autonomous robotic systems. Robots are increasingly relying on semiconductors for their compute, sensing, memory, and connectivity functions, making them indispensable in manufacturing, healthcare, logistics, and consumer applications. Growing emphasis on automation, smart factories, and intelligent service robots further strengthens the role of semiconductors as the backbone of robotics, setting the foundation for widespread adoption across industries.
Source: Secondary Research, Interviews with Experts, MarketsandMarkets Analysis
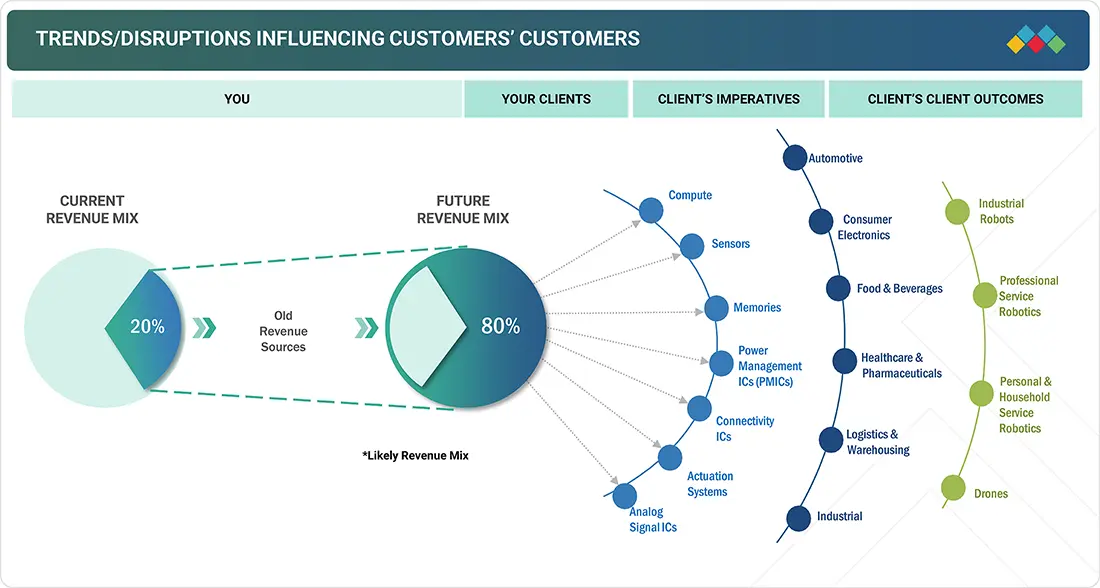
TRENDS & DISRUPTIONS IMPACTING CUSTOMERS' CUSTOMERS
The impact on consumer businesses arises from customer trends and disruptions. Hotbeds are the clients of semiconductor manufacturers for robots, while target applications refer to the specific uses of these semiconductors. Changes in trends or disruptions will directly influence the revenues of end users. This revenue impact on end users will, in turn, affect the revenue of hotbeds, ultimately impacting the revenues of semiconductor manufacturers for robots.
Source: Secondary Research, Interviews with Experts, MarketsandMarkets Analysis
MARKET DYNAMICS
Level
-
Surge in AI & edge computing in robotics

-
Increasing automation across iIndustries

Level
-
High initial investment

-
Design complexity & integration challenges

Level
-
Geographical expansion & onshoring

-
Development of new applications in robotics

Level
-
Supply chain vulnerability

-
Security & safety compliance

Source: Secondary Research, Interviews with Experts, MarketsandMarkets Analysis
Driver: Surge in AI & edge computing in robotics
The surge in AI and edge computing is significantly driving growth of the semiconductor market for robots by increasing demand for high-performance, power-efficient chips capable of handling complex computations locally. As robots are increasingly required to make real-time decisions in dynamic environments such as autonomous vehicles navigating traffic or industrial robots adjusting to production floor changes, there is a growing need for semiconductors that can support edge-AI workloads.
Restraint: High initial investment
The development and deployment of semiconductor components tailored for robotic workloads involves expensive R&D, verification cycles, and access to advanced foundries. ASICs and FPGAs demand custom design efforts and significant non-recurring engineering (NRE) costs while integrating multiple processors such as VPUs and MCUs within a robotics system adds complexity and cost. These upfront investments deter smaller robotics firms and constrain innovation.
Opportunity: Geographical expansion & onshoring
Geographical expansion into emerging markets such as Asia, Latin America, and Eastern Europe offers opportunities for tailored semiconductor solutions as robotics adoption spreads to diverse sectors and Tier 2/3 cities. Simultaneously, onshoring initiatives, supported by policies such as the US CHIPS Act and EU Chips Act, boost domestic semiconductor manufacturing, ensuring supply security and strengthening the robotics semiconductor ecosystem globally.
Challenge: Supply chain vulnerability
Supply chain vulnerability is a critical challenge for the semiconductor market in robotics, primarily due to the highly complex and globalized nature of chip manufacturing. Robotic applications often rely on advanced and specialized semiconductor components that are sourced from different countries. Disruptions caused by geopolitical tensions, trade restrictions, and natural disasters, can lead to significant delays in sourcing these components.
Semiconductor Market: COMMERCIAL USE CASES ACROSS INDUSTRIES
| COMPANY | USE CASE DESCRIPTION | BENEFITS |
|---|---|---|
 |
PMICs and motor driver ICs for robotic actuation systems | Higher power efficiency | Reduced heat generation | Smoother and precise robotic movement |
 |
Secure connectivity ICs and microcontrollers for autonomous mobile robots (AMRs) | Reliable real-time communication | Enhanced safety features | Scalable architecture for robotics |
 |
FPGAs, MCUs for industrial and service robots | Deterministic control | High reliability |Reduced development time |Optimized energy management |
 |
Image sensors for robotic vision systems in logistics and autonomous delivery robots | Superior low-light imaging | Faster object recognition | Improved navigation in dynamic settings |
 |
GPUs enabling autonomous navigation and vision processing in industrial robots | High-speed parallel computing | Real-time decision-making |Improved accuracy in object detection |
Logos and trademarks shown above are the property of their respective owners. Their use here is for informational and illustrative purposes only.
MARKET ECOSYSTEM
The semiconductor market for robots ecosystem involves semiconductor component suppliers, robotics OEMs, system integrators, and end users. Each section collaborates to advance the market by sharing knowledge, resources, and expertise to attain end innovation in this field.
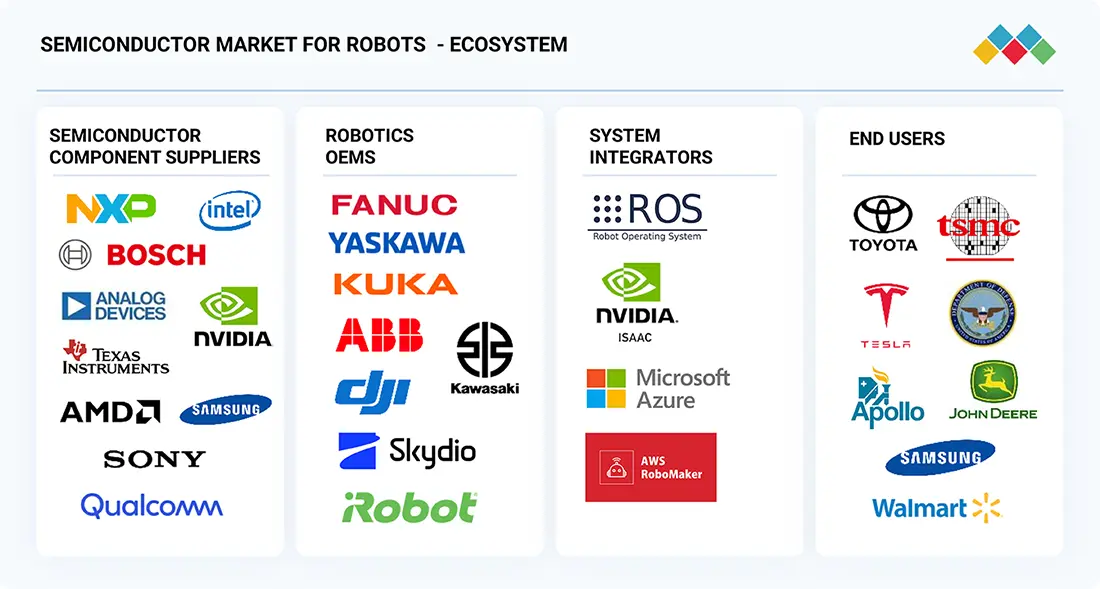
Logos and trademarks shown above are the property of their respective owners. Their use here is for informational and illustrative purposes only.
MARKET SEGMENTS
Source: Secondary Research, Interviews with Experts, MarketsandMarkets Analysis
Semiconductor Market for Robots, by Component
The compute segment will hold the largest share of the semiconductor market for robots because it provides the core processing power necessary to operate and control robotic systems. Robots depend on processors, such as CPUs, GPUs, ASICs, FPGAs, DSPs, VPUs, and MCUs, to enable critical functions such as motion control, AI-based decision-making, sensor data processing, and real-time system coordination. As robots are increasingly deployed in complex environments ranging from industrial automation and logistics to healthcare and autonomous vehicles, the demand for high-performance, low-latency, and energy-efficient compute solutions is accelerating.
Semiconductor Market for Robots, by Robot Type
The personal and household service robots segment is set to hold the largest market share in 2025, driven by the rising demand for convenience, comfort, and quality of life at home. Growing urbanization, busy lifestyles, and aging populations are fueling adoption of cleaning, companion, and assistive robots. Affordable, user-friendly designs combined with AI, voice recognition, and smart home integration make these robots highly accessible, multifunctional, and suitable for mass adoption, with robotic vacuums paving the way for broader consumer acceptance.
Semiconductor Market for Robots, by Vertical
The consumer electronics segment will hold the largest share of the semiconductor market for robots due to the rapid growth of personal and household robots, such as robotic vacuums, lawn mowers, kitchen assistants, and entertainment robots. Rising urbanization, busy lifestyles, and demand for smart home integration are driving adoption. These robots rely heavily on semiconductors for compute, sensing, connectivity, and power management. Their affordability, user-friendliness, and widespread consumer acceptance make this segment the key driver of semiconductor demand in robotics.
REGION
Asia Pacific to be fastest-growing region in global semiconductor market for robots during forecast period
Asia Pacific is poised for rapid growth in the semiconductor market for robots, supported by its role as a global manufacturing hub and expanding consumer base. Key countries such as China, Japan, South Korea, and India benefit from low costs, skilled labor, and supportive policies. Rising automation in manufacturing, logistics, and healthcare, along with demographic pressures such as aging populations, drive adoption. Regional robotics leaders and strong government programs, including Made in China 2025 and Japan’s Robot Strategy, further accelerate semiconductor demand.
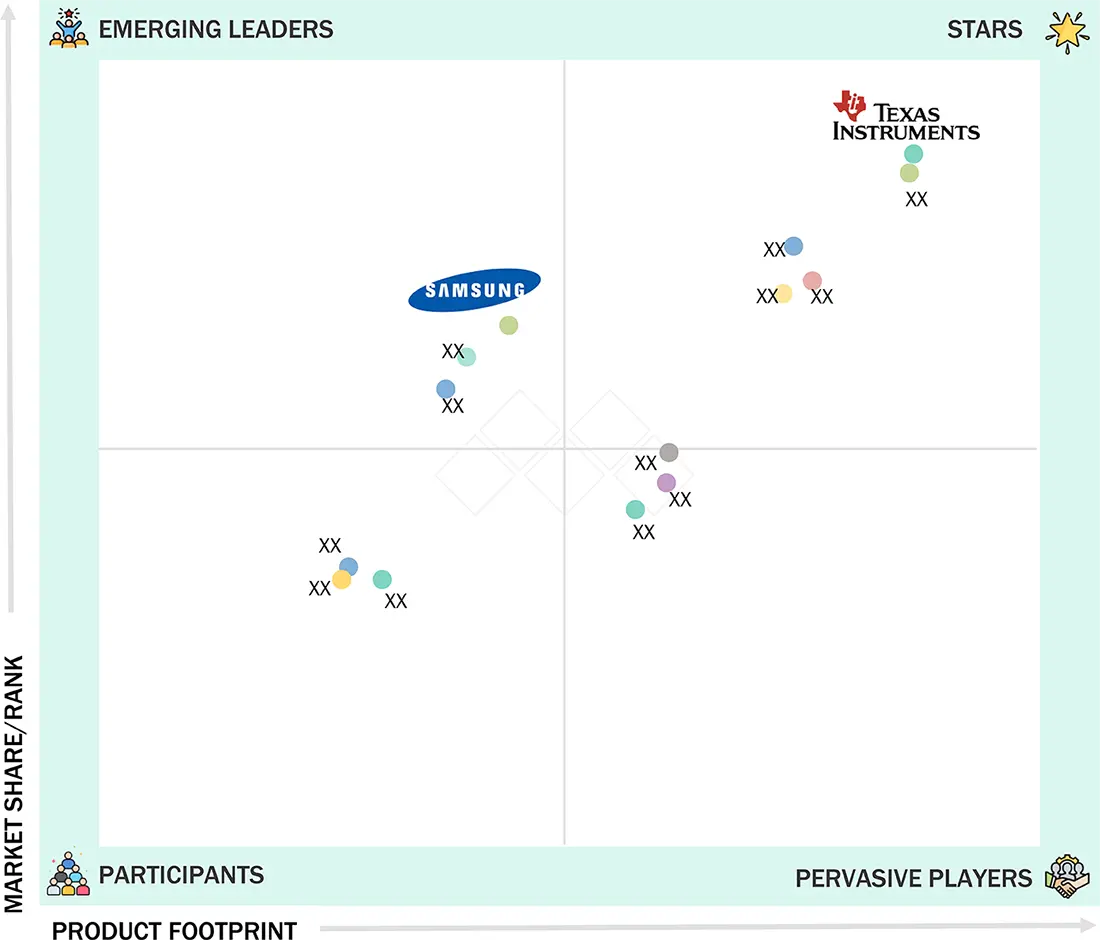
Semiconductor Market: COMPANY EVALUATION MATRIX
In the semiconductor market for robots, Texas Instruments (Star) leads with a strong market presence and extensive portfolio of compute, sensors, power management ICs, connectivity ICs, and actuators, enabling reliable performance across industrial, consumer electronics, and automotive verticlas. Samsung, identified as an Emerging Leader, is making significant progress with its advanced memory and sensor technologies designed specifically for robotics. Although Texas Instruments currently holds a dominant position in automation due to its established scale and integration, Samsung demonstrates considerable growth potential and is likely to advance toward the leaders' quadrant through innovation in its robotic components.
Source: Secondary Research, Interviews with Experts, MarketsandMarkets Analysis
KEY MARKET PLAYERS
MARKET SCOPE
| REPORT METRIC | DETAILS |
|---|---|
| Market Size in 2024 (Value) | USD 8.41 Billion |
| Market Forecast in 2030 (Value) | USD 41.24 Billion |
| Growth Rate | CAGR of 29.7% from 2025 to 2030 |
| Years Considered | 2021–2030 |
| Base Year | 2024 |
| Forecast Period | 2025–2030 |
| Units Considered | Value (USD Billion) and Volume (Thousand) |
| Report Coverage | Revenue Forecast, Company Ranking, Competitive Landscape, Growth Factors, and Trends |
| Segments Covered |
|
| Regions Covered | North America, Europe, Asia Pacific, and RoW |
WHAT IS IN IT FOR YOU: Semiconductor Market REPORT CONTENT GUIDE
DELIVERED CUSTOMIZATIONS
We have successfully delivered the following deep-dive customizations:
| CLIENT REQUEST | CUSTOMIZATION DELIVERED | VALUE ADDS |
|---|---|---|
| Global Robotics OEM | Detailed company profiles of semiconductor suppliers (AI capability, edge computing, power efficiency) Chipset-to-function mapping for autonomous, collaborative, and service robots Ecosystem analysis of integrated hardware-software platforms | Identify optimal chip partners for application-specific robots Uncover interdependencies across robotics compute, sensing, and control Highlight strategic opportunities for vertical integration |
| Industrial Robotics Manufacturer | Benchmarking of processor types (ASICs, FPGAs, GPUs) across motion control, machine vision, and edge AI Study of transition barriers from legacy chips to AI-native architectures Customer trend analysis across manufacturing and logistics sectors | Enable smooth migration to next-gen chips for smart factory deployments. Support roadmap alignment with emerging compute architectures. Target cost-effective alternatives to current chip dependencies |
| AI Chip Startup | Demand modeling for robotic AI chips across industrial, medical, and consumer robotics Competitive landscape mapping of chip players by application specialization Forecast of compute workloads and AI acceleration needs through 2030 | Validate GTM strategy with focused verticals (e.g., warehouse automation). Identify whitespace opportunities for new chip designs. Secure investor confidence with market-backed demand estimates |
| Robot Sensor Module Supplier | IP landscape analysis for sensor-integrated chipsets (e.g., vision, tactile, LiDAR) Review of chip-sensor co-packaging trends Mapping of OEM integration pipelines and timelines | Spot co-development opportunities with logic and control chip players Strengthen competitive edge through sensor-side compute integration Enable early engagement with OEMs adopting high-bandwidth sensing |
RECENT DEVELOPMENTS
- February 2025 : Texas Instruments (TI) partnered with Apptronik to power Apollo, a commercial humanoid robot, using its advanced motor control, power management, and safety technologies. TI’s microcontrollers and gate drivers enable precise, energy-efficient motion for safe human–robot interaction. The collaboration highlights TI’s growing role in robotics innovation, helping develop robots that can perform complex tasks in human environments.
- January 2025 : bitsensing and NXP Semiconductors signed an MoU to jointly develop high-performance radar systems for automotive, smart cities, robotics, and healthcare. The collaboration integrates NXP’s advanced SAF85xx radar chipsets with bitsensing’s software expertise. Customers are already evaluating early samples. This partnership aims to enable safer vehicles and smarter solutions for diverse next-generation radar applications.
- July 2024 : STMicroelectronics launched the ST BrightSense image sensor ecosystem. It includes hardware kits, camera modules, and software to simplify integration of global-shutter sensors in compact, power-efficient products. Targeting factory automation, robotics, AR/VR, and medical applications, the ecosystem enhances image quality for fast-moving objects and reduces power use by synchronizing with lighting systems.
- November 2023 : Sony Semiconductor Solutions launched IMX900, a 3.2 MP global shutter CMOS image sensor designed for machine vision applications such as barcode reading and robot picking. The compact sensor supports S-mount M12 lenses, offers 120 fps, and features 2.25 μm pixels. It includes MIPI and SLVS interfaces and is ideal for high-speed, high-precision industrial imaging.
- July 2023 : Infineon launched XENSIV BGT60UTR11AIP, the world’s smallest 60 GHz radar sensor with antennas in a package, measuring just 16 mm². Designed for compact devices, it enables vital sensing in healthcare (e.g., baby monitors), consumer electronics, smart home systems, and industrial uses, including robotics and tank level monitoring. It offers precise heart and respiratory rate detection in space-constrained applications.
Table of Contents
 Exclusive indicates content/data unique to MarketsandMarkets and not available with any competitors.
Methodology
The research process for this technical, market-oriented, and commercial study of the semiconductor market for robots included the systematic gathering, recording, and analysis of data about companies operating in the market. It involved the extensive use of secondary sources, directories, and databases (Factiva, Oanda, and OneSource) to identify and collect relevant information. In-depth interviews were conducted with various primary respondents, including experts from core and related industries and preferred manufacturers, to obtain and verify critical qualitative and quantitative information as well as to assess the growth prospects of the market. Key players in the semiconductor market for robots were identified through secondary research, and their market rankings were determined through primary and secondary research. This included studying annual reports of top players and interviewing key industry experts, such as CEOs, directors, and marketing executives.
Secondary Research
In the secondary research process, various secondary sources were used to identify and collect information for this study. These include annual reports, press releases, and investor presentations of companies, whitepapers, certified publications, and articles from recognized associations and government publishing sources. Research reports from a few consortiums and councils were also consulted to structure qualitative content. Secondary sources included corporate filings (such as annual reports, investor presentations, and financial statements); trade, business, and professional associations; white papers; Journals and certified publications; articles by recognized authors; gold-standard and silver-standard websites; directories; and databases. Data was also collected from secondary sources, such as the International Trade Centre (ITC) and the International Monetary Fund (IMF).
List of key secondary sources
|
Source |
Web Link |
|
Semiconductor Industry Association |
www.semiconductors.org |
|
Global Semiconductor Alliance |
www.gsaglobal.org |
|
European Semiconductor Industry Association |
www.eusemiconductors.eu |
|
The Taiwan Semiconductor Industry Association |
www.tsia.org |
|
International Federation of Robotics (IFR) |
www.ifr.org/ |
|
Association for Advancing Automation (A3) |
https://www.automate.org/robotics |
|
IEEE Robotics and Automation Society |
www.ieee-ras.org |
|
euRobotics |
www.eu-robotics.net/ |
|
Robotics Business Review (RBR) |
www.roboticsbusinessreview.com |
|
International Federation of Robotics (IFR) |
www.ifr.org/ |
Primary Research
Extensive primary research was accomplished after understanding and analyzing the semiconductor market for robots scenario through secondary research. Several primary interviews were conducted with key opinion leaders from both demand- and supply-side vendors across four major regions—North America, Europe, Asia Pacific, and RoW. Approximately 30% of the primary interviews were conducted with the demand side, and 70% with the supply side. Primary data was collected through questionnaires, emails, and telephonic interviews. Various departments within organizations, such as sales, operations, and administration, were contacted to provide a holistic viewpoint in the report.

Notes: Other designations include technology heads, media analysts, sales managers, marketing managers, and product managers.
The three tiers of the companies are based on their total revenues as of 2024; Tier 1: >USD 1 billion, Tier 2: USD 500 million–1 billion, and Tier 3: USD 500 million.
To know about the assumptions considered for the study, download the pdf brochure
Market Size Estimation
In the complete market engineering process, top-down and bottom-up approaches and several data triangulation methods have been used to perform the market size estimation and forecasting for the overall market segments and subsegments listed in this report. Extensive qualitative and quantitative analyses have been performed on the complete market engineering process to list key information/insights throughout the report. The following table explains the process flow of the market size estimation.
The key players in the market were identified through secondary research, and their rankings in the respective regions were determined through primary and secondary research. This entire procedure involved the study of the annual and financial reports of top players and interviews with industry experts such as chief executive officers, vice presidents, directors, and marketing executives for quantitative and qualitative key insights. All percentage shares, splits, and breakdowns were determined using secondary sources and verified through primary sources. All parameters that affect the markets covered in this research study were accounted for, viewed in extensive detail, verified through primary research, and analyzed to obtain the final quantitative and qualitative data. This data was consolidated, supplemented with detailed inputs and analysis from MarketsandMarkets, and presented in this report.
Bottom-Up Approach
- Shipments of various robot types (industrial robots, professional service robots, personal & household service robots, and drones) were identified through primary and secondary research.
- The number of semiconductor components integrated into each robot type was mapped across compute, memory, sensors, connectivity ICs, PMICs, and others.
- Robot shipments were multiplied by the average number of components per robot to calculate component shipment volumes.
- Component shipment volumes were multiplied by the average selling price (ASP) of each component category to derive the global number.
- The process was repeated for all robot categories, including articulated robots, humanoids, drones, cleaning robots, delivery robots, and others.
- The global semiconductor market size for robots was derived by summing revenues across all robot types and component segments.
- CAGR was estimated based on robotics penetration rate, industry adoption trends, and demand-supply dynamics for semiconductors.
- All estimates were validated through discussions with key stakeholders (semiconductor vendors, robotics OEMs, and domain experts) and cross-checked with company reports, press releases, and industry databases.
Top-Down Approach
- Focusing on the top-line investment and spending being made across various industry ecosystems
- Building and developing the information related to revenue generated through key semiconductor products used in robotic systems
- Carrying out multiple on-field discussions with key opinion leaders (KOLs) across each major company involved in the development of semiconductors for robots
- Estimating the vertical split using secondary sources, based on factors such as the robot type and the semiconductor component mix (compute, sensors, memory, connectivity, power management, actuation, and analog/mixed-signal)
- Estimating the regional split using secondary sources, based on various factors such as the number of players in a specific country and region, robot adoption maturity, and types of semiconductor products demanded
Semiconductor Market for Robot : Top-Down and Bottom-Up Approach

Data Triangulation
After arriving at the overall size of the semiconductor market for robots through the process explained above, the overall market has been split into several segments. Data triangulation procedures have been employed to complete the overall market engineering process and arrive at the exact statistics for all the segments, wherever applicable. The data has been triangulated by studying various factors and trends from both the demand and supply sides. The market has also been validated using both the top-down and bottom-up approaches.
Market Definition
The semiconductor market for robots encompasses the range of electronic components specifically designed or adapted to enable robotic systems across industrial, healthcare, automotive, food & beverages, logistics & warehousing, and consumer applications. This market includes processors, sensors, memory, power management ICs, connectivity ICs, actuation systems, and other analog/mixed-signal ICs that power, control, and connect robots. Driven by advancements in AI, automation, and edge computing, these semiconductors provide the computational performance, energy efficiency, precision control, and environmental adaptability required for robots to perform complex, autonomous, and collaborative tasks.
Key Stakeholders
- Government and Defense Agencies
- Investors and Financial Institutions
- Semiconductor Manufacturers
- Robotics OEMs
- System Integrators
- Regulatory Bodies
Report Objectives
- To define, describe, segment, and forecast the size of the semiconductor market for robots, in terms of component, robot type, vertical, and region
- To forecast the size of the market segments for four major regions: North America, Europe, Asia Pacific, and RoW
- To give detailed information regarding drivers, restraints, opportunities, and challenges influencing the growth of the market
- To provide value chain analysis, ecosystem analysis, case study analysis, patent analysis, trade analysis, technology analysis, pricing analysis, key conferences and events, key stakeholders and buying criteria, Porter's five forces analysis, investment and funding scenario, and regulations pertaining to the market
- To strategically analyze micromarkets with regard to individual growth trends, prospects, and contributions to the total market
- To analyze opportunities for stakeholders by identifying high-growth segments of the market
- To strategically profile the key players, comprehensively analyze their market positions in terms of ranking and core competencies, and provide a competitive market landscape
- To analyze strategic approaches, such as product launches, acquisitions, agreements, and partnerships, in the semiconductor market for robots
Available Customizations
With the given market data, MarketsandMarkets offers customizations according to the company's specific needs. The following customization options are available for the report:
Company Information:
- Detailed analysis and profiling of additional market players (up to 7)
Key Questions Addressed by the Report
What are the major driving factors and opportunities for the semiconductor market for robots?
The major factors driving the semiconductor market for robots include increasing automation across industries, surge in AI & edge computing in robotics, adoption of collaborative robots, and government and industrial 4.0 initiatives.
Which region is expected to hold the largest share of the semiconductor market for robots in 2025?
Asia Pacific is projected to capture the largest market share in 2025 due to rising government initiatives and the presence of major market players in the region.
Who are the leading players in the global semiconductor market for robots?
Leading players operating in the global semiconductor market for robots include Texas Instruments Incorporated (US), Infineon Technologies AG (Germany), NXP Semiconductors (Netherlands), STMicroelectronics (Switzerland), and Sony Group Corporation (Japan).
What are the technological advancements in the semiconductor market for robots?
Artificial Intelligence (AI) & Machine Learning, Advanced Vision Systems and Sensors, Power Electronics & Motor Control ICs, LiDAR (Light Detection and Ranging) and Neuromorphic Computing, and Digital Twin & Simulation Platforms are key advancements in the market.
What is the size of the global semiconductor market for robots?
The global semiconductor market for robots is expected to be valued at USD 11.23 billion in 2025 and is projected to reach USD 41.24 billion by 2030, at a CAGR of 29.7%.
Need a Tailored Report?
Customize this report to your needs
Get 10% FREE Customization
Customize This ReportPersonalize This Research
- Triangulate with your Own Data
- Get Data as per your Format and Definition
- Gain a Deeper Dive on a Specific Application, Geography, Customer or Competitor
- Any level of Personalization
Let Us Help You
- What are the Known and Unknown Adjacencies Impacting the Semiconductor Market
- What will your New Revenue Sources be?
- Who will be your Top Customer; what will make them switch?
- Defend your Market Share or Win Competitors
- Get a Scorecard for Target Partners

Custom Market Research Services
We Will Customise The Research For You, In Case The Report Listed Above Does Not Meet With Your Requirements
Get 10% Free CustomisationTESTIMONIALS

Tetsuya Ohhira
Business Development Manager-Technology Business
Nikon Corporation,
Leading Japanese MNC specializing in optics and imaging productswww.nikon.com
MarketsandMarkets™ response
is quick. Their attitude is flexible and positive. Analyst Insights are globally considered and
significant. Client Services quickly respond to our inquiry and demand. Their wide range of global
surveys help us make our strategic plan.
We hope Knowledge Store will be easier to search
for a report.
VP - Marketing & Business Development
Leading Provider of Process Control Solutions
We engaged with MarketsandMarkets on a study to perform an analysis and recommend a Go-To-Market strategy for metrology and process control in the semiconductor market. The study was tailored to our targets and needs with well-defined milestones. Our overall experience with the MarketsandMarkets team was very good throughout the project in all aspects including the analysis methodologies used, the quality and depth of primary and secondary data sets, the professionalism and flexibility of the team and the ability to meet the target schedule and milestones. We want to thank MarketsandMarkets team for a job well done.
Growth opportunities and latent adjacency in Semiconductor Market


Klein
Sep, 2025
Insightful breakdown of how semiconductors are the backbone of digital transformation across industries�from healthcare to automotive..