
Small-Scale LNG Market

Small-Scale LNG Market by Type (Liquefaction, Regasification), Modes of Supply (Trucks, Trans-shipment & Bunkering, Others), Application (Heavy-Duty Vehicles, Industrial & Power, Marine Transport, Others) Region - Global Forecast to 2030


OVERVIEW
Source: Secondary Research, Interviews with Experts, MarketsandMarkets Analysis
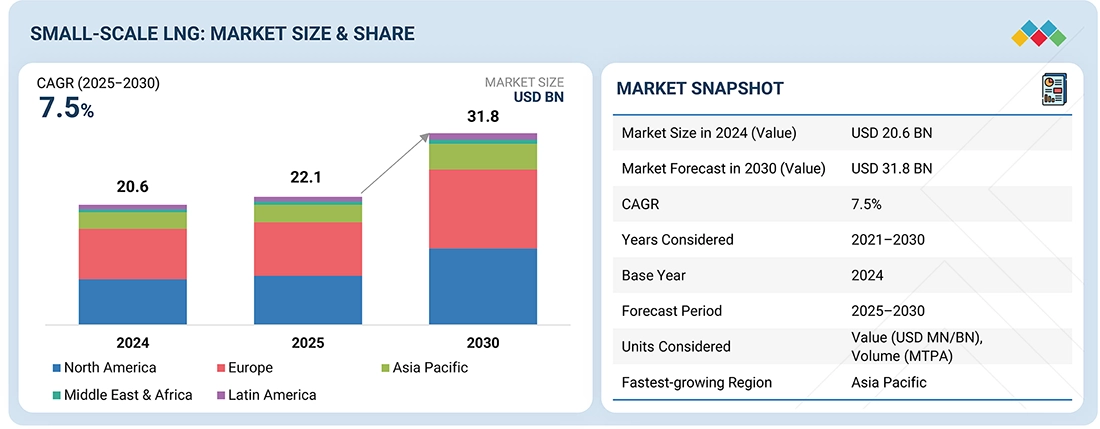
The small-scale LNG market is expected to reach USD 31.8 billion by 2030 from USD 22.1 billion in 2025, at a CAGR of 7.5% during the forecast period. The small-scale LNG market is growing due to its advantages over large-scale LNG plants, helping save costs, environmental benefits, government subsidies, and rising demand in bunkering, road transportation, and off-grid power.
KEY TAKEAWAYS
-
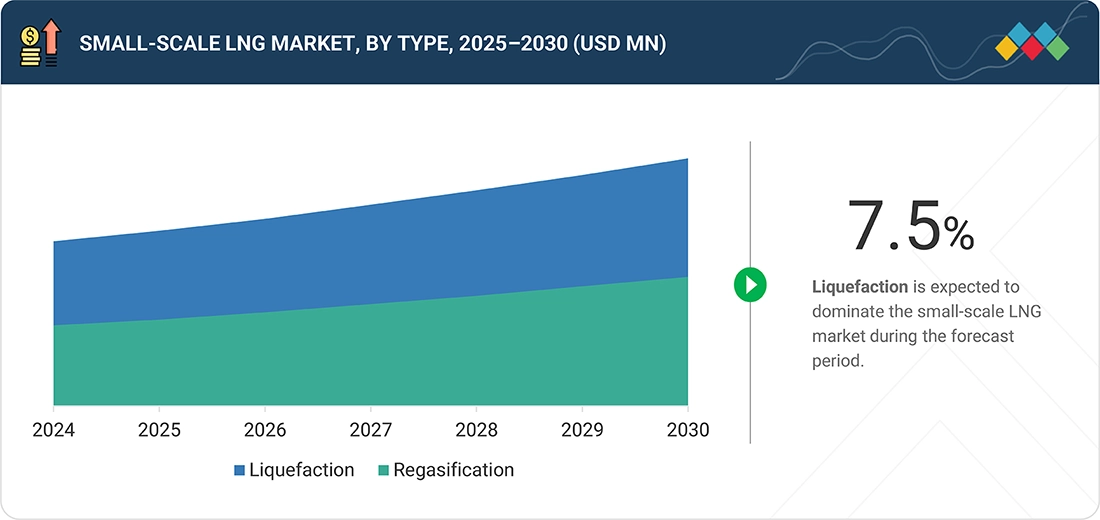
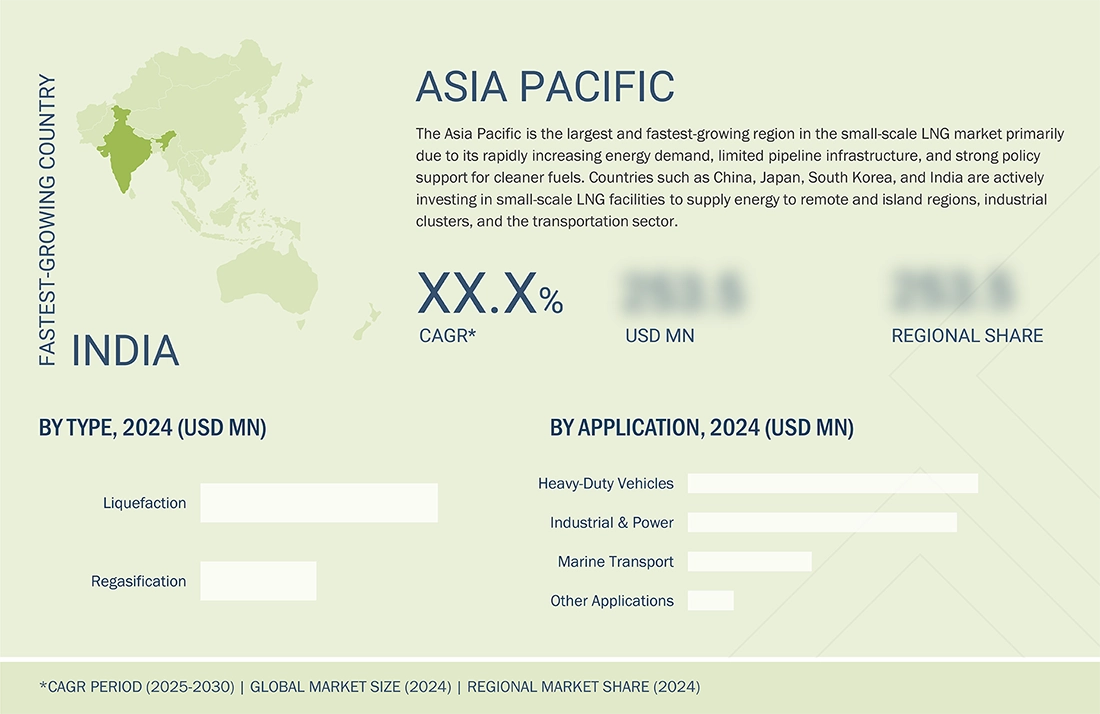
BY TYPEThe small-scale LNG market is segmented by type into liquefaction and regasification. Liquefaction holds the largest share of the market as it is widely used, driven by the growing demand for decentralized energy supply and LNG use in off-grid power, transport, and industrial applications. However, regasification is emerging as the fastest-growing segment, driven by its increasing adoption to satisfy energy needs for cooking, heating, power, or fuel in remote towns, islands, and small factories where building large infrastructure is not feasible.
-
BY MODE OF SUPPLYThe small-scale LNG market by mode of supply is segmented into trucks, trans-shipment & bunkering, and other modes of supply. Trucks dominate the market as the largest segment, being a cheap, easy, and flexible way to deliver LNG. Transshipment & bunkering form the fastest-growing segment due to the rapid adoption of LNG as a marine fuel driven by stricter international emissions regulations, such as the IMO 2020 standards.
-
BY APPLICATIONHeavy-duty vehicles form the largest market because more trucks and buses are switching from diesel to cleaner fuels. As countries try to reduce air pollution and meet climate goals, many are encouraging the use of LNG in transport. Small-scale LNG helps by making LNG available in small fuel stations along highways or near industrial areas. Marine transport is the fastest-growing segment, mainly due to the maritime industry’s shift toward cleaner fuels to meet stringent global emission standards, especially those set by the International Maritime Organization (IMO). LNG offers a cost-effective and environmentally friendly alternative to traditional marine fuels like heavy fuel oil, significantly reducing sulfur oxide, nitrogen oxide, and carbon emissions.
-
BY REGIONThe Asia Pacific is the largest and fastest-growing region, primarily due to its rapidly increasing energy demand, limited pipeline infrastructure, and increasing policies supporting cleaner fuels. Countries such as China, Japan, South Korea, and India are actively investing in small-scale LNG facilities to supply energy to remote and island regions, industrial clusters, and the transportation sector. Additionally, the region’s expanding LNG import capacity, government initiatives to cut emissions, and growing use of LNG as a marine and vehicle fuel are driving robust market expansion.
-
COMPETITIVE LANDSCAPEThe major market players have adopted both organic and inorganic strategies. Linde (Germany), Wärtsilä Corporation (Finland), Honeywell International (US), Engie (France), Shell (UK), Total Energies (France), Gasum (Finland), Chart Industries (US) have entered into agreements and partnerships to cater to the growing demand for small-scale LNG across various applications.
The small-scale LNG market has been experiencing strong growth driven by increasing demand for cleaner and more flexible energy solutions, especially in regions without access to large pipeline infrastructure. Rising environmental regulations and the global push to reduce carbon emissions are encouraging the shift from conventional fuels like diesel and heavy fuel oil to LNG in transportation, industrial, and power generation sectors. Additionally, technological advancements in modular liquefaction and storage systems have lowered project costs, making small-scale LNG more viable for distributed energy applications.
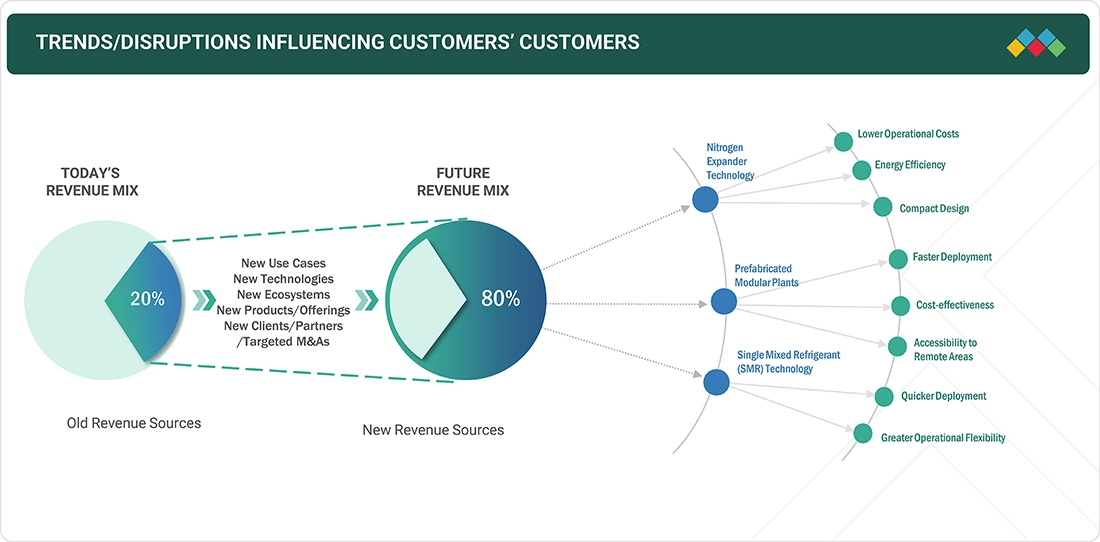
TRENDS & DISRUPTIONS IMPACTING CUSTOMERS' CUSTOMERS
The impact on consumers' businesses comes from customer trends or disruptions. The small-scale LNG market is shaped by emerging trends, disruptive technologies, and changing regulations. Increasing environmental and emission regulations, such as the IMO sulfur caps and the EU's FuelEU Maritime standards, are encouraging the use of advanced, modular liquefaction plants and floating storage units. Digital supply chain platforms and automated bunkering systems are also transforming traditional methods of energy distribution. These changes improve operational efficiency, cut greenhouse gas emissions and logistical costs, and expand energy access in remote areas, directly affecting cost structures and sustainability goals. Energy operators using these innovations can run cleaner, more reliable operations, strengthen infrastructure resilience, and meet decarbonization targets, while staying competitive in a more strict global energy market.
Source: Secondary Research, Interviews with Experts, MarketsandMarkets Analysis
MARKET DYNAMICS
Level
-
Advantages of small-scale plants

-
Environmental benefits and stringent regulations

Level
-
Limited infrastructure for LNG in Asia Pacific compared to other regions

-
Depletion of natural resources and volatility in raw material prices

Level
-
Integration of new technologies

-
Increasing adoption of LNG in heavy-duty trucks

Level
-
Supply chain disruptions, limited supply, and high retrofitting costs

Source: Secondary Research, Interviews with Experts, MarketsandMarkets Analysis
DRIVER: Environmental Benefits and Stringent Regulations
The small-scale LNG market is primarily driven by its positive environmental impact and the enforcement of stricter regulations. One significant factor is the use of small-scale LNG as a shipping fuel. To address air pollution caused by ships, the International Maritime Organization (IMO) introduced the IMO 2020 regulations, also known as the Sulphur Cap Regulation. These regulations limit the sulfur content in ship fuel to 0.50% mass by mass (m/m) outside emission control areas (ECAs) and 0.10% m/m within ECAs. The purpose of the IMO 2020 regulation is to combat air pollution, which is a significant contributor to acid rain, smog, and respiratory problems. Ships emit substantial amounts of sulfur oxide (SOx), making them a major source of air pollution. By enforcing stricter sulfur content limits, the IMO 2020 regulation aims to reduce SOx emissions from ships by up to 77%. In response to these regulations, many companies in the maritime sector have adopted sustainable strategies to reduce their environmental emissions. Publicly traded companies that have embraced such strategies have experienced faster growth compared to others. For example, product carriers, cruise ships, containerships, and ferry operators such as BC Ferries, Seaspan ULC, Carnival Cruise Line, and Unilever are increasingly transitioning to LNG as a fuel source. It is estimated that by 2025, approximately 80% of new cruise ships will be powered by LNG.
RESTRAINT: Depletion of natural resources and volatility in raw material prices
The depletion of natural resources and volatility in raw material prices are key constraints that greatly impact the growth of the small-scale LNG market. The US Energy Information Administration (EIA) estimates proved reserves by analyzing data from oil and gas companies annually. Their latest report, from late 2022, states that the total proven natural gas reserves in the US, including liquids, were approximately 691.1 trillion cubic feet (Tcf). Without liquids, dry natural gas reserves are about 653 Tcf. Additionally, drilling rigs dedicated to natural gas dropped by 32%, a decrease of 50 rigs. LNG production depends on extracting and processing natural gas, which is a limited resource. The rising demand for natural gas and LNG makes accessible reserves scarcer, increasing exploration costs and reducing production rates. This natural gas depletion is a major challenge for small-scale LNG projects, which typically have limited financial resources and struggle to compete with larger companies for long-term gas contracts.
OPPORTUNITY: Increasing adoption of LNG in heavy-duty trucks
LNG is recognized as a less damaging fossil fuel compared to other options available in the market. Many nations are moving toward adopting this resource as a transitional fuel. Additionally, its adoption in heavy-duty trucks is on the rise. LNG trucks have been shown to produce 15-20% lower tailpipe CO2 emissions than diesel while providing performance and range equivalent to diesel, leading fleets to make the switch. In Europe, there are approximately 786 fueling stations, and in China, the sales of LNG trucks are on the rise. India is following this trend, with plans to convert one-third of the country's heavy-duty truck fleet to LNG within the next 5-7 years. As infrastructure expands into more areas (including long-haul routes), it will enhance the viability of LNG production even for smaller local plants by ensuring dependable distribution channels. Consequently, the growth of LNG infrastructure for heavy-duty vehicles may enhance the small-scale LNG market.
CHALLENGE: Supply Chain Disruptions, Limited Supply, and High Retrofitting Costs
The small-scale LNG market faces several challenges that need to be addressed for its successful development. One significant challenge is the possibility of transport disruptions. Unlike large-scale LNG shipments that rely on specialized infrastructure and vessels, small-scale LNG shipments rely on smaller vessels or trucks for transportation. This can make the supply chain vulnerable to disruptions caused by adverse weather conditions, road or port closures, or logistical challenges. These disruptions can lead to delivery delays, affecting the reliability of small-scale LNG supply to end users. Another challenge is the limited volume of gas that can be supplied through small-scale LNG. Small-scale LNG facilities have relatively lower liquefaction capacities compared to large-scale plants. This limited volume can constrain the growing demand for natural gas in certain regions or industries. Multiple small-scale facilities may need to operate in parallel to supply an equivalent volume of gas that a single large-scale LNG plant can deliver. Coordinating and optimizing these multiple facilities can be complex and costly.
Small-Scale LNG Market: COMMERCIAL USE CASES ACROSS INDUSTRIES
| COMPANY | USE CASE DESCRIPTION | BENEFITS |
|---|---|---|
 |
In response to the growing interest in utilizing Pennsylvania's natural gas reserves for various industrial purposes, such as power generation, backup generation, and marine fueling, developers approached Chart with a requirement for a production plant capable of producing approximately 50,000 gallons per day. Chart specializes in small-scale LNG plants and plays a crucial role in the initial discussions of the project, focusing on configuring the plant design to minimize the overall plot size, which was successfully reduced to 300x300 feet or 92x92 meters. | Chart's Nitrogen Cycle technology successfully offered a user-friendly alternative to the complex mixed refrigerant operating model while maintaining comparable efficiencies to the MR process for the company's pipeline gas feedstock. As a result, the company was able to provide LNG from the plant for the pioneering truck-to-ship bunkering operations on the Great Lakes. This achievement has enabled the company to offer shipping companies a novel fuel choice that aligns with the increasingly stringent marine environmental regulations, thereby enhancing the market position of the company and meeting the industry's evolving needs. |
 |
Dragon LNG needed a flexible BOG handling system to liquefy BOG during zero gas send-out periods. Wärtsilä's BOG reliquefaction package (RP) offers quick response, adapting to different BOG compositions and flow rates, while minimizing standby power use to meet energy goals. It helps Dragon maintain a zero-gas flare policy, ensuring compliance and replacing the old power and steam plant to improve efficiency during gas send-out. Fully operational since early 2017, it includes refrigerant handling, coldbox, and LNG pumps. Wärtsilä’s proven LNG reliquefaction track record benefits Dragon by enabling efficient BOG management and keeping LNG cold. | The benefits of BOG reliquefaction include achieving maximum flexibility and energy efficiency while adhering to stringent environmental regulations. This process eliminates the need for flaring, ensuring compliance with zero-flare policies. By replacing the on-site cogeneration unit with BOG burning, higher yield factors can be achieved during periods of gas send-out to the National Gas Transmission System (NGTS).. |
Logos and trademarks shown above are the property of their respective owners. Their use here is for informational and illustrative purposes only.
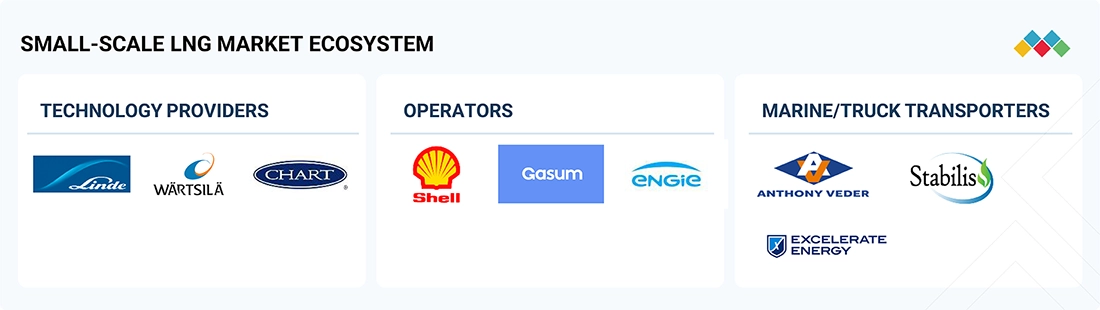
MARKET ECOSYSTEM
The small-scale LNG ecosystem comprises a network of technology providers, operators, and transporters working together to deliver LNG efficiently to decentralized markets. Technology providers supply modular liquefaction units, cryogenic storage tanks, regasification systems, and digital monitoring solutions that enable flexible and localized LNG production. Operators, including project developers, utilities, and bunkering service companies, manage liquefaction plants, storage terminals, and distribution hubs, ensuring reliable supply to end users across industries and remote regions. Marine and truck transporters form the logistical backbone, using small LNG carriers, bunker vessels, and cryogenic truck fleets to move LNG between terminals and customers. Together, this ecosystem enables cost-effective, safe, and scalable LNG delivery where conventional large-scale infrastructure is impractical.
Logos and trademarks shown above are the property of their respective owners. Their use here is for informational and illustrative purposes only.
MARKET SEGMENTS
Source: Secondary Research, Interviews with Experts, MarketsandMarkets Analysis
Small-scale LNG Market, By Type
Small-scale LNG liquefaction is poised to lead the market, converting natural gas into a liquid at very low temperatures for easier storage and transport. Advances in modular, cost-effective liquefaction units—smaller and easier to install—enable production in remote areas, providing clean energy where pipelines cannot reach. This growth reduces reliance on coal or diesel, making LNG projects quicker and more flexible, supporting low-cost, clean energy for small users.
Small-scale LNG Market, By Mode of Supply
Small-scale LNG supply via trucks is the largest and fastest-growing market. It is an easy, flexible way to deliver LNG where pipelines aren't available, reaching remote towns, factories, and fuel stations far from gas networks. Using trucks with special tanks allows quick, safe delivery to areas difficult for infrastructure like hills or islands, without the cost and time of laying pipelines. It helps industries and vehicles switch to cleaner fuel without waiting for gas connections. Trucks can refill storage tanks or supply LNG-powered vehicles. Overall, truck-based LNG supply expands access to clean energy efficiently and quickly, without large projects or delays.
Small-scale LNG Market, By Application
Small-scale LNG is the largest market in heavy-duty vehicles, as more trucks and buses switch from diesel to cleaner fuels. LNG offers more energy, is sometimes cheaper, and produces less pollution. Countries are promoting LNG to cut air pollution and meet climate goals. Small-scale LNG stations, built quickly along highways or near industrial areas, make LNG more accessible. These plants can be located close to demand, with small tankers delivering fuel to remote stations. This suits long-distance trucks, especially where CNG or electric charging may be unavailable. Lower fuel prices and government support are leading logistics companies to buy more LNG trucks. Overall, small-scale LNG helps make cleaner, accessible fuel, supporting the shift to environmentally friendly transportation.
REGION
Asia Pacific experienced strong polyols market growth in 2024, supported by industrialization, infrastructure development, and rising end-use demand
The utilization of small-scale LNG in the Asia Pacific region is experiencing rapid growth as numerous nations pursue clean and cost-effective energy sources. In island territories, remote locations, and smaller urban centers where constructing extensive pipelines or large-scale power plants presents challenges, small LNG proves indispensable. Countries such as China, India, Indonesia, the Philippines, and Thailand employ small LNG for providing electricity to villages, fueling trucks and ships, and supplying gas to factories lacking pipeline infrastructure. Small LNG facilities and transport vehicles, including trucks and ships, facilitate the distribution of LNG via road, sea, and to distant islands through small vessels. Notably, India and China utilize small LNG stations for heavy trucks, thereby reducing air pollution and operational costs. These developments are further supported by government policies, funding initiatives, and regulatory frameworks. Additionally, private sector investments are directed toward mini-LNG plants, refueling trucks, and ships. Overall, the expansion of small-scale LNG is driven by its ease of transportation, enhanced safety, environmentally superior profile compared to coal and diesel, and suitability for areas without pipeline access—thus advancing the dissemination of clean energy to broader populations and industrial sectors.
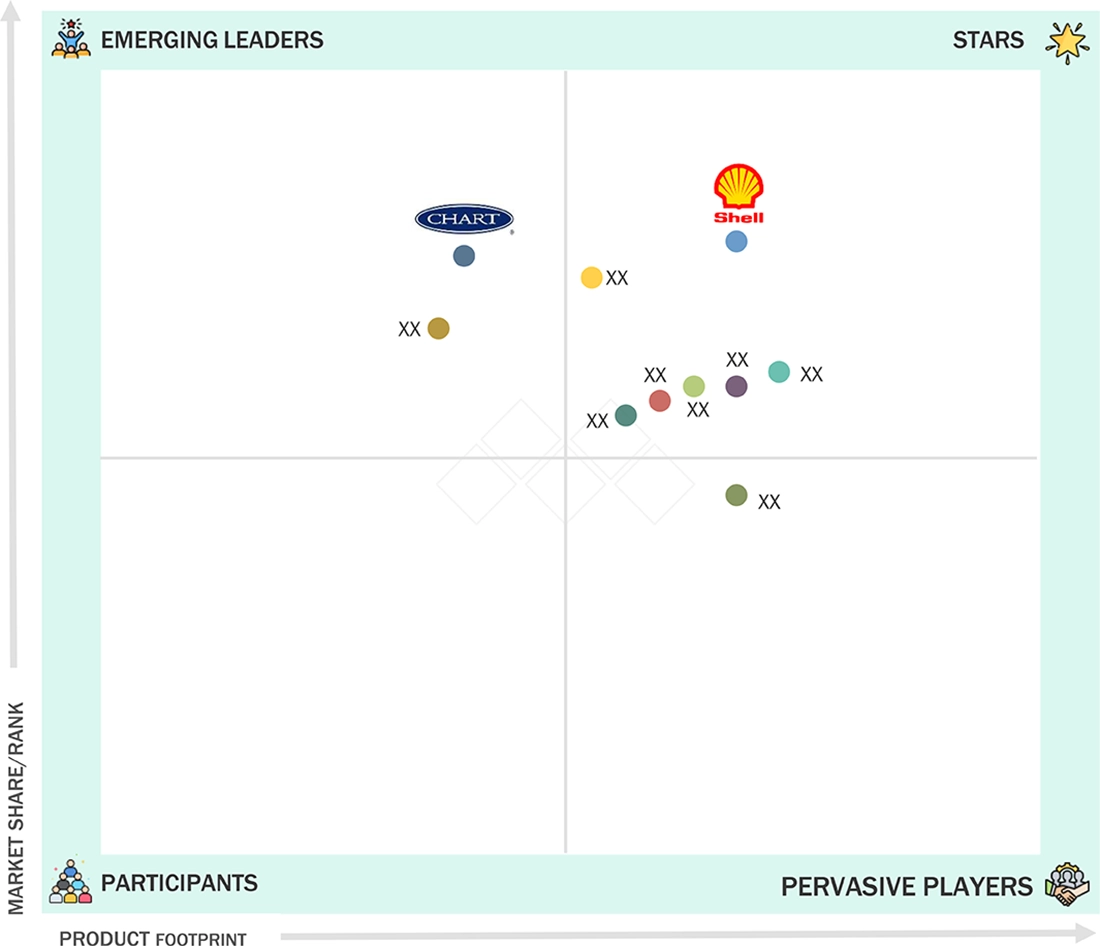
Small-Scale LNG Market: COMPANY EVALUATION MATRIX
The small-scale LNG market matrix indicates Shell (Star) as a formidable player, with its extensive global LNG value chain, advanced liquefaction and regasification technologies, and integrated infrastructure spanning production, distribution, and bunkering. The company leverages decades of LNG expertise to develop modular, flexible, and cost-efficient SSLNG solutions that enable off-grid power generation, industrial fuel switching, and cleaner transport for marine and heavy-duty vehicles. Chart Industries (Emerging Player) is gaining momentum due to its strong technological expertise in cryogenic equipment and integrated LNG solutions across the entire value chain. The company designs and manufactures key SSLNG infrastructure components, including small-scale liquefaction plants, storage tanks, vaporizers, and transport trailers. Enabling flexible, modular, and cost-efficient deployment.
Source: Secondary Research, Interviews with Experts, MarketsandMarkets Analysis
KEY MARKET PLAYERS
MARKET SCOPE
| REPORT METRIC | DETAILS |
|---|---|
| Market Size in 2024 (Value) | USD 20.6 Billion |
| Market Forecast in 2030 (Value) | USD 31.8 Billion |
| Growth Rate | CAGR of 7.5% from 2025 to 2030 |
| Years Considered | 2021–2030 |
| Base Year | 2024 |
| Forecast Period | 2025–2030 |
| Units Considered | Value (USD Million/Billion), Volume (MTPA) |
| Report Coverage | Revenue forecast, company ranking, competitive landscape, growth factors, and trends |
| Segments Covered |
|
| Regions Covered | North America, Asia Pacific, Europe, South America, and the Middle East & Africa |
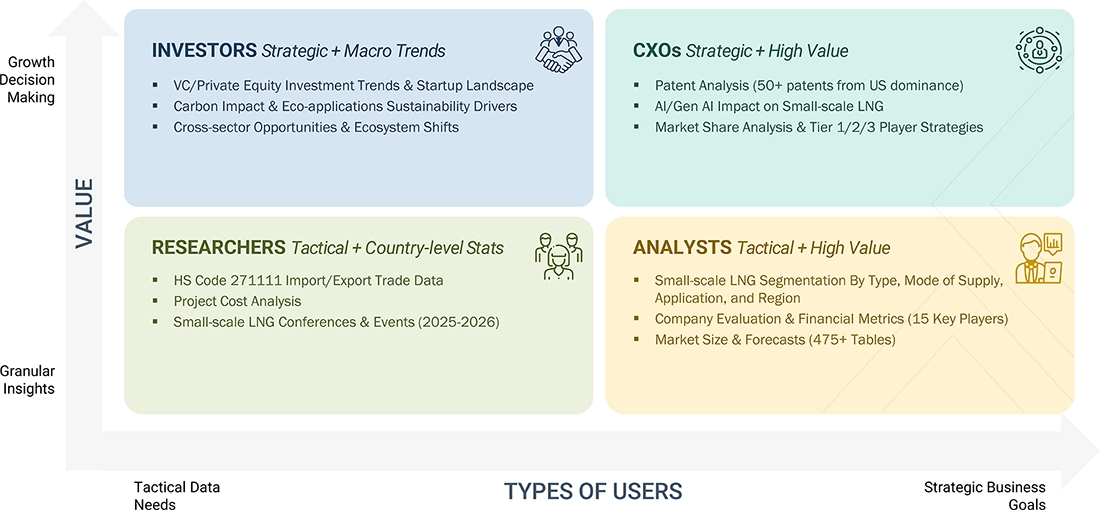
WHAT IS IN IT FOR YOU: Small-Scale LNG Market REPORT CONTENT GUIDE
DELIVERED CUSTOMIZATIONS
We have successfully delivered the following deep-dive customizations:
| CLIENT REQUEST | CUSTOMIZATION DELIVERED | VALUE ADDS |
|---|---|---|
| Europe-based LNG Player |
|
|
RECENT DEVELOPMENTS
- April 2025 : Shell Eastern Trading Pte. Ltd., a subsidiary of Shell plc, acquired Pavilion Energy, a move that strengthens Shell’s global LNG portfolio and trading capabilities. Pavilion Energy is a global LNG trading business with a supply capacity of approximately 6.5 million tons per annum (mtpa). This acquisition will enhance Shell’s small-scale LNG business by expanding its access to LNG supply, infrastructure, and customer base in key Asian markets.
- March 2025 : Wärtsilä Corporation entered into a contract with Hudong-Zhonghua Shipbuilding (Group) Co., Ltd. to supply three Wärtsilä 25DF dual-fuel engines with NextDF technology for a new 18,600 m³ LNG bunkering vessel being built for Spanish operator Ibaizabal. The NextDF feature significantly reduces methane and nitrogen oxide emissions, making the vessel one of the most environmentally friendly in its class.
- February 2025 : Gasum Oy and Swedish company Sirius Shipping formed a joint venture to own a new state-of-the-art LNG and bio-LNG bunker vessel, named Celsius, scheduled for delivery in 2027. The vessel will enhance LNG and bio-LNG availability for Gasum Oy’s maritime customers in Northwestern Europe, supporting the growing demand for cleaner marine fuels and advancing both companies’ strategic ambitions in small-scale LNG.
- September 2024 : Honeywell International Inc. completed its USD 1.81 billion acquisition of Air Products' liquefied natural gas (LNG) process technology and equipment business. This move strengthens Honeywell's energy transition portfolio, expanding its end-to-end LNG solutions for global customers.
- February 2023 : Elengy, a subsidiary of ENGIE S.A., agreed with Delta Rail, a transportation company. This agreement aims to introduce a new service for loading LNG containers from multimodal platforms in Europe. This agreement will allow customers to load LNG containers onto Delta Rail's wagons at Elengy's LNG terminals in France and Belgium, then transport them to their final destinations by rail. This agreement is expected to reduce the cost and environmental impact of transporting LNG by enabling the transportation of LNG containers by rail over longer distances.
Table of Contents
 Exclusive indicates content/data unique to MarketsandMarkets and not available with any competitors.
Methodology
The study involved four major activities to estimate the current size of the global small-scale LNG market. Exhaustive secondary research was carried out to collect information on the market, the peer product market, and the parent product group market. The next step was to validate these findings, assumptions, and sizes with the industry experts across the value chain of small-scale LNG through primary research. The top-down and bottom-up approaches were employed to estimate the overall size of the small-scale LNG market. After that, market breakdown and data triangulation procedures were used to determine the size of different segments and subsegments of the market.
Secondary Research
The market for the companies offering small-scale LNG is arrived at through secondary data available through paid and unpaid sources, analyzing the product portfolios of the major companies in the ecosystem, and rating the companies by their performance and quality. Various secondary sources, such as Business Standard, Bloomberg, World Bank, and Factiva, were referred to identify and collect information for this study on the small-scale LNG market. In the secondary research process, various secondary sources were referred to identify and collect information related to the study. Secondary sources included annual reports, press releases, and investor presentations of small-scale LNG vendors, forums, certified publications, and whitepapers. The secondary research was used to obtain critical information on the industry’s value chain, the total pool of key players, market classification, and segmentation from the market and technology-oriented perspectives.
Primary Research
In the primary research process, various primary sources from both the supply and demand sides were interviewed to obtain qualitative and quantitative information for this report. The primary sources from the supply side included industry experts, such as Chief Executive Officers (CEOs), Vice Presidents (VPs), marketing directors, technology and innovation directors, and related key executives from several key companies and organizations operating in the small-scale LNG market. After the complete market engineering (calculations for market statistics, market breakdown, market size estimations, market forecasting, and data triangulation), extensive primary research was conducted to gather information and verify and validate the critical numbers arrived at. Primary research was also conducted to identify the segmentation types, industry trends, competitive landscape of small-scale LNG offered by various market players, and key market dynamics, such as drivers, restraints, opportunities, challenges, industry trends, and key player strategies. In the complete market engineering process, the top-down and bottom-up approaches and several data triangulation methods were extensively used to perform the market estimation and market forecasting for the overall market segments and subsegments listed in this report. Extensive qualitative and quantitative analysis was performed on the complete market engineering process to list the key information/insights throughout the report.

Note: Other designations include sales, marketing, and product managers.
Tier 1: >USD 1 Billion; Tier 2: USD 500 Million–1 Billion; and Tier 3: < USD 500 Million
To know about the assumptions considered for the study, download the pdf brochure
Market Size Estimation
The top-down and bottom-up approaches were used to estimate and validate the size of the global small-scale LNG market. These approaches were also used extensively to estimate the size of various dependent market segments. The research methodology used to estimate the market size included the following:

Data Triangulation
After arriving at the overall market size using the market size estimation processes, the market was split into several segments and subsegments. The data triangulation and market breakup procedures were employed, wherever applicable, to complete the overall market engineering process and arrive at the exact statistics of each market segment and subsegment. The data was triangulated by studying various factors and trends from both the demand and supply sides.
Market Definition
Small-scale LNG is the use of liquefied natural gas (LNG) in small quantities instead of large volumes. It is utilized in locations where large LNG ships or pipelines are neither required nor feasible. Small-scale LNG transportation involves transporting this liquid gas to towns, factories, or islands using smaller trucks, ships, or containers. It is mainly used in situations where constructing a large gas pipeline would be too costly or impractical. It is transported using a variety of supply methods, including micro terminals, trucks, ships, bunkering, and ISO containers. Small-scale LNG is utilized for many purposes, like power generation, industrial use, marine transportation, and fuel for heavy-duty vehicles.
Stakeholders
- Small-scale LNG Manufacturers
- LNG Producers
- Shipping Regulatory Bodies
- Distributors and Traders
- Industry Associations
- Government Bodies
- End Users
Report Objectives
- To define, describe, and forecast the size of the global small-scale LNG market based on type, modes of supply, application, and region in terms of value and volume
- To provide detailed information on the significant drivers, restraints, opportunities, and challenges influencing the market
- To strategically analyze micromarkets concerning individual growth trends, prospects, and their contribution to the market
- To assess the growth opportunities in the market for stakeholders and provide details on the competitive landscape for market leaders
- To forecast the market size of segments and subsegments for North America, Europe, Asia Pacific, South America, and the Middle East & Africa
- To strategically profile key players and comprehensively analyze their market shares and core competencies
- To analyze competitive developments such as product launches, acquisitions, expansions, partnerships, and agreements in the small-scale LNG market
- To provide the impact of AI/Gen AI on the market.
Key Questions Addressed by the Report
What is the major driver influencing the growth of the small-scale LNG market?
The major drivers are advantages of small-scale plants over large-scale plants, environmental benefits, stringent regulations, fiscal regime, and government subsidies.
What are the major challenges to the growth of the small-scale LNG market?
Supply chain disruptions, limited supply, and high retrofitting costs.
What are the major opportunities in the small-scale LNG market?
Integration of new technology presents a significant opportunity for market growth.
What are the major factors restraining the growth of the small-scale LNG market?
Limited LNG receiving terminal infrastructure in Asia Pacific compared to other regions, depletion of natural resources, and volatility in prices of raw materials.
Who are the major players in the small-scale LNG market?
Linde plc (US), Wartsila Corporation (Finland), Honeywell International Inc. (US), Shell plc (UK), and ENGIE S.A (France).
Need a Tailored Report?
Customize this report to your needs
Get 10% FREE Customization
Customize This ReportPersonalize This Research
- Triangulate with your Own Data
- Get Data as per your Format and Definition
- Gain a Deeper Dive on a Specific Application, Geography, Customer or Competitor
- Any level of Personalization
Let Us Help You
- What are the Known and Unknown Adjacencies Impacting the Small-Scale LNG Market
- What will your New Revenue Sources be?
- Who will be your Top Customer; what will make them switch?
- Defend your Market Share or Win Competitors
- Get a Scorecard for Target Partners

Custom Market Research Services
We Will Customise The Research For You, In Case The Report Listed Above Does Not Meet With Your Requirements
Get 10% Free CustomisationTESTIMONIALS

We at Nissan Chemicals Corporation have been clients of MarketsandMarkets for more than a year now. We recently consulted MarketsandMarkets for a study, the team at MarketsandMarkets was extremely professional and organized. The business insights were very detailed and aligned well with our expectations that really helped us formulate the Business Plans and device new strategies for development themes. MarketsandMarkets offers a unique combination of expertise and dedicated engagement model. Their research findings have helped us in designing our Pricing Strategy which will make it easier for us to predict the future sales and profits for the next ten years. We look forward to working with MarketsandMarkets in the future.
VP of Strategy & New Business Development
Leading Specialty Chemical Company
The MarketsandMarkets Engagement Model, composed of both the Knowledge Store and advisory custom research, has greatly helped us in understanding our markets and making strategic decisions. The Knowledge Store is a fast way to allow everyone in our organization to understand more about most any market they are interested in. The ability to then get custom research done and get answers to specific strategic questions and market insight has been spectacular. The Markets and Markets team feel more like colleagues than vendors and their services have helped us change our culture where statements of things like growth opportunities and competitive position are always backed by industry research.

Rich Gibson,
Director, Corporate Strategy
Milliken & Company,
Leading Industrial Manufacturer of specialty chemical, floor covering, performance and protective textile materials, and healthcaremilliken.com
MarketsandMarkets is a trusted resource that helps us to better understand markets that are near-adjacencies-whether its technology, value chain or geography. Their Knowledge Store platform provides a dashboard of markets and their characteristics which is easy to use and saves us time.
Adam Shaw,
Market Development and Strategy Manager
AdvanSix Inc. USA,
An American Leader in Chemicalswww.advansix.com
The Knowledge Store from MarketsandMarkets is a valuable tool which has helped my team acquire greater insight in to the end markets that our business serves. This has enabled us to help our company build stronger strategies throughout our planning process.
TOSHIO KINOSHITA
Senior Chif Consultion Research & Consulting Division
Mitsubishi Chemical Research Corporation,
Leading Manufacturer of Chemical Productswww.mitsubishichem-res.co.jp/en/

We recently engaged with MarketsandMarkets for a study, the team not only clearly understood our business objectives but was also extremely professional in the way they handled the entire project. The study was efficiently conducted in a phase-wise manner, and the engagement model furnished us with high-quality business insights that far exceeded our expectations at each phase. We were especially happy that MarketsandMarkets could provide us with both, an English as well as a Japanese version of the study. A special thanks to the Analyst Team and Client Services Team, whose fluency in Japanese enhanced our comfort level, as we could converse with them in our preferred language.
Independent entrepreneurs
Arrow Precision
We approached MarketsandMarkets for study on Proppants Market, and their work exceeded our expectations. The study conducted was comprehensive and enabled us to view the market through the various dimensions. In addition, the team was extraordinarily responsive throughout the process and resolved our queries on time. I strongly recommend MarketsandMarkets and will certainly consider them for additional market assessments we will need in the future.
Global engineering company, Japan
Deputy Manager,
Strategic Planning OfficeThe high-quality insights shared by the MarketsandMarkets team helped us understand the pharmaceutical plant designers in a specific geography. It also captured the risks that we may likely face in communicating with our potential partners. The study would enable us identify partners, which would impact our future growth.


Growth opportunities and latent adjacency in Small-Scale LNG Market