Smart Manufacturing Market

Smart Manufacturing Market Size, Share, Statistics and Industry Growth Analysis Report by Technology (3D printing, Al in Manufacturing, Automated guided vehicle, Condition Monitoring, Cybersecurity, Digital Twin, HMI, Machine Vision, MES, PAM, Robot, Sensor), Industry, Region - Global Forecast to 2028

Report Code: SE 6677 Aug, 2023, by marketsandmarkets.com

[340 Pages Report] The global Smart Manufacturing Market Size is expected to grow from USD 108.9 Billion in 2023 to USD 241.0 Billion by 2028, registering a CAGR of 17.2%.

Smart manufacturing is being pushed forward by important factors. New technologies like IoT, AI, and automation are changing how things are made. This makes things more efficient, helps predict when things need fixing, gives useful information from data, and cuts down on how much it costs to run things. Smart manufacturing Industry is liked because it can watch things as they happen, make work smoother, and help make smart decisions, which helps businesses compete and come up with new ideas.

The smart manufacturing market size is expanding rapidly as companies across various industries embrace digital transformation and automation. Smart manufacturing refers to the integration of advanced technologies and processes to optimize production, improve efficiency, and enhance overall operations. With the increasing adoption of Internet of Things (IoT), artificial intelligence (AI), and machine learning (ML), the smart manufacturing industry is poised for substantial growth.

The smart manufacturing industry is witnessing significant growth across various sectors, including automotive, aerospace, food and beverages, pharmaceuticals, and electronics. The automotive sector, in particular, is a major contributor to the smart manufacturing market size. With the rise of electric vehicles (EVs) and autonomous driving technologies, automotive manufacturers are investing heavily in smart manufacturing solutions.

Smart Manufacturing Market

The smart manufacturing market is witnessing a surge in demand due to several factors. Firstly, organizations are realizing the benefits of smart manufacturing, such as reduced costs, increased productivity, and improved quality control. Additionally, the need for real-time data analytics and predictive maintenance is driving the adoption of smart manufacturing solutions. Moreover, government initiatives and incentives to promote industrial automation are further fueling the growth of the smart manufacturing industry.

Smart Manufacturing Market

Smart Manufacturing Market Forecast to 2028

To know about the assumptions considered for the study, Request for Free Sample Report

Smart Manufacturing Market Dynamics

Driver: Surging demand for software systems that reduce time and cost

Unplanned downtime and production waste severely affect manufacturers. Hence, they are looking for a system that can determine possible defects and failures in advance to avoid future losses. The use of technologies such as Plant Asset Management (PAM), industrial 3D, and digital twin enables reducing excess time and cost required in manufacturing.

PAM solutions enable users to determine possible failures at the production level well in advance and also provide required corrective actions in real-time. The solutions collect necessary data, analyze it, and then determine any failure at the component or process level. They have the capability to implement corrective actions on a real-time basis and offer predictive as well as proactive maintenance approaches that help in predicting failures with high degrees of accuracy.

Additionally, a digital twin is a representation of the data collected based on a physical model, which reflects the replicated operating conditions of a system or process, such as performance, faults, and failure mode, in the real world. By implementing digital twins, engineers can optimize a product’s performance by modifying the physical prototype that changes at every instance during the design phase. Hence, creating a digital prototype with a digital twin can be used to run simulations and can be modified at any instance at a lesser time and with minimal costs.

Restraint: Lack of standardization among equipment manufacturers and in connectivity protocols

A major problem of many industrial devices and equipment is the lack of standardization in the equipment and protocols being used. Due to this, there are cases of mismatch occurring in many of the existing databases. There are many communication protocols being used for industrial communications, and there are a few vendors offering communication modules supporting most of the protocols. On the other hand, many vendors offer customized communication modules supporting a few other communication protocols. Thus, end users may find it difficult to switch to other protocols depending on their requirements. The lack of standardization with respect to technology complicates the integration of systems and hinders the plug-and-play capabilities between communication devices. For example, many vendors offer hardware systems required for industrial wireless sensor networks (IWSN), but end users often need to deploy software from other vendors. In such a scenario, it is essential to develop a complete solution or allow wide compatibility and a higher degree of flexibility in terms of operation and design.

The interoperability and easy exchange of information among connected devices is of utmost importance for the further growth of IIoT. The current technical and market scenarios pertaining to IIoT do not seem to provide a promising architectural solution or a universal standard to solve the interoperability issue. An urgent requirement for a universal standard in either connectivity type, data formatting, or protocol is likely to arise owing to the fact that IIoT is not just a network of internet-connected machines but of machines, and humans, among others. Currently, there are more than ten major players in the IIoT market, and these players have formed an alliance with other players in the market. Each of these alliances wants its technology or communication standard to be established as the only standard for the overall IIoT landscape. Thus, the non-standardization of communication protocols is restricting the Smart Manufacturing Market Growth.

Opportunity: Increase in adoption of IIoT and Cloud technologies

Ilot is like using special factory tools to make things better and faster. It connects machines to work smarter. This is changing how factories work by using devices that can think independently. They help factories become more automatic, which helps the people who own the factories make more money. Ilot also lets people see data from parts of the factory that were hard to reach. This makes things work better and helps the factory run smoothly. Big companies like ABB, Microsoft, Amazon, Bosch, and Hitachi use Ilot to improve their business. When IIoT is used in factories, it creates information. This information needs a special place to be kept, and that’s where Cloud computing comes in. Cloud computing uses the Internet to store and manage information, which saves companies from having to build and take care of their data places. Cloud with IIoT infrastructure offers manufacturers several benefits, such as data monitoring, increasing profit margin, reducing overheads, and enhancing the scalability for discrete manufacturing. Some major public Cloud vendors include Microsoft, Amazon Web Services, and Google Inc.

Challenge: Lack of skilled workforce

The anticipated rise in operational efficiency and reliance on data-driven procedures will necessitate the development of fresh skill sets among employees. This might give rise to a skill disparity between newly hired workers and those who have undergone training. Contemporary businesses actively embrace emerging technologies while grappling with a need for an adept and highly skilled workforce. Also, despite the increasing popularity of digitalization, many organizations need to be aware of the capabilities of digital twin technology due to their complex structure and the lack of process understanding. For example, creating a digital twin of an asset/processor to deploy IIoT demands various technologies, skillsets, and trained workers to handle the latest equipment and software systems. The digital change will lead to a change in the specifications of skills required for employees at different stages of the value chain, starting from development to sales and marketing. For this, existing workers must be trained to operate new systems. For instance, the oil & gas industry in the US is now struggling to find skilled workers to explore the abundant source of gas in shale rocks, thus risking the USD 100 billion invested in planned petrochemical projects. In addition, due to the lack of a skilled workforce, developing countries need help implementing smart manufacturing and next-level industrialization efficiently.

Smart Manufacturing Market Ecosystem

Component suppliers and system integrators have witnessed a decline in production activities. Consequently, OEMs have needed more essential components. The figure below shows the Smart Manufacturing ecosystem.

Smart Manufacturing Market by Ecosystem

Manufacturing Execution System to hold largest market share in 2022.

In the smart manufacturing market share, Manufacturing Execution Systems (MES) are becoming increasingly significant. These systems help oversee and manage various manufacturing processes, ensuring smooth operations, quality control, and efficient production. MES integrates data from different parts of the manufacturing process, allowing real-time monitoring, tracking, and optimization. This enhances productivity, reduces errors, and contributes to the overall advancement of smart manufacturing practices.

Industrial Sensors to hold largest market share in 2022.

In smart manufacturing, industrial sensors are important tools. They can measure things like temperature, pressure, and movement. These sensors give us quick information to make smart decisions and improve how things are done. They help things work better, ensure quality, and even predict when they need fixing. These sensors are useful in smart manufacturing to make things run smoothly and stay competitive.

Aerospace Industry is expected to register highest CAGR during the forecast period

The aerospace industry is benefiting greatly from the adoption of smart manufacturing. Using advanced technology, it’s making airplane production smarter and more effective. Robots, computers, and sensors team up to create aircraft and components, improving quality, reducing errors, and saving time. Smart manufacturing is crucial in shaping safer and more creative airplanes, leading to enhanced travel experiences for everyone.

North America to grow at highest CAGR during the forecast period.

Smart Manufacturing Market by Region

Smart Manufacturing Market Statistics by Region

To know about the assumptions considered for the study, download the pdf brochure

North America is a well-established hub for industrial automation, boasting advanced technology and innovative manufacturing methods. This prowess fuels the expansion of the smart manufacturing market in the region. A positive business climate in the US, accompanied by government initiatives like tax code reforms, substantial support packages for manufacturing and infrastructure, and major tech players’ presence, further accelerates the adoption of smart manufacturing. Factors such as prioritizing efficient asset use, stricter workplace safety regulations, and heightened awareness about ensuring product quality in industries like oil & gas, chemicals, and food & beverages drive the demand for machine condition monitoring systems and plant asset management solutions across North America.

Key Market Players

The Smart Manufacturing companies players have implemented various organic and inorganic growth strategies, such as product launches, partnerships, acquisitions, and collaborations, to strengthen their offerings in the market. The major players in the market are 3D System, Inc. (US), ABB (Switzerland), Cisco System, Inc. (US), Emerson Electric Co. (US), General Electric (US), Honeywell International Inc. (US), IBM (US), Mitsubishi Electric Corporation (Japan), Rockwell Automation (US), Schneider Electric (France), Siemens (Germany), Oracle (US), SAP (Germany), Stratasys (US), Yokogawa Electric Corporation(Japan).

The study includes an in-depth competitive analysis of these key players in the Smart Manufacturing market with their company profiles, recent developments, and key market strategies.

Smart Manufacturing Market Report Scope

Report Metric

Details

Estimated Market Size in 2023

USD 108.9 Billion

Projected Market Size in 2028

USD 241.0 Billion

Growth Rate

CAGR of 17.2%

Market size available for years

2019—2028

Base year

2022

Forecast period

2023—2028

Forecast Units

USD Millions/USD Billions and Million Units

Segments Covered

By Information Technology, By Enabling Technology, By Industry, and by Region

Geographic regions covered

North America, Asia Pacific, Europe, and the Rest of the World

Companies covered

3D System, Inc. (US), ABB (Switzerland), Cisco System, Inc. (US), Emerson Electric Co. (US), General Electric (US), Honeywell International Inc. (US), IBM (US), Mitsubishi Electric Corporation (Japan), Rockwell Automation (US), Schneider Electric (France), Siemens (Germany), Oracle (US), SAP (Germany), Stratasys (US), Yokogawa Electric Corporation(Japan) and  total of 25 players covered

Smart Manufacturing Market Highlights

This report has segmented the Smart Manufacturing market based on information technology, enabling technology and region.

Segment

Subsegment

By Information Technology

  • Human Machine Interface
  • Plant Asset Management
  • Warehouse Management System
  • Manufacturing Execution System

By Enabling Technology

  • Industrial 3D printing
  •  Robots
  •  Industrial Sensors
  •  AI in Manufacturing
  •  Machine Condition Monitoring
  •  Industrial Machine Vision
  •  Industrial Cybersecurity
  •  Digital Twin
  •  AGV
  • AR & VR in Manufacturing
  • 5G Industrial IoT

By Industry

  • Process Industry
    • Oil & Gas
    •  Food & Beverages
    •  Pharmaceuticals
    •  Chemicals
    •  Energy & Power
    •  Metal & Mining
    •  Pulp & paper
    •  Others
  • Discrete Industry
    • Automotive
    •  Aerospace & Defense
    •  Semiconductor & Electronics
    •  Medical Devices
    •  Machine Manufacturing
    •  Others

By Region

  • North America
    • US
    • Canada
    • Mexico
  • Europe
    • UK
    • Germany
    • France
    • Rest of Europe
  • Asia Pacific
    • China
    • Japan
    • India
    • Rest of Asia Pacific
  • Rest of the World
    • Middle East & Africa
    • South America

Recent Developments:

  • In June 2023, Honeywell unveiled its latest innovation, the Honeywell Digital Prime solution—a cloud-based digital twin designed to streamline the monitoring, management, and testing of process control changes and system modifications. This cost-effective tool empowers users to conduct frequent testing, leading to heightened precision in results and a notable reduction in the need for reactive maintenance.
  • In April 2023, Siemens Digital Industries launched Industrial Operations X, an open and interoperable portfolio designed to automate and manage industrial production. It is part of Siemens Xcelerator, an open digital business platform with software, connected hardware, a partner ecosystem, and a marketplace.
  • In April 2023, Stratasys, a leading company in polymer 3D printing, introduced its latest offering, GrabCAD Print Pro software, which includes integrated quality assurance features from Riven, a recent Stratasys acquisition. This advanced software manages the print preparation process for Stratasys 3D printers, catering to manufacturers seeking efficient production of end-use parts at scale. It focuses on enhancing printed-part accuracy, minimizing waste, and reducing time to production.

Frequently Asked Questions (FAQ):

To speak to our analyst for a discussion on the above findings, click Speak to Analyst

TABLE OF CONTENTS
 
1 INTRODUCTION (Page No. - 41)
    1.1 STUDY OBJECTIVES 
    1.2 MARKET DEFINITION 
    1.3 INCLUSIONS AND EXCLUSIONS 
    1.4 STUDY SCOPE 
           1.4.1 MARKETS COVERED
                    FIGURE 1 SMART MANUFACTURING MARKET SEGMENTATION
           1.4.2 REGIONAL SCOPE
           1.4.3 YEARS CONSIDERED
           1.4.4 CURRENCY CONSIDERED
    1.5 LIMITATIONS 
    1.6 STAKEHOLDERS 
    1.7 SUMMARY OF CHANGES 
    1.8 RECESSION IMPACT 
 
2 RESEARCH METHODOLOGY (Page No. - 46)
    2.1 INTRODUCTION 
           FIGURE 2 SMART MANUFACTURING MARKET: RESEARCH DESIGN
           2.1.1 SECONDARY AND PRIMARY RESEARCH
                    2.1.1.1 Key industry insights
           2.1.2 SECONDARY DATA
                    2.1.2.1 List of major secondary sources
                    2.1.2.2 Key data from secondary sources
           2.1.3 PRIMARY DATA
                    2.1.3.1 Breakdown of primaries
                    2.1.3.2 Key data from primary sources
    2.2 MARKET SIZE ESTIMATION METHODOLOGY 
           FIGURE 3 MARKET SIZE ESTIMATION METHODOLOGY
           2.2.1 BOTTOM-UP APPROACH
                    2.2.1.1 Approach to arrive at market size using bottom-up approach (demand side)
                               FIGURE 4 MARKET SIZE ESTIMATION METHODOLOGY: BOTTOM-UP APPROACH
           2.2.2 TOP-DOWN APPROACH
                    2.2.2.1 Approach to arrive at market size using top-down approach (supply side)
                               FIGURE 5 MARKET SIZE ESTIMATION METHODOLOGY: TOP-DOWN APPROACH
    2.3 MARKET BREAKDOWN AND DATA TRIANGULATION 
           FIGURE 6 MARKET BREAKDOWN AND DATA TRIANGULATION
    2.4 RESEARCH ASSUMPTIONS 
           FIGURE 7 MARKET: RESEARCH ASSUMPTIONS
    2.5 APPROACH TO ANALYZE RECESSION IMPACT 
    2.6 RISK ASSESSMENT 
           TABLE 1 MARKET: RISK ASSESSMENT
 
3 EXECUTIVE SUMMARY (Page No. - 56)
    FIGURE 8 WAREHOUSE MANAGEMENT SYSTEM (WMS) SEGMENT TO DEPICT HIGHEST CAGR BETWEEN 2023 AND 2028
    FIGURE 9 DIGITAL TWIN SEGMENT TO ACCOUNT FOR LARGEST MARKET SHARE IN 2028
    FIGURE 10 ENERGY & POWER SEGMENT TO HOLD LARGEST MARKET SHARE IN 2028
    FIGURE 11 AUTOMOTIVE SEGMENT TO DOMINATE SMART MANUFACTURING MARKET DURING FORECAST PERIOD
    FIGURE 12 NORTH AMERICA TO EXHIBIT HIGHEST CAGR DURING FORECAST PERIOD
 
4 PREMIUM INSIGHTS (Page No. - 61)
    4.1 ATTRACTIVE GROWTH OPPORTUNITIES FOR PLAYERS IN SMART MANUFACTURING MARKET 
           FIGURE 13 EMPHASIS ON REAL-TIME DATA ANALYSIS AND PREDICTIVE MAINTENANCE TO CONTRIBUTE TO MARKET GROWTH
    4.2 SMART MANUFACTURING MARKET, BY INFORMATION TECHNOLOGY 
           FIGURE 14 WAREHOUSE MANAGEMENT SYSTEM (WMS) SEGMENT TO DEPICT HIGHEST CAGR DURING FORECAST PERIOD
    4.3 SMART MANUFACTURING MARKET, BY ENABLING TECHNOLOGY 
           FIGURE 15 INDUSTRIAL SENSORS SEGMENT TO HOLD LARGEST MARKET SHARE IN 2023
    4.4 SMART MANUFACTURING MARKET, BY PROCESS INDUSTRY 
           FIGURE 16 CHEMICALS SEGMENT TO HOLD LARGEST SHARE OF MARKET IN 2023
    4.5 SMART MANUFACTURING MARKET, BY DISCRETE INDUSTRY 
           FIGURE 17 AEROSPACE SEGMENT TO REGISTER AT HIGHEST CAGR BETWEEN 2023 AND 2028
    4.6 SMART MANUFACTURING MARKET, BY REGION 
           FIGURE 18 NORTH AMERICA TO HOLD LARGEST SHARE OF MARKET IN 2028
    4.7 SMART MANUFACTURING MARKET, BY COUNTRY 
           FIGURE 19 MEXICO TO EXHIBIT AT HIGHEST CAGR IN MARKET DURING FORECAST PERIOD
 
5 MARKET OVERVIEW (Page No. - 65)
    5.1 INTRODUCTION 
    5.2 MARKET DYNAMICS 
           FIGURE 20 SMART MANUFACTURING MARKET: DRIVERS, RESTRAINTS, OPPORTUNITIES, AND CHALLENGES
           5.2.1 DRIVERS
                    5.2.1.1 Rising focus on enhancing manufacturing efficiency through automated production
                    5.2.1.2 Increasing government spending on 3D printing technologies
                    5.2.1.3 Pressing need to maintain regulatory compliance of industrial solutions
                    5.2.1.4 Surging demand for innovative technologies to reduce manufacturing downtime and production waste
                               FIGURE 21 SMART MANUFACTURING MARKET: DRIVERS AND THEIR IMPACT
           5.2.2 RESTRAINTS
                    5.2.2.1 Requirement for high initial capital investment
                    5.2.2.2 Lack of technical standards for smart manufacturing
                    5.2.2.3 Need for frequent technological upgrades
                               FIGURE 22 SMART MANUFACTURING MARKET: RESTRAINTS AND THEIR IMPACT
           5.2.3 OPPORTUNITIES
                    5.2.3.1 Rapid advancements in IIoT and cloud computing technologies
                    5.2.3.2 Rising adoption of automation by industrial players
                    5.2.3.3 Increasing investment in infrastructure development projects
                               FIGURE 23 SMART MANUFACTURING MARKET: OPPORTUNITIES AND THEIR IMPACT
           5.2.4 CHALLENGES
                    5.2.4.1 Increasing cyber risks to vulnerable industrial networks
                    5.2.4.2 Complex designs of advanced manufacturing solutions
                    5.2.4.3 Shortage of skilled workforce to handle smart manufacturing 
           FIGURE 24 MARKET: CHALLENGES AND THEIR IMPACT
    5.3 SUPPLY CHAIN ANALYSIS 
           FIGURE 25 MARKET: SUPPLY CHAIN ANALYSIS
    5.4 ECOSYSTEM ANALYSIS 
           FIGURE 26 SMART MANUFACTURING ECOSYSTEM
           TABLE 2 COMPANIES AND THEIR ROLES IN SMART MANUFACTURING ECOSYSTEM
    5.5 PRICING ANALYSIS 
           5.5.1 AVERAGE SELLING PRICE (ASP) OF INDUSTRIAL ROBOTS
                    TABLE 3 AVERAGE SELLING PRICE OF INDUSTRIAL ROBOTS, BY PAYLOAD CAPACITY
                    FIGURE 27 AVERAGE SELLING PRICE OF INDUSTRIAL ROBOTS OFFERED BY KEY PLAYERS, BY PRODUCT
                    TABLE 4 AVERAGE SELLING PRICE OF INDUSTRIAL ROBOTS OFFERED BY KEY PLAYERS, BY PRODUCT (USD)
                    TABLE 5 AVERAGE SELLING PRICES OF OPTICS, BY REGION (USD)
    5.6 TRENDS/DISRUPTIONS IMPACTING CUSTOMERS’ BUSINESSES 
           FIGURE 28 REVENUE SHIFTS AND NEW REVENUE POCKETS FOR PLAYERS IN SMART MANUFACTURING MARKET
    5.7 TECHNOLOGY ANALYSIS 
           5.7.1 INDUSTRY 4.0
           5.7.2 ARTIFICIAL INTELLIGENCE (AI)
           5.7.3 INTERNET OF THINGS (IOT)
           5.7.4 BLOCKCHAIN
           5.7.5 AUGMENTED REALITY (AR) AND VIRTUAL REALITY (VR)
           5.7.6 COLLABORATIVE ROBOTS
           5.7.7 PREDICTIVE MAINTENANCE
    5.8 PORTER’S FIVE FORCE ANALYSIS 
           TABLE 6 SMART MANUFACTURING MARKET: PORTER’S FIVE FORCES ANALYSIS
           5.8.1 THREAT OF NEW ENTRANTS
           5.8.2 THREAT OF SUBSTITUTES
           5.8.3 BARGAINING POWER OF SUPPLIERS
           5.8.4 BARGAINING POWER OF BUYERS
           5.8.5 INTENSITY OF COMPETITIVE RIVALRY
    5.9 KEY STAKEHOLDERS AND BUYING CRITERIA 
           5.9.1 KEY STAKEHOLDERS IN BUYING PROCESS
                    FIGURE 29 INFLUENCE OF STAKEHOLDERS ON BUYING PROCESS FOR TOP 3 INDUSTRIES
                    TABLE 7 INFLUENCE OF STAKEHOLDERS ON BUYING PROCESS FOR TOP 3 INDUSTRIES (%)
           5.9.2 BUYING CRITERIA
                    FIGURE 30 KEY BUYING CRITERIA FOR TOP 3 INDUSTRIES
                    TABLE 8 KEY BUYING CRITERIA FOR TOP 3 INDUSTRIES
    5.10 CASE STUDY ANALYSIS 
           5.10.1 LEMATIC DEVELOPS SAAS SOLUTION TO PROVIDE ACCESS TO CRITICAL INFORMATION
           5.10.2 NBC BEARINGS ESTABLISHES CONNECTED SMART FACTORY TO STREAMLINE INFORMATION FLOW
           5.10.3 ARB MIDSTREAM ADOPTS SCADA SYSTEMS TO DEVELOP OPERATION CONTROL CENTER
           5.10.4 HIETA PARTNERS WITH RENISHAW TO PRODUCE COMMERICAL HEAT EXCHANGERS
           5.10.5 BARCELONA LEVERAGES COMMUNICATION INFRASTRUCTURE TO ENHANCE RESOURCE MANAGEMENT
    5.11 TRADE ANALYSIS 
           FIGURE 31 IMPORT DATA FOR HS CODE 847950, BY COUNTRY, 2018–2022 (USD MILLION)
           FIGURE 32 EXPORT DATA FOR HS CODE 847950, BY COUNTRY, 2018–2022 (USD MILLION)
    5.12 PATENT ANALYSIS 
           FIGURE 33 TOP 10 COMPANIES WITH HIGHEST NUMBER OF PATENT APPLICATIONS IN LAST 10 YEARS
           FIGURE 34 NUMBER OF PATENTS RELATED TO SMART MANUFACTURING SOLUTIONS GRANTED IN LAST 10 YEARS
           TABLE 9 TOP 20 PATENT OWNERS IN LAST 10 YEARS
           5.12.1 LIST OF MAJOR PATENTS
    5.13 KEY CONFERENCES AND EVENTS, 2023–2024 
           TABLE 10 SMART MANUFACTURING MARKET: LIST OF CONFERENCES AND EVENTS
    5.14 REGULATORY LANDSCAPE 
           5.14.1 REGULATORY BODIES, GOVERNMENT AGENCIES, AND OTHER ORGANIZATIONS
                    TABLE 11 NORTH AMERICA: LIST OF REGULATORY BODIES, GOVERNMENT AGENCIES, AND OTHER ORGANIZATIONS
                    TABLE 12 EUROPE: LIST OF REGULATORY BODIES, GOVERNMENT AGENCIES, AND OTHER ORGANIZATIONS
                    TABLE 13 ASIA PACIFIC: LIST OF REGULATORY BODIES, GOVERNMENT AGENCIES, AND OTHER ORGANIZATIONS
                    TABLE 14 ROW: LIST OF REGULATORY BODIES, GOVERNMENT AGENCIES, AND OTHER ORGANIZATIONS
           5.14.2 STANDARDS
                    5.14.2.1 IEC TS 62832-1: 2020
                    5.14.2.2 Open Platform Communications United Architecture (OPC UA)
                    5.14.2.3 ISO/IEC TR 63306-1: 2020
                    5.14.2.4 ISO 55001: 2014
                    5.14.2.5 Industrial safety standards
                    5.14.2.6 Smart manufacturing standards
                               5.14.2.6.1 Society 5.0 - Japan
                               5.14.2.6.2 RIE2020 - Singapore
                               5.14.2.6.3 USB3 Vision
                               5.14.2.6.4 CoaXPress (CXP)
                    5.14.2.7 Machine Vision cameras and sensors
                               5.14.2.7.1 EMVA 1288
                               5.14.2.7.2 ASTM E57
                    5.14.2.8 Lens mount standards
                               5.14.2.8.1 Japan Industrial Imaging Association (JIAA)
                    5.14.2.9 PROGRAMMING INTERFACE
                               5.14.2.9.1 GenICam
                                             TABLE 15 MARKET: REGULATIONS AND STANDARDS
 
6 SMART MANUFACTURING MARKET, BY INFORMATION TECHNOLOGY (Page No. - 103)
    6.1 INTRODUCTION 
           FIGURE 35 SMART MANUFACTURING MARKET, BY INFORMATION TECHNOLOGY
           FIGURE 36 MANUFACTURING EXECUTION SYSTEM (MES) SEGMENT TO DOMINATE MARKET DURING FORECAST PERIOD
           TABLE 16 MARKET, BY INFORMATION TECHNOLOGY, 2019–2022 (USD MILLION)
           TABLE 17 MARKET, BY INFORMATION TECHNOLOGY, 2023–2028 (USD MILLION)
           TABLE 18 INFORMATION TECHNOLOGY: MARKET, BY PROCESS INDUSTRY, 2019–2022 (USD MILLION)
           TABLE 19 INFORMATION TECHNOLOGY: MARKET, BY PROCESS INDUSTRY, 2023–2028 (USD MILLION)
           TABLE 20 INFORMATION TECHNOLOGY: MARKET, BY DISCRETE INDUSTRY, 2019–2022 (USD MILLION)
           TABLE 21 INFORMATION TECHNOLOGY: MARKET, BY DISCRETE INDUSTRY, 2023–2028 (USD MILLION)
           TABLE 22 INFORMATION TECHNOLOGY: MARKET, BY REGION, 2019–2022 (USD MILLION)
           TABLE 23 INFORMATION TECHNOLOGY: MARKET, BY REGION, 2023–2028 (USD MILLION)
    6.2 HUMAN–MACHINE INTERFACE (HMI) 
           6.2.1 RELIANCE ON HMI TECHNOLOGY TO CONVERT COMPLEX PROCESS VARIABLES INTO ACTIONABLE INSIGHTS TO FUEL SEGMENTAL GROWTH
           6.2.2 HUMAN–MACHINE INTERFACE (HMI), BY OFFERING
                    6.2.2.1 Software
                    6.2.2.2 Hardware
           6.2.3 HUMAN–MACHINE INTERFACE, BY CONFIGURATION TYPE
                    6.2.3.1 Standalone HMI
                    6.2.3.2 Embedded HMI
                               TABLE 24 HUMAN–MACHINE INTERFACE (HMI): SMART MANUFACTURING MARKET, BY PROCESS INDUSTRY, 2019–2022 (USD MILLION)
                               TABLE 25 HUMAN–MACHINE INTERFACE (HMI): MARKET, BY PROCESS INDUSTRY, 2023–2028 (USD MILLION)
                               TABLE 26 HUMAN–MACHINE INTERFACE (HMI): MARKET, BY DISCRETE INDUSTRY, 2019–2022 (USD MILLION)
                               TABLE 27 HUMAN–MACHINE INTERFACE (HMI): MARKET, BY DISCRETE INDUSTRY, 2023–2028 (USD MILLION)
                               TABLE 28 HUMAN–MACHINE INTERFACE (HMI): MARKET, BY REGION, 2019–2022 (USD MILLION)
                               TABLE 29 HUMAN-MACHINE INTERFACE (HMI): MARKET FOR INFORMATION TECHNOLOGY, BY REGION, 2023–2028 (USD MILLION)
    6.3 PLANT ASSET MANAGEMENT (PAM) 
           6.3.1 ADOPTION OF PAM SYSTEMS TO BUILD COMPREHENSIVE DATA RECORDS TO ACCELERATE MARKET GROWTH
                    TABLE 30 PLANT ASSET MANAGEMENT (PAM): SMART MANUFACTURING MARKET, BY PROCESS INDUSTRY, 2019–2022 (USD MILLION)
                    TABLE 31 PLANT ASSET MANAGEMENT (PAM): MARKET, BY PROCESS INDUSTRY, 2023–2028 (USD MILLION)
                    TABLE 32 PLANT ASSET MANAGEMENT (PAM): MARKET, BY DISCRETE INDUSTRY, 2019–2022 (USD MILLION)
                    TABLE 33 PLANT ASSET MANAGEMENT (PAM): MARKET, BY DISCRETE INDUSTRY, 2023–2028 (USD MILLION)
                    TABLE 34 PLANT ASSET MANAGEMENT (PAM): MARKET, BY REGION, 2019–2022 (USD MILLION)
                    TABLE 35 PLANT ASSET MANAGEMENT (PAM): MARKET, BY REGION, 2023–2028 (USD MILLION)
           6.3.2 PLANT ASSET MANAGEMENT (PAM), BY OFFERING
                    6.3.2.1 Software
                    6.3.2.2 Services
           6.3.3 PLANT ASSET MANAGEMENT (PAM), BY DEPLOYMENT MODE
                    6.3.3.1 Offline
                    6.3.3.2 Online
           6.3.4 PLANT ASSET MANAGEMENT (PAM), BY ASSET TYPE
                    6.3.4.1 Production asset
                    6.3.4.2 Automation asset
    6.4 MANUFACTURING EXECUTION SYSTEM (MES) 
           6.4.1 RAPID ADVANCEMENTS IN MES TECHNOLOGY TO PROPEL MARKET
           6.4.2 MANUFACTURING EXECUTION SYSTEM (MES), BY DEPLOYMENT MODE
                    6.4.2.1 On-premise
                    6.4.2.2 On-demand
                    6.4.2.3 Hybrid
           6.4.3 MANUFACTURING EXECUTION SYSTEM (MES), BY OFFERING
                    6.4.3.1 Software
                    6.4.3.2 Solutions
                               TABLE 36 MANUFACTURING EXECUTION SYSTEM (MES): SMART MANUFACTURING MARKET, BY PROCESS INDUSTRY, 2019–2022 (USD MILLION)
                               TABLE 37 MANUFACTURING EXECUTION SYSTEM (MES): MARKET, BY PROCESS INDUSTRY, 2023–2028 (USD MILLION)
                               TABLE 38 MANUFACTURING EXECUTION SYSTEM (MES): MARKET, BY DISCRETE INDUSTRY, 2019–2022 (USD MILLION)
                               TABLE 39 MANUFACTURING EXECUTION SYSTEM (MES): MARKET, BY DISCRETE INDUSTRY, 2023–2028 (USD MILLION)
                               TABLE 40 MANUFACTURING EXECUTION SYSTEM (MES): MARKET, BY REGION, 2019–2022 (USD MILLION)
                               TABLE 41 MANUFACTURING EXECUTION SYSTEM (MES): MARKET, BY REGION, 2023–2028 (USD MILLION)
    6.5 WAREHOUSE MANAGEMENT SYSTEM (WMS) 
           6.5.1 EMPLOYMENT OF WMS SOLUTIONS TO SUPPORT INVENTORY CONTROL AND LABOR MANAGEMENT TO PROPEL MARKET
           6.5.2 WAREHOUSE MANAGEMENT SYSTEM (WMS), BY APPLICATION
                    6.5.2.1 Inventory management
                    6.5.2.2 Order management
           6.5.3 WAREHOUSE MANAGEMENT SYSTEM (WMS), BY DEPLOYMENT MODE
                    6.5.3.1 On-premises
                    6.5.3.2 Cloud-based
           6.5.4 WAREHOUSE MANAGEMENT SYSTEM (WMS), BY TIER TYPE
                    6.5.4.1 Tier 1
                    6.5.4.2 Tier 2
                    6.5.4.3 Tier 3
                               TABLE 42 WAREHOUSE MANAGEMENT SYSTEM (WMS): SMART MANUFACTURING MARKET, BY PROCESS INDUSTRY, 2019–2022 (USD MILLION)
                               TABLE 43 WAREHOUSE MANAGEMENT SYSTEM (WMS): MARKET, BY PROCESS INDUSTRY, 2023–2028 (USD MILLION)
                               TABLE 44 WAREHOUSE MANAGEMENT SYSTEM (WMS): MARKET, BY DISCRETE INDUSTRY, 2019–2022 (USD MILLION)
                               TABLE 45 WAREHOUSE MANAGEMENT SYSTEM (WMS): MARKET, BY DISCRETE INDUSTRY, 2023–2028 (USD MILLION)
                               TABLE 46 WAREHOUSE MANAGEMENT SYSTEM (WMS): MARKET, BY REGION, 2019–2022 (USD MILLION)
                               TABLE 47 WAREHOUSE MANAGEMENT SYSTEM (WMS): MARKET, BY REGION, 2023–2028 (USD MILLION)
 
7 SMART MANUFACTURING MARKET, BY ENABLING TECHNOLOGY (Page No. - 126)
    7.1 INTRODUCTION 
           FIGURE 37 MARKET, BY ENABLING TECHNOLOGY
           FIGURE 38 DIGITAL TWIN SEGMENT TO EXHIBIT HIGHEST CAGR IN MARKET DURING FORECAST PERIOD
           TABLE 48 MARKET, BY ENABLING TECHNOLOGY, 2019–2022 (USD MILLION)
           TABLE 49 MARKET, BY ENABLING TECHNOLOGY, 2023–2028 (USD MILLION)
           TABLE 50 ENABLING TECHNOLOGY: MARKET, BY REGION, 2019–2022 (USD MILLION)
           TABLE 51 ENABLING TECHNOLOGY: MARKET, BY REGION, 2023–2028 (USD MILLION)
           TABLE 52 ENABLING TECHNOLOGY: MARKET, BY PROCESS INDUSTRY, 2019–2022 (USD MILLION)
           TABLE 53 ENABLING TECHNOLOGY: MARKET, BY PROCESS INDUSTRY, 2023–2028 (USD MILLION)
           TABLE 54 ENABLING TECHNOLOGY: MARKET, BY DISCRETE INDUSTRY, 2019–2022 (USD MILLION)
           TABLE 55 ENABLING TECHNOLOGY: MARKET, BY DISCRETE INDUSTRY, 2023–2028 (USD MILLION)
    7.2 INDUSTRIAL 3D PRINTING 
           7.2.1 EMPHASIS ON SIMPLIFYING MANUFACTURING OF PARTS WITH COMPLEX DESIGNS TO BOOST SEGMENTAL GROWTH
           7.2.2 INDUSTRIAL 3D PRINTING, BY OFFERING
                    7.2.2.1 Printers
                    7.2.2.2 Materials
                    7.2.2.3 Software
                    7.2.2.4 Services
           7.2.3 INDUSTRIAL 3D PRINTING, BY APPLICATION
                    7.2.3.1 Tooling
                    7.2.3.2 Heavy equipment and machinery
                    7.2.3.3 Robotics
           7.2.4 INDUSTRIAL 3D PRINTING, BY PROCESS
                    7.2.4.1 Binder jetting
                    7.2.4.2 Direct energy deposition
                    7.2.4.3 Material extrusion
                    7.2.4.4 Material jetting
                    7.2.4.5 Powder bed fusion
                    7.2.4.6 Sheet lamination
                    7.2.4.7 Vat photopolymerization
           7.2.5 INDUSTRIAL 3D PRINTING, BY TECHNOLOGY
                    7.2.5.1 Deployment of industrial 3D printing technologies to support manufacturing processes and enhance supply chain to drive segmental growth
                               TABLE 56 INDUSTRIAL 3D PRINTING: SMART MANUFACTURING MARKET, BY REGION, 2019–2022 (USD MILLION)
                               TABLE 57 INDUSTRIAL 3D PRINTING: MARKET, BY REGION, 2023–2028 (USD MILLION)
                               TABLE 58 INDUSTRIAL 3D PRINTING: MARKET, BY PROCESS INDUSTRY, 2019–2022 (USD MILLION)
                               TABLE 59 INDUSTRIAL 3D PRINTING: MARKET, BY PROCESS INDUSTRY, 2023–2028 (USD MILLION)
                               TABLE 60 INDUSTRIAL 3D PRINTING: MARKET, BY DISCRETE INDUSTRY, 2019–2022 (USD MILLION)
                               TABLE 61 INDUSTRIAL 3D PRINTING: MARKET, BY DISCRETE INDUSTRY, 2023–2028 (USD MILLION)
    7.3 ROBOTS 
           7.3.1 DEPLOYMENT OF AI AND ML TECHNOLOGIES TO IMPROVE INDUSTRIAL ROBOT PERFORMANCE TO CONTRIBUTE TO SEGMENTAL GROWTH
           7.3.2 ROBOTS, BY TYPE
                    7.3.2.1 Traditional robots
                               7.3.2.1.1 Articulated robots
                               7.3.2.1.2 Cartesian robots
                               7.3.2.1.3 Selective compliance assembly robot arms (SCARAs)
                               7.3.2.1.4 Parallel robots
                               7.3.2.1.5 Other traditional robots
                    7.3.2.2 Collaborative robots
                               TABLE 62 ROBOTS: SMART MANUFACTURING MARKET, BY REGION, 2019–2022 (USD MILLION)
                               TABLE 63 ROBOTS: MARKET, BY REGION, 2023–2028 (USD MILLION)
                               TABLE 64 ROBOTS: MARKET, BY PROCESS INDUSTRY, 2019–2022 (USD MILLION)
                               TABLE 65 ROBOTS: MARKET, BY PROCESS INDUSTRY, 2023–2028 (USD MILLION)
                               TABLE 66 ROBOTS: MARKET, BY DISCRETE INDUSTRY, 2019–2022 (USD MILLION)
                               TABLE 67 ROBOTS: MARKET, BY DISCRETE INDUSTRY, 2023–2028 (USD MILLION)
                               TABLE 68 INDUSTRIAL ROBOTS MARKET, BY TYPE, 2019–2022 (THOUSAND UNITS)
                               TABLE 69 INDUSTRIAL ROBOTS MARKET, BY TYPE, 2023–2028 (THOUSAND UNITS)
    7.4 INDUSTRIAL SENSORS 
           7.4.1 INTEGRATION OF INDUSTRIAL SENSORS WITH ADVANCED CONNECTIVITY SOLUTIONS TO FUEL MARKET GROWTH
           7.4.2 INDUSTRIAL SENSORS, BY TYPE
                    7.4.2.1 Wired
                    7.4.2.2 Wireless
                               TABLE 70 INDUSTRIAL SENSORS: SMART MANUFACTURING MARKET, BY REGION, 2019–2022 (USD MILLION)
                               TABLE 71 INDUSTRIAL SENSORS: MARKET, BY REGION, 2023–2028 (USD MILLION)
                               TABLE 72 INDUSTRIAL SENSORS: MARKET, BY PROCESS INDUSTRY, 2019–2022 (USD MILLION)
                               TABLE 73 INDUSTRIAL SENSORS: MARKET, BY PROCESS INDUSTRY, 2023–2028 (USD MILLION)
    7.5 AI IN MANUFACTURING 
           7.5.1 RELIANCE ON AI TECHNOLOGY TO REVOLUTIONIZE MANUFACTURING OPERATIONS TO PROPEL MARKET
           7.5.2 AI IN MANUFACTURING, BY OFFERING
                    7.5.2.1 Hardware
                    7.5.2.2 Software
           7.5.3 AI IN MANUFACTURING, BY TECHNOLOGY
                    7.5.3.1 Computer vision
                    7.5.3.2 Deep learning
                    7.5.3.3 Natural language processing (NLP)
                    7.5.3.4 Context awareness
           7.5.4 AI IN MANUFACTURING, BY APPLICATION
                    7.5.4.1 Predictive maintenance
                    7.5.4.2 Machinery inspection
                    7.5.4.3 Production planning
                    7.5.4.4 Field services
                    7.5.4.5 Quality control
                               TABLE 74 AI IN MANUFACTURING: SMART MANUFACTURING MARKET, BY REGION, 2019–2022 (USD MILLION)
                               TABLE 75 AI IN MANUFACTURING: MARKET, BY REGION, 2023–2028 (USD MILLION)
                               TABLE 76 AI IN MANUFACTURING: MARKET, BY PROCESS INDUSTRY, 2019–2022 (USD MILLION)
                               TABLE 77 AI IN MANUFACTURING: MARKET, BY PROCESS INDUSTRY, 2023–2028 (USD MILLION)
                               TABLE 78 AI IN MANUFACTURING: MARKET, BY DISCRETE INDUSTRY, 2019–2022 (USD MILLION)
                               TABLE 79 AI IN MANUFACTURING: MARKET, BY DISCRETE INDUSTRY, 2023–2028 (USD MILLION)
    7.6 MACHINE CONDITION MONITORING 
           7.6.1 RELIANCE ON PREDICTIVE MONITORING SYSTEMS TO DETECT THREATS AND TAKE REMEDIAL ACTIONS TO FUEL MARKET GROWTH
           7.6.2 MACHINE CONDITION MONITORING, BY TECHNIQUE
                    7.6.2.1 Vibration monitoring
                    7.6.2.2 Thermography
                    7.6.2.3 Oil analysis
                    7.6.2.4 Corrosion monitoring
                    7.6.2.5 Motor current analysis
           7.6.3 MACHINE CONDITION MONITORING, BY OFFERING
                    7.6.3.1 Hardware
                    7.6.3.2 Software
           7.6.4 MACHINE CONDITION MONITORING, BY DEPLOYMENT TYPE
                    7.6.4.1 On-premises
                    7.6.4.2 Cloud-based
                               TABLE 80 MACHINE CONDITION MONITORING: SMART MANUFACTURING MARKET, BY REGION, 2019–2022 (USD MILLION)
                               TABLE 81 MACHINE CONDITION MONITORING: MARKET, BY REGION, 2023–2028 (USD MILLION)
                               TABLE 82 MACHINE CONDITION MONITORING: MARKET, BY PROCESS INDUSTRY, 2019–2022 (USD MILLION)
                               TABLE 83 MACHINE CONDITION MONITORING: MARKET, BY PROCESS INDUSTRY, 2023–2028 (USD MILLION)
                               TABLE 84 MACHINE CONDITION MONITORING: MARKET, BY DISCRETE INDUSTRY, 2019–2022 (USD MILLION)
                               TABLE 85 MACHINE CONDITION MONITORING: MARKET, BY DISCRETE INDUSTRY, 2023–2028 (USD MILLION)
    7.7 INDUSTRIAL MACHINE VISION 
           7.7.1 APPLICATION OF 3D MACHINE VISION TECHNOLOGY IN MANUFACTURING PROCESSES TO ACCELERATE SEGMENTAL GROWTH
           7.7.2 INDUSTRIAL MACHINE VISION, BY COMPONENT
                    7.7.2.1 Hardware
                    7.7.2.2 Software
           7.7.3 INDUSTRIAL MACHINE VISION, BY PRODUCT
                    7.7.3.1 PC-based
                    7.7.3.2 Smart camera-based
           7.7.4 INDUSTRIAL MACHINE VISION, BY APPLICATION
                    7.7.4.1 Quality assurance and inspection
                    7.7.4.2 Positioning and guidance
                    7.7.4.3 Measurement
                    7.7.4.4 Identification
                               TABLE 86 INDUSTRIAL MACHINE VISION: SMART MANUFACTURING MARKET, BY REGION, 2019–2022 (USD MILLION)
                               TABLE 87 INDUSTRIAL MACHINE VISION: MARKET, BY REGION, 2023–2028 (USD MILLION)
                               TABLE 88 INDUSTRIAL MACHINE VISION: MARKET, BY PROCESS INDUSTRY, 2019–2022 (USD MILLION)
                               TABLE 89 INDUSTRIAL MACHINE VISION: MARKET, BY PROCESS INDUSTRY, 2023–2028 (USD MILLION)
                               TABLE 90 INDUSTRIAL MACHINE VISION: MARKET, BY DISCRETE INDUSTRY, 2019–2022 (USD MILLION)
                               TABLE 91 INDUSTRIAL MACHINE VISION: MARKET, BY DISCRETE INDUSTRY, 2023–2028 (USD MILLION)
    7.8 INDUSTRIAL CYBERSECURITY 
           7.8.1 RELIANCE ON SECURE INDUSTRIAL CONTROL SYSTEMS TO FUEL MARKET GROWTH
           7.8.2 INDUSTRIAL CYBERSECURITY, BY TYPE
                    7.8.2.1 Network security
                    7.8.2.2 Application security
                    7.8.2.3 Endpoint security
                    7.8.2.4 Cloud security
                    7.8.2.5 Wireless security
                    7.8.2.6 Other security types
           7.8.3 INDUSTRIAL CYBERSECURITY, BY PRODUCT
                    7.8.3.1 Gateways
                    7.8.3.2 Network devices
           7.8.4 INDUSTRIAL CYBERSECURITY, BY TYPE
                    7.8.4.1 Solutions
                    7.8.4.2 Services
                               TABLE 92 INDUSTRIAL CYBERSECURITY: SMART MANUFACTURING MARKET, BY REGION, 2019–2022 (USD MILLION)
                               TABLE 93 INDUSTRIAL CYBERSECURITY: MARKET, BY REGION, 2023–2028 (USD MILLION)
                               TABLE 94 INDUSTRIAL CYBERSECURITY: MARKET, BY PROCESS INDUSTRY, 2019–2022 (USD MILLION)
                               TABLE 95 INDUSTRIAL CYBERSECURITY: MARKET, BY PROCESS INDUSTRY, 2023–2028 (USD MILLION)
    7.9 DIGITAL TWIN 
           7.9.1 INTEGRATION OF AI AND ML WITH DIGITAL TWIN TECHNOLOGIES TO CONTRIBUTE TO MARKET GROWTH
           7.9.2 DIGITAL TWIN, BY APPLICATION
                    7.9.2.1 Product design and development
                    7.9.2.2 Machine and equipment health monitoring
                    7.9.2.3 Structural health monitoring
                    7.9.2.4 Condition monitoring
                    7.9.2.5 Predictive maintenance
                    7.9.2.6 Dynamic optimization
                               TABLE 96 DIGITAL TWIN: SMART MANUFACTURING MARKET, BY REGION, 2019–2022 (USD MILLION)
                               TABLE 97 DIGITAL TWIN: MARKET, BY REGION, 2023–2028 (USD MILLION)
                               TABLE 98 DIGITAL TWIN: MARKET, BY PROCESS INDUSTRY, 2019–2022 (USD MILLION)
                               TABLE 99 DIGITAL TWIN: MARKET, BY PROCESS INDUSTRY, 2023–2028 (USD MILLION)
                               TABLE 100 DIGITAL TWIN: MARKET, BY DISCRETE INDUSTRY, 2019–2022 (USD MILLION)
                               TABLE 101 DIGITAL TWIN: MARKET, BY DISCRETE INDUSTRY, 2023–2028 (USD MILLION)
    7.10 AUTOMATED GUIDED VEHICLES 
           7.10.1 DEPLOYMENT OF 5G TO PROVIDE HIGH-SPEED VEHICLE CONNECTIVITY AND NAVIGATION TO PROPEL MARKET
           7.10.2 AUTOMATED GUIDED VEHICLES, BY TYPE
                    7.10.2.1 Unit load carriers
                    7.10.2.2 Tow vehicles
                    7.10.2.3 Pallet trucks
                    7.10.2.4 Assembly line vehicles
           7.10.3 AUTOMATED GUIDED VEHICLES, BY NAVIGATION TECHNOLOGY
                    7.10.3.1 Laser guidance
                    7.10.3.2 Magnetic guidance
                    7.10.3.3 Vision guidance
                    7.10.3.4 Inductive guidance
                    7.10.3.5 Optical tape guidance
           7.10.4 AUTOMATED GUIDED VEHICLES, BY APPLICATION
                    7.10.4.1 Transportation
                    7.10.4.2 Distribution
                    7.10.4.3 Storage
                    7.10.4.4 Assembly
                    7.10.4.5 Packaging
                               TABLE 102 AUTOMATED GUIDED VEHICLES: SMART MANUFACTURING MARKET, BY REGION, 2019–2022 (USD MILLION)
                               TABLE 103 AUTOMATED GUIDED VEHICLES: MARKET, BY REGION, 2023–2028 (USD MILLION)
                               TABLE 104 AUTOMATED GUIDED VEHICLES: MARKET, BY PROCESS INDUSTRY, 2019–2022 (USD MILLION)
                               TABLE 105 AUTOMATED GUIDED VEHICLES: MARKET, BY PROCESS INDUSTRY, 2023–2028 (USD MILLION)
                               TABLE 106 AUTOMATED GUIDED VEHICLES: MARKET, BY DISCRETE INDUSTRY, 2019–2022 (USD MILLION)
                               TABLE 107 AUTOMATED GUIDED VEHICLES: MARKET, BY DISCRETE INDUSTRY, 2023–2028 (USD MILLION)
    7.11 AUGMENTED REALITY & VIRTUAL REALITY 
           7.11.1 GROWING DEMAND FOR AR & VR TECHNOLOGIES BY MANUFACTURING SECTOR TO DRIVE MARKET
           7.11.2 AUGMENTED REALITY & VIRTUAL REALITY, BY TECHNOLOGY
                    7.11.2.1 Augmented reality
                    7.11.2.2 Virtual reality
           7.11.3 AUGMENTED REALITY & VIRTUAL REALITY, BY OFFERING
                    7.11.3.1 Hardware
                    7.11.3.2 Software
           7.11.4 AUGMENTED REALITY & VIRTUAL REALITY, BY DEVICE TYPE
                    7.11.4.1 Head-mounted displays (HMDs)
                    7.11.4.2 Head-up displays (HUDs)
                               TABLE 108 AUGMENTED REALITY & VIRTUAL REALITY: SMART MANUFACTURING MARKET, BY PROCESS INDUSTRY, 2019–2022 (USD MILLION)
                               TABLE 109 AUGMENTED REALITY & VIRTUAL REALITY: MARKET, BY PROCESS INDUSTRY, 2023–2028 (USD MILLION)
                               TABLE 110 AUGMENTED REALITY & VIRTUAL REALITY: MARKET, BY DISCRETE INDUSTRY, 2019–2022 (USD MILLION)
                               TABLE 111 AUGMENTED REALITY & VIRTUAL REALITY: MARKET, BY DISCRETE INDUSTRY, 2023–2028 (USD MILLION)
    7.12 5G INDUSTRIAL IOT 
           7.12.1 RISING DEMAND FOR RELIABLE AND LOW-LATENCY NETWORKS TO BOOST SEGMENTAL GROWTH
                    TABLE 112 5G INDUSTRIAL IOT: SMART MANUFACTURING MARKET, BY REGION, 2019–2022 (USD MILLION)
                    TABLE 113 5G INDUSTRIAL IOT: MARKET, BY REGION, 2023–2028 (USD MILLION)
                    TABLE 114 5G INDUSTRIAL IOT: MARKET, BY INDUSTRY, 2019–2022 (USD MILLION)
                    TABLE 115 5G INDUSTRIAL IOT: MARKET, BY INDUSTRY, 2023–2028 (USD MILLION)
 
8 SMART MANUFACTURING MARKET, BY INDUSTRY (Page No. - 179)
    8.1 INTRODUCTION 
           FIGURE 39 MARKET, BY INDUSTRY
    8.2 PROCESS INDUSTRIES 
           FIGURE 40 ENERGY & POWER SEGMENT TO HOLD LARGEST SHARE OF MARKET IN 2028
           TABLE 116 MARKET, BY PROCESS INDUSTRY, 2019–2022 (USD MILLION)
           TABLE 117 MARKET, BY PROCESS INDUSTRY, 2023–2028 (USD MILLION)
           TABLE 118 PROCESS INDUSTRY: MARKET, BY INFORMATION TECHNOLOGY, 2019–2022 (USD MILLION)
           TABLE 119 PROCESS INDUSTRY: MARKET, BY INFORMATION TECHNOLOGY, 2023–2028 (USD MILLION)
           TABLE 120 PROCESS INDUSTRY: MARKET, BY ENABLING TECHNOLOGY, 2019–2022 (USD MILLION)
           TABLE 121 PROCESS INDUSTRY: MARKET, BY ENABLING TECHNOLOGY, 2023–2028 (USD MILLION)
           8.2.1 OIL & GAS
                    8.2.1.1 Utilization of asset monitoring solutions by oil & gas companies to drive market
           8.2.2 FOOD & BEVERAGES
                    8.2.2.1 Requirement for increased productivity and reduced downtime in food & beverage manufacturing plants to fuel segmental growth
           8.2.3 PHARMACEUTICALS
                    8.2.3.1 Deployment of automated systems to increase operational efficiency by pharma companies to boost market growth
           8.2.4 CHEMICALS
                    8.2.4.1 Reliance of chemical manufacturers on automated solutions to maintain ideal inventory levels to contribute to market growth
           8.2.5 ENERGY & POWER
                    8.2.5.1 Adoption of smart manufacturing tools to facilitate efficient energy & power management to propel market
           8.2.6 METALS & MINING
                    8.2.6.1 Deployment of enabling technologies to optimize metal production to fuel segmental growth
           8.2.7 PULP & PAPER
                    8.2.7.1 Use of smart manufacturing solutions to cut costs and increase pulp & paper output to drive market
           8.2.8 OTHER PROCESS INDUSTRIES
    8.3 DISCRETE INDUSTRIES 
           FIGURE 41 AUTOMOTIVE SEGMENT TO DOMINATE SMART MANUFACTURING MARKET FROM 2023 TO 2028
           TABLE 122 MARKET, BY DISCRETE INDUSTRY, 2019–2022 (USD MILLION)
           TABLE 123 MARKET, BY DISCRETE INDUSTRY, 2023–2028 (USD MILLION)
           TABLE 124 DISCRETE INDUSTRY: MARKET, BY INFORMATION TECHNOLOGY, 2019–2022 (USD MILLION)
           TABLE 125 DISCRETE INDUSTRY: MARKET, BY INFORMATION TECHNOLOGY, 2023–2028 (USD MILLION)
           TABLE 126 DISCRETE INDUSTRY: MARKET, BY ENABLING TECHNOLOGY, 2019–2022 (USD MILLION)
           TABLE 127 DISCRETE INDUSTRY: MARKET, BY ENABLING TECHNOLOGY, 2023–2028 (USD MILLION)
           8.3.1 AUTOMOTIVE
                    8.3.1.1 Use of cobots to manage mission-critical tasks in automotive manufacturing plants to contribute to market growth
           8.3.2 AEROSPACE
                    8.3.2.1 Deployment of AI technologies to detect aerospace & defense machinery faults to propel market
           8.3.3 SEMICONDUCTOR & ELECTRONICS
                    8.3.3.1 Adoption of smart manufacturing solutions to strengthen semiconductor & electronics supply chain to boost segmental growth
           8.3.4 MEDICAL DEVICES
                    8.3.4.1 Utilization of robots in medical facilities to maintain infection-free environment to drive segmental growth
           8.3.5 MACHINE MANUFACTURING
                    8.3.5.1 Reliance on AI technology to analyze machine manufacturing conditions and reduce downtime to accelerate market growth
           8.3.6 OTHER DISCRETE INDUSTRIES
 
9 SMART MANUFACTURING MARKET, BY REGION (Page No. - 197)
    9.1 INTRODUCTION 
           FIGURE 42 MARKET, BY REGION
           FIGURE 43 NORTH AMERICA TO DOMINATE MARKET DURING FORECAST PERIOD
           TABLE 128 MARKET, BY REGION, 2019–2022 (USD MILLION)
           TABLE 129 MARKET, BY REGION, 2023–2028 (USD MILLION)
    9.2 NORTH AMERICA 
           9.2.1 RECESSION IMPACT ON MARKET IN NORTH AMERICA
                    FIGURE 44 NORTH AMERICA: SMART MANUFACTURING MARKET SNAPSHOT
                    FIGURE 45 US TO ACCOUNT FOR LARGEST SHARE OF MARKET IN 2028
                    TABLE 130 NORTH AMERICA: MARKET, BY COUNTRY, 2019–2022 (USD MILLION)
                    TABLE 131 NORTH AMERICA: MARKET, BY COUNTRY, 2023–2028 (USD MILLION)
                    TABLE 132 NORTH AMERICA: MARKET, BY INFORMATION TECHNOLOGY, 2019–2022 (USD MILLION)
                    TABLE 133 NORTH AMERICA: MARKET, BY INFORMATION TECHNOLOGY, 2023–2028 (USD MILLION)
                    TABLE 134 NORTH AMERICA: MARKET, BY ENABLING TECHNOLOGY, 2019–2022 (USD MILLION)
                    TABLE 135 NORTH AMERICA: MARKET, BY ENABLING TECHNOLOGY, 2023–2028 (USD MILLION)
           9.2.2 US
                    9.2.2.1 Increasing adoption of automation solutions to improve operational efficiency to drive market
           9.2.3 CANADA
                    9.2.3.1 Growing emphasis on innovation of food & beverage processing activities to accelerate market growth
           9.2.4 MEXICO
                    9.2.4.1 Rising advancement in IIoT and automation technologies to contribute to market growth
    9.3 EUROPE 
           9.3.1 RECESSION IMPACT ON MARKET IN EUROPE
                    FIGURE 46 EUROPE: SMART MANUFACTURING MARKET SNAPSHOT
                    FIGURE 47 GERMANY TO HOLD LARGEST SHARE OF MARKET IN 2023
                    TABLE 136 EUROPE: MARKET, BY COUNTRY, 2019–2022 (USD MILLION)
                    TABLE 137 EUROPE: MARKET, BY COUNTRY, 2023–2028 (USD MILLION)
                    TABLE 138 EUROPE: MARKET, BY INFORMATION TECHNOLOGY, 2019–2022 (USD MILLION)
                    TABLE 139 EUROPE: MARKET, BY INFORMATION TECHNOLOGY, 2023–2028 (USD MILLION)
                    TABLE 140 EUROPE: MARKET, BY ENABLING TECHNOLOGY, 2019–2022 (USD MILLION)
                    TABLE 141 EUROPE: MARKET, BY ENABLING TECHNOLOGY, 2023–2028 (USD MILLION)
           9.3.2 UK
                    9.3.2.1 Employment of IoT, cloud, and 5G technologies to boost manufacturing efficiency to drive market
           9.3.3 GERMANY
                    9.3.3.1 Implementation of cloud-based solutions in manufacturing facilities to propel market
           9.3.4 FRANCE
                    9.3.4.1 Investments in digital revolution projects to accelerate industrial automation to contribute to market growth
           9.3.5 REST OF EUROPE
    9.4 ASIA PACIFIC 
           9.4.1 RECESSION IMPACT ON MARKET IN ASIA PACIFIC
                    FIGURE 48 ASIA PACIFIC: SMART MANUFACTURING MARKET SNAPSHOT
                    FIGURE 49 CHINA TO ACCOUNT FOR LARGEST SHARE OF MARKET IN 2028
                    TABLE 142 ASIA PACIFIC: MARKET, BY COUNTRY, 2019–2022 (USD MILLION)
                    TABLE 143 ASIA PACIFIC: MARKET, BY COUNTRY, 2023–2028 (USD MILLION)
                    TABLE 144 ASIA PACIFIC: MARKET, BY INFORMATION TECHNOLOGY, 2019–2022 (USD MILLION)
                    TABLE 145 ASIA PACIFIC: MARKET, BY INFORMATION TECHNOLOGY, 2023–2028 (USD MILLION)
                    TABLE 146 ASIA PACIFIC: MARKET, BY ENABLING TECHNOLOGY, 2019–2022 (USD MILLION)
                    TABLE 147 ASIA PACIFIC: MARKET, BY ENABLING TECHNOLOGY, 2023–2028 (USD MILLION)
           9.4.2 CHINA
                    9.4.2.1 Government initiatives to boost industrialization using automation technologies to fuel market growth
           9.4.3 JAPAN
                    9.4.3.1 Introduction of IT projects and advancements in robotics to drive market
           9.4.4 INDIA
                    9.4.4.1 Deployment of advanced technologies to support industrial revolution to support market growth
           9.4.5 REST OF ASIA PACIFIC
    9.5 ROW 
           9.5.1 RECESSION IMPACT ON MARKET IN ROW
                    FIGURE 50 MIDDLE EAST TO DEPICT HIGHEST CAGR IN SMART MANUFACTURING MARKET FROM 2023 TO 2028
                    TABLE 148 ROW: MARKET, BY REGION, 2019–2022 (USD MILLION)
                    TABLE 149 ROW: MARKET, BY REGION, 2023–2028 (USD MILLION)
                    TABLE 150 ROW: MARKET, BY INFORMATION TECHNOLOGY, 2019–2022 (USD MILLION)
                    TABLE 151 ROW: MARKET, BY INFORMATION TECHNOLOGY, 2023–2028 (USD MILLION)
                    TABLE 152 ROW: MARKET, BY ENABLING TECHNOLOGY, 2019–2022 (USD MILLION)
                    TABLE 153 ROW: MARKET, BY ENABLING TECHNOLOGY, 2023–2028 (USD MILLION)
           9.5.2 SOUTH AMERICA
                    9.5.2.1 Growing adoption of emerging technologies in industrial sectors to accelerate market growth
           9.5.3 MIDDLE EAST & AFRICA
                    9.5.3.1 Rising implementation of automated solutions in oil & gas and mining facilities to propel market
 
10 COMPETITIVE LANDSCAPE (Page No. - 224)
     10.1 INTRODUCTION 
             TABLE 154 KEY STRATEGIES ADOPTED BY PLAYERS IN SMART MANUFACTURING MARKET, 2021–2023
     10.2 MARKET SHARE ANALYSIS, 2022 
              FIGURE 51 MARKET SHARE ANALYSIS OF KEY PLAYERS, 2022
             TABLE 155 INDUSTRIAL ROBOTICS MARKET: DEGREE OF COMPETITION
     10.3 REVENUE ANALYSIS OF KEY PLAYERS, 2018–2022 
             FIGURE 52 FIVE-YEAR REVENUE ANALYSIS OF KEY PLAYERS IN INDUSTRIAL ROBOTICS MARKET
     10.4 EVALUATION MATRIX OF KEY COMPANIES, 2022 
             10.4.1 STARS
             10.4.2 PERVASIVE PLAYERS
             10.4.3 EMERGING LEADERS
             10.4.4 PARTICIPANTS
     10.5 COMPETITIVE BENCHMARKING 
             TABLE 156 OVERALL COMPANY FOOTPRINT
             TABLE 157 COMPANY FOOTPRINT, BY TYPE
             TABLE 158 COMPANY FOOTPRINT, BY END-USE INDUSTRY
             TABLE 159 COMPANY FOOTPRINT, BY REGION
             FIGURE 53 INDUSTRIAL ROBOTICS MARKET: EVALUATION MATRIX OF KEY COMPANIES, 2022
     10.6 EVALUATION MATRIX OF START-UPS/SMALL AND MEDIUM-SIZED ENTERPRISES (SMES), 2022 
             10.6.1 PROGRESSIVE COMPANIES
             10.6.2 RESPONSIVE COMPANIES
             10.6.3 DYNAMIC COMPANIES
             10.6.4 STARTING BLOCKS
     10.7 COMPETITIVE BENCHMARKING 
             TABLE 160 INDUSTRIAL ROBOTICS MARKET: KEY START-UPS/SMES
             TABLE 161 INDUSTRIAL ROBOTICS MARKET: COMPETITIVE BENCHMARKING OF KEY START-UPS/SMES
             FIGURE 54 INDUSTRIAL ROBOTICS MARKET: EVALUATION MATRIX OF START- UPS/SMES, 2022
     10.8 COMPETITIVE SCENARIOS AND TRENDS 
             10.8.1 RECENT DEVELOPMENTS
                        10.8.1.1 Product launches
                                     TABLE 162 SMART MANUFACTURING MARKET: PRODUCT LAUNCHES
                        10.8.1.2 Deals
                                     TABLE 163 SMART MANUFACTURING MARKET: DEALS
                        10.8.1.3 Others
                                     TABLE 164 SMART MANUFACTURING MARKET: OTHERS
 
11 COMPANY PROFILES (Page No. - 250)
(Business Overview, Products/Solutions/Services Offered, Recent Developments, and MnM View (Key strengths/Right to Win, Strategic Choices Made, and Weaknesses and Competitive Threats))*
     11.1 KEY PLAYERS 
             11.1.1 3D SYSTEMS, INC.
                        TABLE 165 3D SYSTEMS, INC.: COMPANY OVERVIEW
                        FIGURE 55 3D SYSTEMS, INC.: COMPANY SNAPSHOT
                        TABLE 166 3D SYSTEMS, INC.: PRODUCTS/SOLUTIONS/SERVICES OFFERED
                        TABLE 167 3D SYSTEMS, INC.: DEALS
             11.1.2 ABB
                        TABLE 168 ABB: COMPANY OVERVIEW
                        FIGURE 56 ABB: COMPANY SNAPSHOT
                        TABLE 169 ABB: PRODUCTS/SOLUTIONS/SERVICES OFFERED
                        TABLE 170 ABB: DEALS
                        TABLE 171 ABB: PRODUCT LAUNCHES
             11.1.3 CISCO SYSTEMS, INC.
                        TABLE 172 CISCO SYSTEMS, INC.: COMPANY OVERVIEW
                        FIGURE 57 CISCO SYSTEMS, INC.: COMPANY SNAPSHOT
                        TABLE 173 CISCO SYSTEMS, INC.: PRODUCTS/SOLUTIONS/SERVICES OFFERED
                        TABLE 174 CISCO SYSTEMS, INC.: DEALS
             11.1.4 EMERSON ELECTRIC CO.
                        TABLE 175 EMERSON ELECTRIC CO.: COMPANY OVERVIEW
                        FIGURE 58 EMERSON ELECTRIC CO.: COMPANY SNAPSHOT
                        TABLE 176 EMERSON ELECTRIC CO.: PRODUCTS/SOLUTIONS/SERVICES OFFERED
                        TABLE 177 EMERSON ELECTRIC CO.: DEALS
             11.1.5 GENERAL ELECTRIC
                        TABLE 178 GENERAL ELECTRIC: COMPANY OVERVIEW
                        FIGURE 59 GENERAL ELECTRIC: COMPANY SNAPSHOT
                        TABLE 179 GENERAL ELECTRIC: PRODUCTS/SOLUTIONS/SERVICES OFFERED
                        TABLE 180 GENERAL ELECTRIC: PRODUCT LAUNCHES
             11.1.6 HONEYWELL INTERNATIONAL INC.
                        TABLE 181 HONEYWELL INTERNATIONAL INC.: COMPANY OVERVIEW
                        FIGURE 60 HONEYWELL INTERNATIONAL INC.: COMPANY SNAPSHOT
                        TABLE 182 HONEYWELL INTERNATIONAL INC.: PRODUCTS/SOLUTIONS/SERVICES OFFERED
                        TABLE 183 HONEYWELL INTERNATIONAL INC.: PRODUCT LAUNCHES
                        TABLE 184 HONEYWELL INTERNATIONAL INC.: DEALS
                        TABLE 185 HONEYWELL INTERNATIONAL INC.: OTHERS
             11.1.7 IBM
                        TABLE 186 IBM: COMPANY OVERVIEW
                        FIGURE 61 IBM: COMPANY SNAPSHOT
                        TABLE 187 IBM: PRODUCT/SOLUTIONS/SERVICES OFFERED
                        TABLE 188 IBM.: PRODUCT LAUNCHES
                        TABLE 189 IBM: DEALS
             11.1.8 MITSUBISHI ELECTRIC CORPORATION
                        TABLE 190 MITSUBISHI ELECTRIC CORPORATION: COMPANY OVERVIEW
                        FIGURE 62 MITSUBISHI ELECTRIC CORPORATION: COMPANY SNAPSHOT
                        TABLE 191 MITSUBISHI ELECTRIC CORPORATION: PRODUCTS/SOLUTIONS/SERVICES OFFERED
                        TABLE 192 MITSUBISHI ELECTRIC CORPORATION: PRODUCT LAUNCHES
                        TABLE 193 MITSUBISHI ELECTRIC CORPORATION: DEALS
                        TABLE 194 MITSUBISHI ELECTRIC CORPORATION: OTHERS
             11.1.9 ROCKWELL AUTOMATION
                        TABLE 195 ROCKWELL AUTOMATION: COMPANY OVERVIEW
                        FIGURE 63 ROCKWELL AUTOMATION: COMPANY SNAPSHOT
                        TABLE 196 ROCKWELL AUTOMATION: PRODUCT/SOLUTIONS/SERVICES OFFERED
                        TABLE 197 ROCKWELL AUTOMATION: PRODUCT LAUNCHES
                        TABLE 198 ROCKWELL AUTOMATION: DEALS
             11.1.10 SCHNEIDER ELECTRIC
                        TABLE 199 SCHNEIDER ELECTRIC: COMPANY OVERVIEW
                        FIGURE 64 SCHNEIDER ELECTRIC: COMPANY SNAPSHOT
                        TABLE 200 SCHNEIDER ELECTRIC: PRODUCTS/SOLUTIONS/SERVICES OFFERED
                        TABLE 201 SCHNEIDER ELECTRIC: PRODUCT LAUNCHES
                        TABLE 202 SCHNEIDER ELECTRIC: DEALS
             11.1.11 SIEMENS
                        TABLE 203 SIEMENS: COMPANY OVERVIEW
                        FIGURE 65 SIEMENS: COMPANY SNAPSHOT
                        TABLE 204 SIEMENS: PRODUCTS/SOLUTIONS/SERVICES OFFERED
                        TABLE 205 SIEMENS: PRODUCT LAUNCHES
                        TABLE 206 SIEMENS: DEALS
                        TABLE 207 SIEMENS: OTHERS
             11.1.12 ORACLE
                        TABLE 208 ORACLE: COMPANY OVERVIEW
                        FIGURE 66 ORACLE: COMPANY SNAPSHOT
                        TABLE 209 ORACLE: PRODUCTS/SOLUTIONS/SERVICES OFFERED
                        TABLE 210 ORACLE: PRODUCT LAUNCHES
             11.1.13 SAP
                        TABLE 211 SAP: COMPANY OVERVIEW
                        FIGURE 67 SAP: COMPANY SNAPSHOT
                        TABLE 212 SAP: PRODUCTS/SOLUTIONS/SERVICES OFFERED
                        TABLE 213 SAP: DEALS
                        TABLE 214 SAP: OTHERS
             11.1.14 STRATASYS
                        TABLE 215 STRATASYS: COMPANY OVERVIEW
                        FIGURE 68 STRATASYS: COMPANY SNAPSHOT
                        TABLE 216 STRATASYS: PRODUCTS/SOLUTIONS/SERVICES OFFERED
                        TABLE 217 STRATASYS: PRODUCT LAUNCHES
                        TABLE 218 STRATASYS: DEALS
                        TABLE 219 STRATASYS: OTHERS
             11.1.15 YOKOGAWA ELECTRIC CORPORATION
                        TABLE 220 YOKOGAWA ELECTRIC CORPORATION: COMPANY OVERVIEW
                        FIGURE 69 YOKOGAWA ELECTRIC CORPORATION: COMPANY SNAPSHOT
                        TABLE 221 YOKOGAWA ELECTRIC CORPORATION: PRODUCTS/SOLUTIONS/SERVICES OFFERED
                        TABLE 222 YOKOGAWA ELECTRIC CORPORATION: DEALS
                        TABLE 223 YOKOGAWA ELECTRIC CORPORATION: OTHERS
     11.2 OTHER KEY PLAYERS 
             11.2.1 COGNEX CORPORATION
             11.2.2 GOOGLE
             11.2.3 INTEL CORPORATION
             11.2.4 KEYENCE CORPORATION
             11.2.5 NVIDIA CORPORATION
             11.2.6 PTC
             11.2.7 SAMSUNG
             11.2.8 SONY
             11.2.9 UNIVERSAL ROBOTS A/S
             11.2.10 OMRON CORPORATION
*Details on Business Overview, Products/Solutions/Services Offered, Recent Developments, and MnM View (Key strengths/Right to Win, Strategic Choices Made, and Weaknesses and Competitive Threats) might not be captured in case of unlisted companies.  
 
12 ADJACENT & RELATED MARKETS (Page No. - 322)
     12.1 INTRODUCTION 
     12.2 LIMITATION 
     12.3 REAL-TIME LOCATION SYSTEMS MARKET, BY OFFERING 
             FIGURE 70 RTLS MARKET, BY OFFERING
             TABLE 224 RTLS MARKET, BY OFFERING, 2019–2022 (USD MILLION)
             TABLE 225 RTLS MARKET, BY OFFERING, 2023–2028 (USD MILLION)
     12.4 HARDWARE 
             12.4.1 INCREASING DEMAND FOR HYBRID RTLS SOLUTIONS TO DRIVE SEGMENTAL GROWTH
                        TABLE 226 HARDWARE: RTLS MARKET, BY TYPE, 2019–2022 (USD MILLION)
                        TABLE 227 HARDWARE: RTLS MARKET, BY TYPE, 2023–2028 (USD MILLION)
                        TABLE 228 HARDWARE: RTLS MARKET, BY TECHNOLOGY, 2019–2022 (USD MILLION))
                        TABLE 229 HARDWARE: RTLS MARKET, BY TECHNOLOGY, 2023–2028 (USD MILLION)
             12.4.2 TAGS/BADGES
                        12.4.2.1 Rising use of RTLS tags to track assets in real time to boost segmental growth
             12.4.3 READERS/TRACKERS/ACCESS POINTS
                        12.4.3.1 Growing deployment of readers to send and receive signals from transponders to propel market
             12.4.4 OTHER HARDWARE PRODUCTS
     12.5 SOFTWARE 
             12.5.1 GROWING DEMAND FOR CUSTOMIZED RTLS TO BOOST USE OF SOFTWARE SOLUTIONS TO CONTRIBUTE TO SEGMENTAL GROWTH
                        TABLE 230 SOFTWARE: RTLS MARKET, BY TECHNOLOGY, 2019–2022 (USD MILLION)
                        TABLE 231 SOFTWARE: RTLS MARKET, BY TECHNOLOGY, 2023–2028 (USD MILLION)
     12.6 SERVICES 
             12.6.1 INCLINATION OF INDUSTRIES TOWARD IMPROVING OPERATIONAL EFFICIENCY, SAFETY, AND SECURITY TO INCREASE DEMAND FOR RTLS SERVICES
                        TABLE 232 SERVICES: RTLS MARKET, BY TYPE, 2019–2022 (USD MILLION)
                        TABLE 233 SERVICES: RTLS MARKET, BY TYPE, 2023–2028 (USD MILLION)
                        TABLE 234 SERVICES: RTLS MARKET, BY TECHNOLOGY, 2019–2022 (USD MILLION)
                        TABLE 235 SERVICES: RTLS MARKET, BY TECHNOLOGY, 2023–2028 (USD MILLION)
             12.6.2 DEPLOYMENT & INTEGRATION
                        12.6.2.1 Rising use of customized and application-specific RTLS to increase demand for deployment & integration services
             12.6.3 SUPPORT & MAINTENANCE
                        12.6.3.1 Requirement for uninterrupted operations to fuel demand for support & maintenance services
             12.6.4 CONSULTING
                        12.6.4.1 Focus of organizations on increasing workflow efficiency to drive demand for consulting services
 
13 APPENDIX (Page No. - 333)
     13.1 INSIGHTS FROM INDUSTRY EXPERTS 
     13.2 DISCUSSION GUIDE 
     13.3 KNOWLEDGESTORE: MARKETSANDMARKETS’ SUBSCRIPTION PORTAL 
     13.4 AVAILABLE CUSTOMIZATIONS 
     13.5 RELATED REPORTS 
     13.6 AUTHOR DETAILS 


The study involves four significant activities for estimating the size of the Smart Manufacturing market. Exhaustive secondary research has been conducted to collect information related to the market. The next step is to validate these findings and assumptions related to the market size with industry experts across the value chain through primary research. Both top-down and bottom-up approaches have been employed to estimate the overall size of the Smart Manufacturing market. After that, market breakdown and data triangulation procedures were used to determine the extent of different segments and subsegments of the market.

Secondary Research

Secondary sources for this research study included corporate filings (such as annual reports, investor presentations, and financial statements); trade, business, and professional associations; white papers; certified publications; articles by recognized authors; directories; and databases. The secondary data has been collected and analyzed to determine the overall market size, further validated through primary research.

Primary Research

Extensive primary research has been conducted after gaining knowledge about the current scenario of the Smart Manufacturing market through secondary research. Several primary interviews have been conducted with experts from the demand and supply sides across four major regions—North America, Europe, Asia Pacific, and RoW. This primary data has been collected through questionnaires, emails, and telephonic interviews.

Smart Manufacturing Market Size, and Share

To know about the assumptions considered for the study, download the pdf brochure

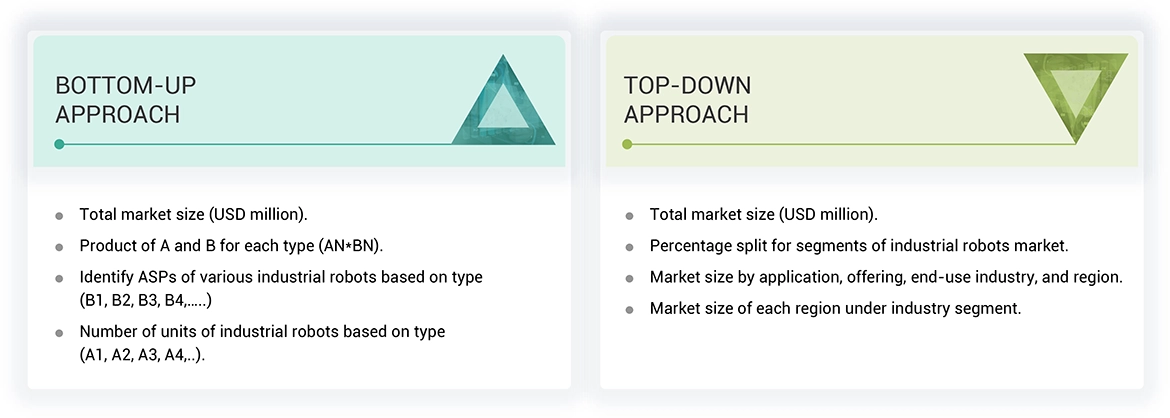
Market Size Estimation

In the complete market engineering process, top-down and bottom-up approaches and several data triangulation methods have been implemented to estimate and validate the size of the Smart Manufacturing market and other dependent submarkets listed in this report.

  • The key players in the industry and markets have been identified through extensive secondary research.
  • The supply chain of the industry and the market size, in terms of value, have been determined through primary and secondary research.
  • All percentage shares, splits, and breakdowns have been determined using secondary sources and verified through primary sources.

Smart Manufacturing Market: Top-Down Approach

  • In the top-down approach, the overall market size has been used to estimate the size of the individual markets (mentioned in the market segmentation) through percentage splits obtained from secondary and primary research.
  •  For calculating the Smart Manufacturing market segments, the market size obtained by implementing the bottom-up approach has been used to implement the top-down approach, which was later confirmed with the primary respondents across different regions.
  • The bottom-up approach has also been implemented for the data extracted from secondary research to validate the market size of various segments.
  • Each company’s market share has been estimated to verify the revenue shares used earlier in the bottom-up approach. With the help of data triangulation and validation of data through primaries, the size of the overall Smart Manufacturing and each market have been determined and confirmed in this study.

Smart Manufacturing Market Size, and Top-Down Approach

Smart Manufacturing Market: Bottom-Up Approach

  • Identifying various industries using or expected to deploy Smart manufacturing by its IT & ET components at their facilities.
  • Analyzing the use cases across different regions and companies.
  • Estimating the size of the Smart manufacturing market on the basis of the demand from these industries and companies
  • Tracking the ongoing and upcoming installation contracts, acquisitions, expansions, and product launches by various companies, and forecasting the market based on these developments and other critical parameters.
  • Conducting multiple discussions with key opinion leaders to understand Smart manufacturing components by companies in these industries to analyze the break-up of the scope of work carried out by each major company providing Smart manufacturing components.
  • Arriving at the market estimates by analyzing the country-wise sales of Smart manufacturing solutions companies and combining this data to get the regional market estimates.
  • Verifying and crosschecking the estimates at every level through discussions with key opinion leaders, including CEOs, directors, operations managers, and domain experts at MarketsandMarkets
  • Studying various paid and unpaid information sources, such as annual reports, press releases, and white papers

Smart Manufacturing Market Size, and Bottom-Up Approach

Data Triangulation

After arriving at the overall market size, the total market has been split into several segments. The market breakdown and data triangulation procedures have been employed wherever applicable to complete the overall market engineering process and arrive at exact statistics for all segments. The data was then triangulated by studying various factors and trends from both the demand and supply sides. The market has also been validated using both top-down and bottom-up approaches.

Market Definition

Smart manufacturing is the combination of systems that integrate with each other to provide real-time data to ascertain the changing demands and requirements of the manufacturing sector. It is capable of solving the current and future problems of manufacturing through an open infrastructure, which encompasses various information from enabling technology solutions. It also fosters flexibility in manufacturing processes and provides cost-effectiveness and agility. The smart manufacturing market comprises players that offer solutions based on different smart manufacturing technologies. The market is diversified, with many companies competing across the value chain to sustain their position in the market and increase their market shares. The smart manufacturing market is likely to witness significant growth in the near future, primarily due to the increasing use of industrial automation in the manufacturing sector. The oil & gas, energy & power, and pharmaceutical industries are at the forefront of implementing smart manufacturing solutions and together account for a major share of the revenue share of the global smart manufacturing market in the process industry. The major players in the smart manufacturing market include 3D System, Inc. (US), ABB (Switzerland), Cisco System, Inc. (US), Emerson Electric Co. (US), General Electric (US), Honeywell International Inc. (US), IBM (US), Mitsubishi Electric Corporation (Japan), Rockwell Automation (US), Schneider Electric (France), Siemens (Germany), Oracle (US), SAP (Germany), Stratasys (US), Yokogawa Electric Corporation(Japan).

Key Stakeholders

  • Original equipment manufacturers (OEMs)
  • Providers of technology solutions
  • Research institutes
  • Market research and consulting firms
  • Forums, alliances, and associations related to Smart Manufacturing
  • Technology investors
  • Governments and financial institutions
  • Analysts and strategic business planners
  • Existing end users and prospective ones

Report Objectives:

  • To describe and forecast the Smart Manufacturing market in terms of value based on information technology, enabling technology, and Industry
  • To describe and forecast the Smart Manufacturing market size in terms of value for four main regions, namely, North America, Europe, Asia Pacific, and the Rest of the World (RoW)
  • To provide detailed information regarding the drivers, restraints, opportunities, and challenges influencing the growth of the Smart Manufacturing market
  • To provide a detailed overview of the supply chain of the ecosystem
  • To analyze opportunities in the market for various stakeholders by identifying the high-growth segments of the market
  • To analyze the probable impact of the recession on the market in future
  • To benchmark the market players using the proprietary company evaluation matrix framework, which analyzes the market players on various parameters within the broad categories of market ranking/share and product portfolio.
  • To analyze competitive developments such as acquisitions, product launches, partnerships, expansions, and collaborations undertaken in the Smart Manufacturing market

Available Customization:

With the given market data, MarketsandMarkets offers customizations according to the company’s specific needs. The following customization options are available for this report:

Company Information:

  • Detailed analysis and profiling of additional five market players
Custom Market Research Services

We will customize the research for you, in case the report listed above does not meet with your exact requirements. Our custom research will comprehensively cover the business information you require to help you arrive at strategic and profitable business decisions.

Request Customization

Instant Answers with GPT - Ask Now!

Ask real questions. Get complete answers !
Report Code
SE 6677
Published ON
Aug, 2023
Choose License Type
BUY NOW
  • SHARE
X
Request Customization
Speak to Analyst
Speak to Analyst
OR FACE-TO-FACE MEETING
PERSONALIZE THIS RESEARCH
  • Triangulate with your Own Data
  • Get Data as per your Format and Definition
  • Gain a Deeper Dive on a Specific Application, Geography, Customer or Competitor
  • Any level of Personalization
REQUEST A FREE CUSTOMIZATION
LET US HELP YOU!
  • What are the Known and Unknown Adjacencies Impacting the Smart Manufacturing Market
  • What will your New Revenue Sources be?
  • Who will be your Top Customer; what will make them switch?
  • Defend your Market Share or Win Competitors
  • Get a Scorecard for Target Partners
CUSTOMIZED WORKSHOP REQUEST
+1-888-600-6441
  • Call Us
  • +1-888-600-6441 (Corporate office hours)
  • +1-888-600-6441 (US/Can toll free)
  • +44-800-368-9399 (UK office hours)
CONNECT WITH US
ABOUT TRUST ONLINE
©2024 MarketsandMarkets Research Private Ltd. All rights reserved
DMCA.com Protection Status Website Feedback