Data Center Infrastructure Management Market by DCIM Software (Monitoring, Operations & Management) and Functionality (Asset Management, Operational Monitoring, Performance Optimization, Configuration, Reporting & Dashboards) - Global Forecast to 2031

icon1
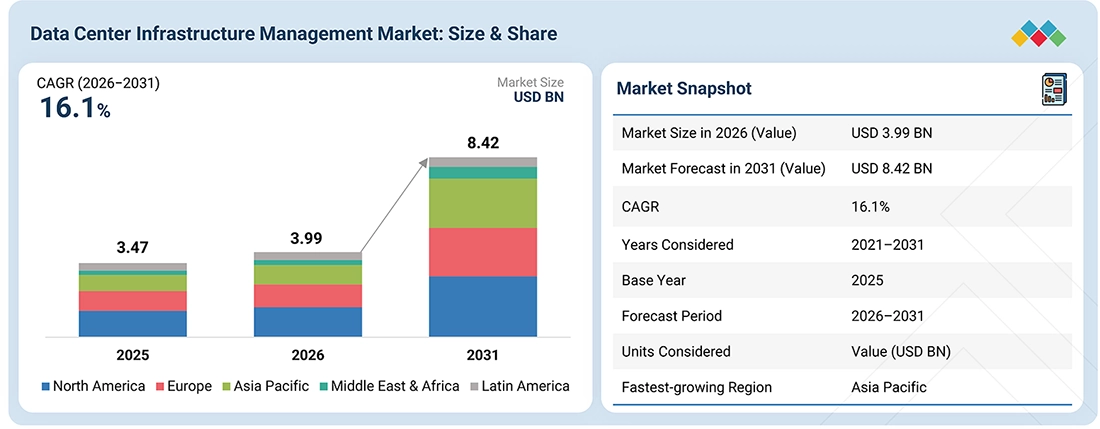
USD 8.42 BN
MARKET SIZE, 2031
icon2
CAGR 16.1%
(2026-2031)
icon3
330
REPORT PAGES
icon4
350
MARKET TABLES

OVERVIEW

data-center-infrastructure-management-market Overview

Source: Secondary Research, Interviews with Experts, MarketsandMarkets Analysis

The global data center infrastructure management (DCIM) market is projected to grow from USD 3.99 billion in 2026 to USD 8.42 billion by 2031, reflecting a 16.1% CAGR over the forecast period. Growth is driven by rising data center complexity, AI and high-density workloads, higher power and cooling requirements, and the need for centralized infrastructure visibility. Organizations are increasingly adopting DCIM to monitor assets, capacity, power, cooling, environmental conditions, and infrastructure performance through integrated platforms. The expansion of hyperscale, colocation, enterprise, and edge data centers is further increasing demand for real-time monitoring, predictive analytics, automation, and energy optimization. A growing emphasis on operational efficiency and sustainability is also encouraging operators to adopt DCIM solutions that improve resource utilization, support predictive maintenance, and optimize infrastructure performance across distributed data center environments.

KEY TAKEAWAYS

  • BY REGION
    North America is expected to account for the largest market value of USD 1.4 billion in 2026.
  • BY OFFERING
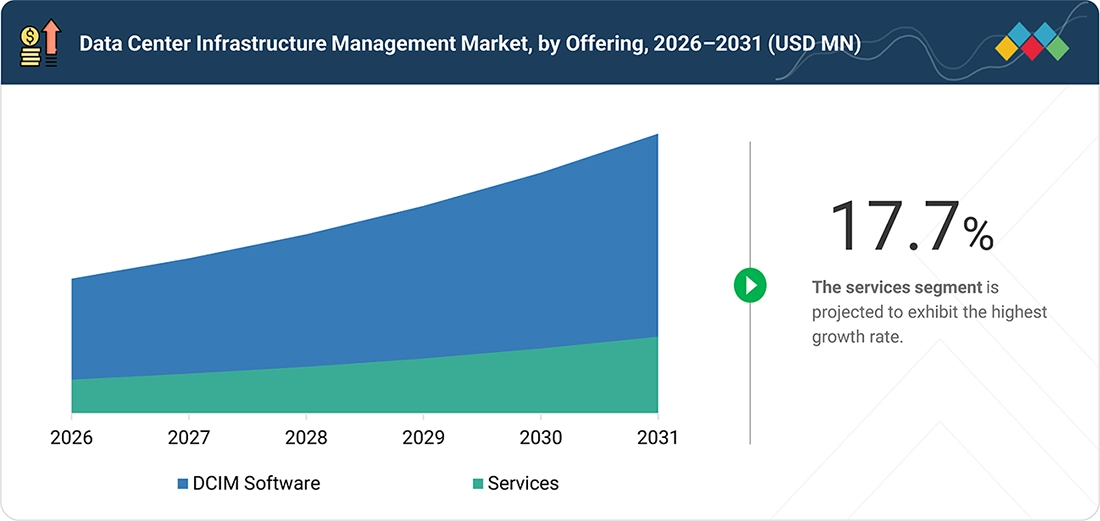
    The services segment is expected to grow at the highest CAGR of 17.7% during the forecast period.
  • BY FUNCTIONALITY
    The asset management segment is expected to hold the largest market value of USD 1.2 billion in 2026.
  • BY DEPLOYMENT TYPE
    The cloud segment is expected to register the highest CAGR during the forecast period.
  • BY TIER TYPE
    Tier 4 is expected to dominate the market.
  • BY DATA CENTER SIZE
    The small data centers segment is expected grow at the highest CAGR.
  • BY END USER
    The enterprises segment is expected to lead with the largest market value.
  • COMPETITIVE LANDSCAPE - KEY PLAYERS
    Key players such as Schneider Electric, Vertiv, Johnson Controls, Eaton, and Delta Electronics stand out as Stars in the DCIM market due to their strong portfolios in power, cooling, automation, and real-time monitoring.
  • COMPETITIVE LANDSCAPE - STARTUPS
    SMEs and startups such as Cormant, RF Code, Rackwise, and Paessler act as agile innovators in the DCIM landscape, offering highly specialized and cost-effective solutions tailored for mid-sized and distributed data centers.

The DCIM market is growing steadily as data centers expand in size and complexity, increasing the need for centralized monitoring, capacity planning, and energy optimization. Rising investments in digital infrastructure, AI workloads, and sustainability initiatives are accelerating adoption, especially as operators seek real-time visibility and efficiency gains. This growth is further supported by modernization efforts in both hyperscale and enterprise facilities.

TRENDS & DISRUPTIONS IMPACTING CUSTOMERS' CUSTOMERS

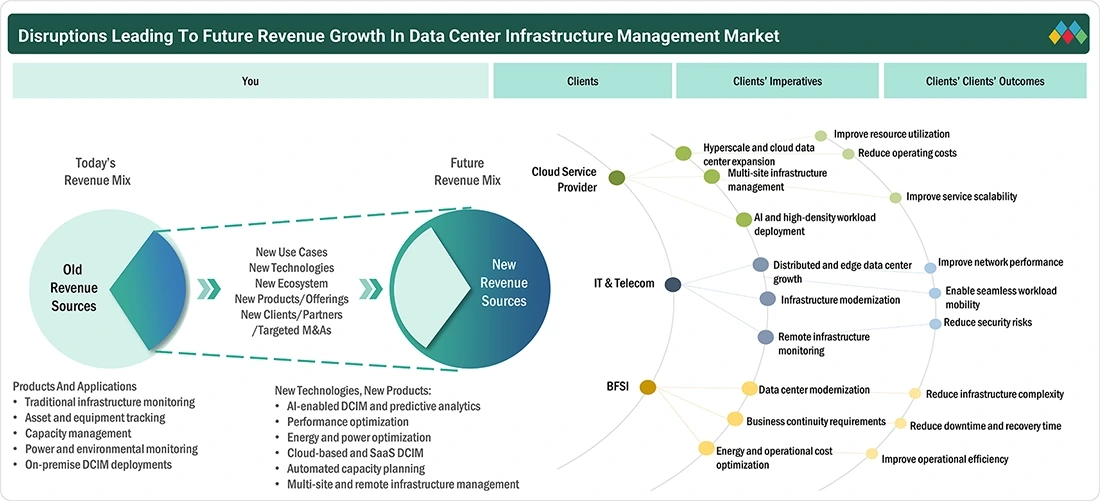
Key trends and disruptions in the DCIM market include the growing integration of AI-driven analytics, predictive maintenance, automation, and performance optimization into infrastructure management platforms. The expansion of high-density AI workloads is increasing the need for real-time monitoring of power, cooling, capacity, and equipment performance. The growth of edge and distributed data centers is also creating demand for remote monitoring and centralized management across geographically dispersed facilities. Rising energy consumption and sustainability requirements are encouraging operators to adopt DCIM tools that support power monitoring, energy optimization, cooling management, and infrastructure efficiency. Meanwhile, cybersecurity and compliance requirements are increasing the need for secure integration between DCIM platforms and IT, BMS, and EPMS environments. The shift toward cloud-based and multi-site DCIM is further changing infrastructure management by enabling centralized visibility, remote operations, analytics, and scalable management across diverse data center environments.

data-center-infrastructure-management-market Disruptions

Source: Secondary Research, Interviews with Experts, MarketsandMarkets Analysis

MARKET DYNAMICS

Drivers
Impact
Level
  • Growing adoption of AI and high-density data centers
  • Growing demand for energy-efficient solutions
RESTRAINTS
Impact
Level
  • High implementation costs of DCIM solutions
  • Complexity and cost of deploying DCIM across heterogeneous infrastructure
OPPORTUNITIES
Impact
Level
  • Growing investments in data center technologies
  • Rising adoption of edge data centers
CHALLENGES
Impact
Level
  • Concerns over data privacy and security
  • Lack of skilled professionals

Source: Secondary Research, Interviews with Experts, MarketsandMarkets Analysis

Driver: Growing adoption of AI and high-density data centers

AI and accelerated computing are increasing power and thermal densities in data centers, driving demand for DCIM solutions that provide real-time visibility into power, cooling, capacity, and equipment performance. DCIM platforms are increasingly integrating power, cooling, and IT systems to support capacity planning and infrastructure optimization. In June 2025, Schneider Electric introduced EcoStruxure solutions for high-density AI clusters, and in March 2025, Vertiv launched Environet for real-time power and thermal infrastructure management. These developments highlight the shift toward integrated monitoring, analytics, and optimization for AI and hyperscale data center environments.

Restraint: High implementation costs of DCIM solutions

High implementation costs are expected to remain a key restraint on DCIM adoption, as organizations must invest in software licenses, environmental sensors, dedicated servers, and ongoing maintenance and training. These expenses can be challenging for small and medium-sized enterprises with limited budgets, often leading to delayed or scaled-back deployments. However, the long-term benefits—such as improved efficiency, accurate reporting, lower energy consumption, and reduced downtime—typically outweigh the initial investment. Avoiding DCIM can lead to higher operational risks and missed optimization opportunities. With proper planning and budgeting, organizations can justify the cost and achieve meaningful long-term performance gains.

Opportunity: Growing investments in data center technologies

Growing investments in data center infrastructure are creating strong opportunities for the DCIM market. With global investments exceeding USD 22 billion in the first five months of 2024, organizations are expanding capacity and upgrading facilities, increasing the need for advanced tools to manage complex environments and improve efficiency. As data centers scale to support high-performance, energy-intensive workloads, DCIM becomes essential for resource optimization and operational visibility. Sustainability initiatives further accelerate adoption, as DCIM solutions provide critical insights into energy usage and support carbon-reduction goals. Recent investments and strategic moves by major players such as Microsoft, CoreWeave, DataNovaX, and Cologix highlight the growing emphasis on modern, efficient, and well-managed data center operations.

Challenge: Concerns over data privacy and security

Managing data center infrastructure has become increasingly challenging amid growing concerns about data privacy and security. Modern data centers process large volumes of sensitive information, making them prime targets for cyberattacks and sophisticated intrusions. Operators must implement robust security measures, including encryption, firewalls, and intrusion detection systems, while continuously monitoring evolving threats. Regulations such as GDPR and CCPA further increase compliance obligations, with significant penalties for violations. The main challenge is balancing robust security with operational efficiency, as excessive controls can degrade performance or raise costs. As a result, data centers need a comprehensive management approach that ensures strong protection and smooth, compliant operations.

DATA CENTER INFRASTRUCTURE MANAGEMENT MARKET: COMMERCIAL USE CASES ACROSS INDUSTRIES

COMPANY USE CASE DESCRIPTION BENEFITS
company logo
Leading Edge Data Centres (LEDC), aiming to bridge the “digital divide” in regional Australia, partnered with Schneider Electric to deploy a network of prefabricated Tier-III edge data centers. LEDC uses EcoStruxure IT and other Schneider Electric infrastructure to monitor and manage its geographically dispersed sites in real time. LEDC significantly enhanced service reliability and uptime for regional customers by leveraging remote monitoring and proactive analytics. The company also reduced deployment complexity and costs by using Schneider’s prefabricated data center modules, enabling faster and more scalable network roll-out.
company logo
Computacenter, a leading UK-based IT infrastructure services provider, used Nlyte’s DCIM suite to centralize visibility across its data centers (including newly acquired ones) and to model, predict, and optimize capacity. Computacenter achieved more accurate, usage-based billing and improved SLA alignment through real-time power and capacity visibility. Audit time was reduced from three weeks to under one week, improving data accuracy and compliance. The company also boosted operational efficiency by enabling proactive maintenance and optimizing space, power, and cooling across its facilities.
company logo
Vodafone deployed Sunbird’s DCIM solution to gain real-time insight into its global data centers, leveraging environmental sensors at different rack heights and unified dashboards. With this platform, Vodafone consolidated its asset inventory, capacity management, and power monitoring across all sites. Using temperature data from the racks, Vodafone identified overcooling and safely raised set-points, resulting in significant energy savings. Vodafone also improved operational agility by having a centralized, real-time view of rack capacity and device relationships, enabling faster deployment decisions.
company logo
FNT Software helped DataVita, a rapidly growing colocation and cloud provider, to document and manage its data center infrastructure using the FNT Command DCIM platform. The system captures all physical, logical, and network assets including cabling, power, cooling, and IT devices in a unified, dynamically updating repository. DataVita gained full visibility into its infrastructure, significantly improving capacity planning and resource utilization across its two buildings. The platform’s multi-tenancy features ensured data separation and compliance, reducing risk and supporting GDPR requirements. Meanwhile, integrated workflows and real-time asset tracking helped streamline operations, lower operating costs, and accelerate decision-making.

Logos and trademarks shown above are the property of their respective owners. Their use here is for informational and illustrative purposes only.

MARKET ECOSYSTEM

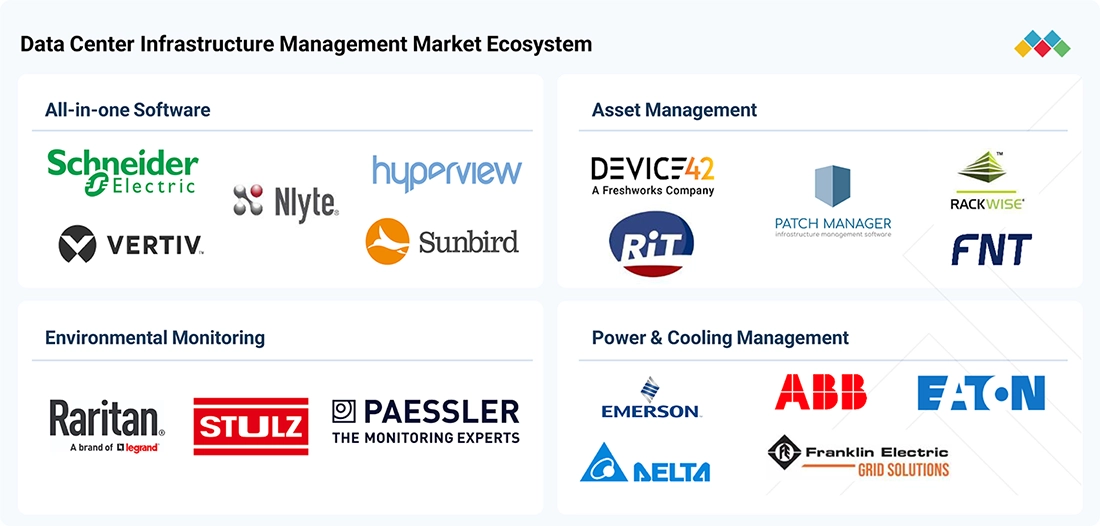
The DCIM ecosystem includes a mix of comprehensive platforms and specialized tools that address key functions such as asset tracking, power and cooling optimization, capacity planning, and environmental monitoring. All-in-one DCIM suites offer centralized oversight of data center operations, while focused solutions support specific needs like energy management and resource forecasting. These tools help enterprises, colocation providers, and edge facilities manage growing infrastructure complexity, improve efficiency, and maintain optimal performance. Understanding how these solutions complement each other is essential for selecting the right DCIM capabilities.

data-center-infrastructure-management-market Ecosystem

Logos and trademarks shown above are the property of their respective owners. Their use here is for informational and illustrative purposes only.

MARKET SEGMENTS

data-center-infrastructure-management-market Segments

Source: Secondary Research, Interviews with Experts, MarketsandMarkets Analysis

Data Center Infrastructure Management Market, By Offering

DCIM software is expected to hold the largest market share over the forecast period, supported by the growing adoption of integrated platforms for monitoring and managing complex data center infrastructure. DCIM software provides centralized visibility into assets, capacity, power, cooling, environmental conditions, and infrastructure performance. The growing deployment of hyperscale, colocation, enterprise, and edge facilities is driving demand for scalable software that supports distributed environments. Services are expected to grow fastest, driven by rising demand for design and consulting, integration and deployment, and support and maintenance as organizations implement and optimize DCIM platforms across increasingly complex infrastructure.

Data Center Infrastructure Management Market, By Functionality

Asset management is expected to hold the largest market share during the forecast period, as operators require accurate visibility into IT and facility assets across increasingly complex data center environments. Asset management supports asset tracking, lifecycle management, utilization monitoring, and capacity planning, helping operators improve resource allocation and infrastructure visibility. Performance optimization is expected to grow fastest, driven by rising rack densities, AI workloads, and the need to optimize power, cooling, equipment performance, and infrastructure utilization. The integration of real-time analytics, automation, and predictive capabilities is further increasing demand for performance optimization functionality.

Data Center Infrastructure Management Market, By Deployment Type

Cloud-based DCIM is expected to post the highest CAGR over the forecast period as organizations increasingly seek scalable, flexible platforms to manage distributed data center infrastructure. Cloud deployment enables remote monitoring, centralized management, faster updates, and integration across geographically dispersed facilities. Its scalability also makes it well suited for organizations managing multiple enterprise, colocation, edge, and hybrid environments. The growing adoption of AI, cloud infrastructure, and distributed computing is expected to further drive demand for cloud-based DCIM platforms.

Data Center Infrastructure Management Market, By Tier Type

Tier 3 data centers are expected to achieve the highest CAGR over the forecast period, driven by rising demand for highly available, maintainable infrastructure across enterprise, colocation, cloud, and digital service environments. Tier 3 facilities require continuous visibility into power, cooling, IT equipment, and supporting infrastructure to ensure operational continuity. DCIM solutions enable operators to monitor infrastructure conditions, manage capacity, track assets, and identify potential issues via automated alerts and analytics. Modernization and expansion of Tier 3 facilities are expected to further drive DCIM adoption.

Data Center Infrastructure Management Market, By Data Center Size

Small data centers are expected to post the highest CAGR over the forecast period, driven by the expansion of edge computing, distributed IT infrastructure, localized digital services, and smaller enterprise and cloud facilities. These environments increasingly require remote monitoring and centralized infrastructure visibility, yet operate with limited on-site resources. DCIM solutions can support asset tracking, capacity planning, power and environmental monitoring, and remote infrastructure management. Cloud-based, scalable DCIM platforms are particularly relevant for smaller facilities seeking to improve operational efficiency without deploying complex management environments.

Data Center Infrastructure Management Market, By End User

Cloud service providers are expected to post the highest CAGR over the forecast period, supported by the continued expansion of cloud infrastructure, hyperscale facilities, AI workloads, and distributed computing. Their large, geographically dispersed data center environments require centralized monitoring, capacity planning, asset management, energy optimization, and infrastructure performance management. Rising rack densities and dynamic workloads are further strengthening the need for automated and predictive infrastructure management. DCIM platforms enable cloud service providers to improve infrastructure utilization, coordinate power and cooling resources, and maintain operational visibility across multiple facilities.

REGION

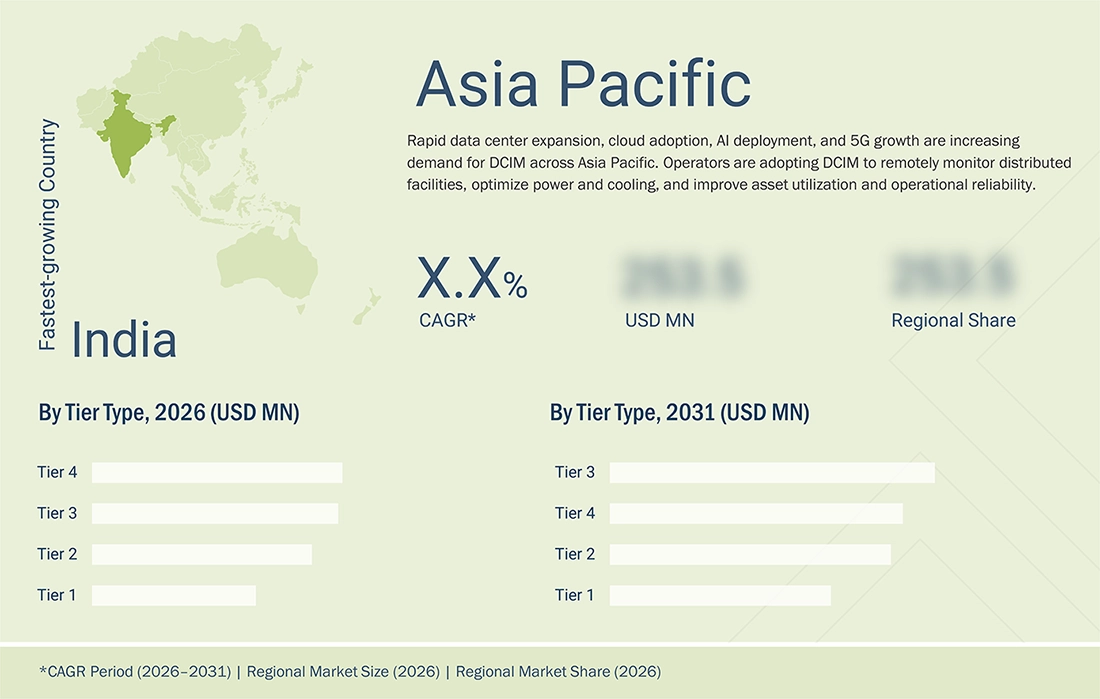
Asia Pacific is expected to register the fastest growth in the data center infrastructure management market during the forecast period

Asia Pacific is expected to lead the DCIM market's growth during the forecast period, supported by rapid data center capacity expansion, cloud adoption, digital transformation, and rising investment in AI infrastructure. Countries such as China, India, Japan, Singapore, Australia, and South Korea are expanding data center facilities to support cloud services, digital applications, enterprise workloads, and high-performance computing. The growth of hyperscale, colocation, and edge facilities is increasing demand for centralized monitoring, capacity planning, energy optimization, and infrastructure automation. Rising power consumption and sustainability requirements are also prompting operators to improve visibility into energy and cooling performance. At the same time, modernizing existing facilities is creating opportunities for DCIM providers to deploy cloud-based monitoring, predictive analytics, remote management, and integrated infrastructure management platforms. These factors are expected to drive strong DCIM adoption across the region.

data-center-infrastructure-management-market Region

DATA CENTER INFRASTRUCTURE MANAGEMENT MARKET: COMPANY EVALUATION MATRIX

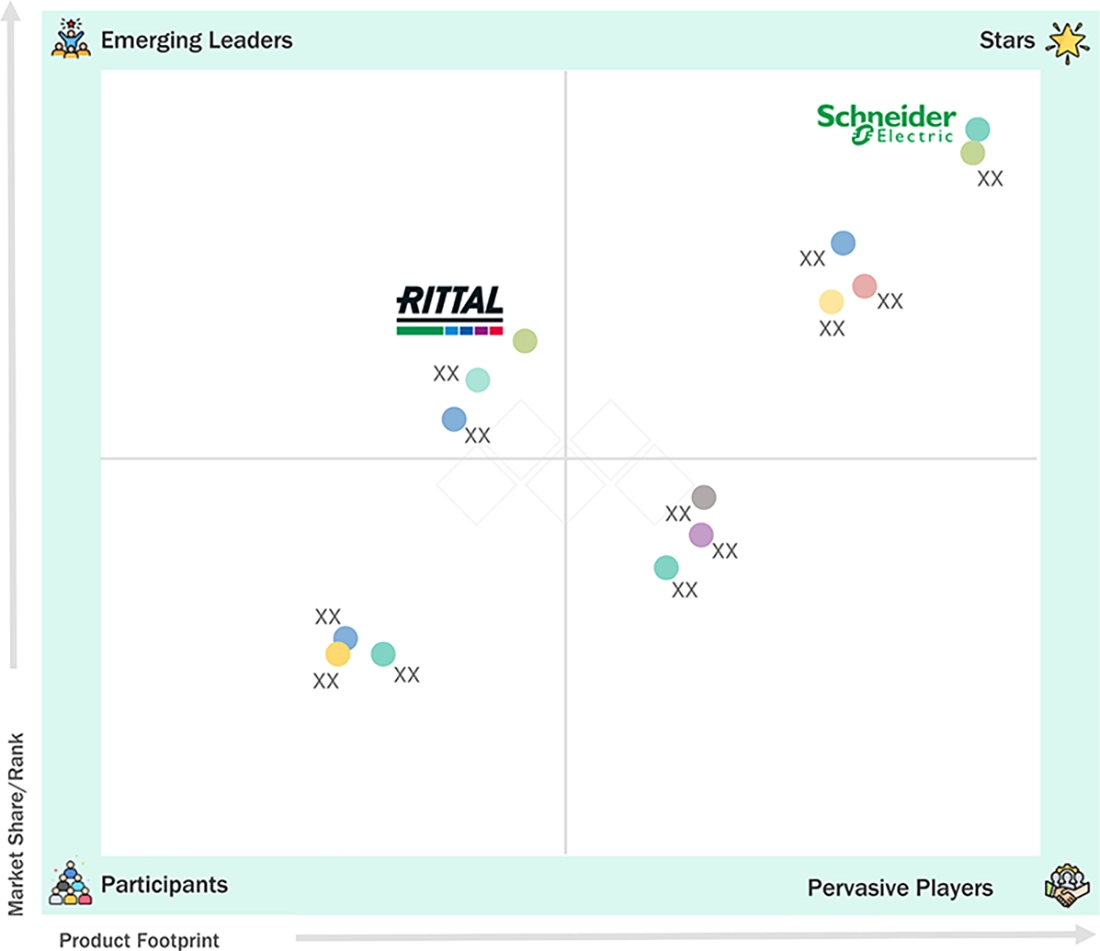
In the DCIM market, Schneider Electric is positioned as a Star, supported by its strong DCIM portfolio, broad data center infrastructure capabilities, and the established EcoStruxure IT platform. The company offers integrated capabilities spanning infrastructure monitoring, asset management, capacity planning, power and cooling management, analytics, and operational optimization. Rittal is positioned as an Emerging Leader, supported by its established data center infrastructure portfolio, modular data center solutions, cooling systems, and a growing focus on integrated monitoring and infrastructure management. Rittal's capabilities in physical infrastructure and thermal management strengthen its ability to address evolving data center requirements. The competitive positioning of these companies is influenced by product breadth, DCIM functionality, infrastructure integration, monitoring capabilities, automation, energy efficiency, and the ability to support increasingly complex data center environments.

data-center-infrastructure-management-market Evaluation Metrics

Source: Secondary Research, Interviews with Experts, MarketsandMarkets Analysis

KEY MARKET PLAYERS

  • Schneider Electric (France)
  • Vertiv (US)
  • Eaton (US)
  • Johnson Controls (US)
  • Siemens (Germany)
  • Nlyte Software (US)
  • Huawei (China)
  • ABB (Switzerland)
  • Sunbird Software (US)
  • FNT Software (Germany)
  • Cormant (Philippines)
  • RF Code (US)
  • RACKWISE (US)
  • Paessler (Germany)
  • iTRACS (US)
  • STULZ (Germany)
  • Device42 (US)
  • Hyperview (Canada)
  • Rittal (Germany)
  • Patch Manager (Netherlands)
  • ManageEngine (US)
  • GreenField Software (India)
  • ISPsystem (Cyprus)
  • Delta Electronics (Taiwan)
  • ZPE Systems (US)
  • Modius (US)
  • NetZoom (US)
  • EkkoSense (UK)
  • CenterOS (New Zealand)
  • TeeCube Solutions (India)
  • UnitedLayer (US)
  • RiT Tech (Israel)

MARKET SCOPE

REPORT METRIC DETAILS
Market Size in 2025 (Value) USD 3.47 Billion
Market Size in 2026 (Value) USD 3.99 Billion
Market Forecast in 2031 (Value) USD 8.42 Billion
Growth Rate CAGR of 16.1% from 2026 to 2031
Years Considered 2021–2031
Base Year 2025
Forecast Period 2026–2031
Units Considered Value (USD Billion)
Report Coverage Revenue Forecast, Company Ranking, Competitive Landscape, Growth Factors, and Trends
Segments Covered
  • By Offering:
    • DCIM Software
    • Service
  • By DCIM Software:
    • Monitoring
    • Operations & Management
  • By Service:
    • Design & Consulting
    • Integration & Deployment
    • Support & Maintenance
  • By Functionality:
    • Performance Optimization
    • Asset Management
    • Configuration
    • Operational Monitoring
    • Reporting & Dashboards
    • Other Functionalities
  • By Deployment Type:
    • On-premises
    • Cloud
  • By Tier Type:
    • Tier 1
    • Tier 2
    • Tier 3
    • Tier 4
  • By Data Center Size:
    • Small Data Centers
    • Mid-sized Data Centers
    • Lage Data Centers
  • By End User:
    • Enterprises
    • Telecom Service Providers
    • Cloud Service Providers
Regional Scope North America, Asia Pacific, Europe, Middle East & Africa, Latin America

WHAT IS IN IT FOR YOU: DATA CENTER INFRASTRUCTURE MANAGEMENT MARKET REPORT CONTENT GUIDE

data-center-infrastructure-management-market Content Guide

DELIVERED CUSTOMIZATIONS

We have successfully delivered the following deep-dive customizations:

CLIENT REQUEST CUSTOMIZATION DELIVERED VALUE ADDS
Leading Solution Provider (US) In-depth segmentation of the North American DCIM Market Extended regional breakdowns for: Europe Asia Pacific Middle East & Africa Latin America
  • Identifies high-growth opportunities across digital transformation, cloud adoption, and enterprise modernization
  • Enables tailored integration strategies aligning applications, infrastructure, and data systems
  • Supports optimized technology investments and resource alignment to enhance interoperability, scalability, and operational efficiency across connected business environments
Leading Solution Provider (EU) Detailed profiling of additional market players (up to 5 vendors), including product portfolios, strategic initiatives, and regional presence
  • Enhances competitive intelligence for strategic planning and go-to-market execution
  • Reveals market gaps and white spaces for differentiation and innovation
  • Supports targeted growth initiatives by aligning product development and sales strategies with unmet customer needs and emerging demand clusters

RECENT DEVELOPMENTS

  • August 2026 : Cisco expanded its Secure AI Factory with NVIDIA, leveraging rack-scale AI computing solutions developed with Supermicro. The architecture combines high-density compute, AI networking, and security, with an NVIDIA Cloud Partner-compliant design for neocloud, sovereign cloud, enterprise, and large-scale AI workloads, extending Cisco's SDDC-relevant capabilities across the full infrastructure stack.
  • August 2026 : Nutanix introduced an open-source Model Context Protocol server for the Nutanix Cloud Platform, enabling AI agents and developer tools to interact with the platform via its Prism API. The development brings natural-language and agentic automation to hybrid cloud operations while preserving enterprise visibility and control across infrastructure environments.
  • July 2026 : Microsoft partnered with 3M to deploy Expanded Beam Optical technology across Azure infrastructure, targeting the physical networking needs of rapidly expanding AI and cloud workloads. The collaboration is expected to improve optical connectivity within hyperscale infrastructure as Microsoft continues to expand its AI data center footprint.
  • June 2026 : Arista Networks launched its 7060XE7 portfolio of 1.6T networking platforms for rack-scale AI infrastructure. The platforms support scale-up and scale-out AI fabrics and are designed for high-density, power-efficient networking across air-, liquid-, and hybrid-cooled environments, addressing the rapidly increasing connectivity requirements of AI clusters.
  • June 2026 : HPE expanded its self-driving network strategy across data centers and AI factories by integrating its Juniper networking portfolio with AI data center solutions. New agentic AIOps, networking, and zero-trust capabilities are designed to simplify operations across increasingly distributed infrastructure and to strengthen automated management of AI-driven environments.

Table of Contents

checkmarkExclusive indicates content/data unique to MarketsandMarkets and not available with any competitors.

TITLE
PAGE NO
1
INTRODUCTION


32
2
EXECUTIVE SUMMARY


37
3
PREMIUM INSIGHTS


43
4
MARKET OVERVIEW AND INDUSTRY TRENDS
AI and energy-efficient solutions drive data center evolution amidst cost and complexity challenges.


48
 
4.1
INTRODUCTION


4.2
MARKET DYNAMICS


4.2.1
DRIVERS


4.2.1.1
GROWING ADOPTION OF AI AND HIGH-DENSITY DATA CENTERS


4.2.1.2
GROWING DEMAND FOR ENERGY-EFFICIENT SOLUTIONS


4.2.1.3
INCREASING DEMAND FOR REMOTE AND DISTRIBUTED DATA CENTER MANAGEMENT


4.2.2
RESTRAINTS


4.2.2.1
HIGH IMPLEMENTATION COSTS OF DCIM SOLUTIONS


4.2.2.2
COMPLEXITY AND COST OF DEPLOYING DCIM ACROSS HETEROGENEOUS INFRASTRUCTURE


4.2.3
OPPORTUNITIES


4.2.3.1
GROWING INVESTMENTS IN DATA CENTER TECHNOLOGIES


4.2.3.2
RISING ADOPTION OF EDGE DATA CENTERS


4.2.4
CHALLENGES


4.2.4.1
CONCERNS OVER DATA PRIVACY AND SECURITY


4.2.4.2
LACK OF SKILLED PROFESSIONALS


4.2.4.3
INTEGRATION WITH LEGACY SYSTEMS


4.3
UNMET NEEDS AND WHITE SPACES


4.3.1
UNMET NEEDS IN THE SOFTWARE-DEFINED DATA CENTER MARKET


4.3.2
WHITE SPACE OPPORTUNITIES


4.3.3
INTERCONNECTED MARKETS


4.3.4
CROSS-SECTOR OPPORTUNITIES


4.4
STRATEGIC MOVES BY TIER-1/2/3 PLAYERS


4.4.1
KEY MOVES AND STRATEGIC FOCUS


4.5
PORTER’S FIVE FORCES ANALYSIS


4.5.1
THREAT OF NEW ENTRANTS


4.5.2
THREAT OF SUBSTITUTES


4.5.3
BARGAINING POWER OF BUYERS


4.5.4
BARGAINING POWER OF SUPPLIERS


4.5.5
INTENSITY OF COMPETITIVE RIVALRY


4.6
MACROECONOMIC INDICATORS


4.6.1
INTRODUCTION


4.6.2
GDP TRENDS & FORECASTS


4.6.3
TRENDS IN GLOBAL DATA CENTER SOLUTIONS INDUSTRY


4.6.4
TRENDS IN GLOBAL CLOUD COMPUTING INDUSTRY


4.7
SUPPLY CHAIN ANALYSIS


4.8
ECOSYSTEM


4.9
PRICING ANALYSIS


4.9.1
AVERAGE SELLING PRICE TREND OF KEY PLAYERS, BY SOFTWARE


4.9.2
AVERAGE SELLING PRICE TREND, BY REGION


4.10
KEY CONFERENCES AND EVENTS, 2026–2027


4.11
TRENDS/DISRUPTIONS IMPACTING CUSTOMER BUSINESS


4.12
INVESTMENT AND FUNDING SCENARIO


4.13
CASE STUDY ANALYSIS


4.13.1
CORMANT TRANSFORMED COLOCATION DATA CENTER OPERATIONS FOR EFFICIENCY AND TRANSPARENCY


4.13.2
RARITAN ENHANCED POWER AND COOLING MANAGEMENT AT F5 NETWORKS PRODUCT DEVELOPMENT LAB


4.13.3
RIT TECH’S XPEDITE TRANSFORMED BEIJING SUBWAY’S FIBER NETWORK MANAGEMENT


4.13.4
MORO HUB ADOPTED NETECO600 FOR UNIFIED MANAGEMENT OF DISTRIBUTED DATA CENTERS


4.13.5
ALL IT ROOMS ENSURED 100% SYSTEM STABILITY WITH PAESSLER PRTG NETWORK MONITOR


4.13.6
LEADING EDGE DATA CENTRES REVOLUTIONIZED CONNECTIVITY IN AUSTRALIAN REGION WITH SCHNEIDER ELECTRIC


4.13.7
COMPUTACENTER EFFECTIVELY MANAGED DATA CENTER WITH NLYTE


4.13.8
SUNBIRD DCIM DRIVES EFFICIENCY AND SUSTAINABILITY FOR VODAFONE


4.13.9
VERTIV TRANSFORMING BANKING INFRASTRUCTURE FOR CONTINUOUS AVAILABILITY


4.13.10
ENHANCING DATAVITA’S COLOCATION SERVICES WITH FNT’S DCIM SOLUTIONS


4.14
IMPACT OF 2025 US TARIFF – DATA CENTER INFRASTRUCTURE MANAGEMENT MARKET


4.14.1
INTRODUCTION


4.14.2
KEY TARIFF RATES


4.14.3
PRICE IMPACT ANALYSIS


4.14.4
IMPACT ON COUNTRIES/REGIONS


4.14.4.1
US


4.14.4.2
EUROPE


4.14.4.3
ASIA PACIFIC


4.14.5
IMPACT ON VERTICALS


4.14.5.1
BFSI


4.14.5.2
CLOUD SERVICES PROVIDERS & HYPERSCALERS


4.14.5.3
MANUFACTURING


4.14.5.4
GOVERNMENT & PUBLIC SECTOR


4.15
TECHNOLOGY ANALYSIS


4.15.1
KEY TECHNOLOGIES


4.15.1.1
AI AND ML


4.15.1.2
INTERNET OF THINGS (IOT)


4.15.1.3
BIG DATA AND ANALYTICS


4.15.1.4
CLOUD COMPUTING


4.15.2
COMPLEMENTARY TECHNOLOGIES


4.15.2.1
BUILDING MANAGEMENT SYSTEMS


4.15.2.2
SECURITY INFORMATION AND EVENT MANAGEMENT (SIEM) SYSTEMS


4.15.2.3
NETWORK MANAGEMENT SYSTEMS


4.15.2.4
UNINTERRUPTIBLE POWER SUPPLY (UPS) MONITORING SYSTEMS


4.15.3
ADJACENT TECHNOLOGIES


4.15.3.1
EDGE COMPUTING


4.15.3.2
ROBOTIC PROCESS AUTOMATION


4.15.3.3
HYPER-CONVERGED INFRASTRUCTURE


4.15.3.4
CONTAINER ORCHESTRATION PLATFORM


4.16
TECHNOLOGY/PRODUCT ROADMAP


4.16.1
SHORT-TERM (2026–2028) | MONITORING, INTEGRATION & AUTOMATION


4.16.2
MID-TERM (2028–2031) | AI-ENABLED ANALYTICS & INFRASTRUCTURE OPTIMIZATION


4.16.3
LONG-TERM (2031–2036+) | AUTONOMOUS, AI-DRIVEN & SELF-OPTIMIZING INFRASTRUCTURE


4.17
PATENT ANALYSIS


4.18
FUTURE APPLICATIONS


4.18.1
AI-DRIVEN PREDICTIVE INFRASTRUCTURE MANAGEMENT


4.18.2
AUTONOMOUS CAPACITY PLANNING & RESOURCE OPTIMIZATION


4.18.3
INTELLIGENT ENERGY & COOLING OPTIMIZATION


4.18.4
AI-ENABLED ASSET MONITORING & ANOMALY DETECTION


4.18.5
AUTOMATED INCIDENT MANAGEMENT & INFRASTRUCTURE OPERATIONS


4.19
IMPACT OF AI/GENERATIVE AI ON THE DATA CENTER INFRASTRUCTURE MANAGEMENT MARKET


4.19.1
TOP USE CASES AND MARKET POTENTIAL


4.19.2
BEST PRACTICES IN DATA CENTER INFRASTRUCTURE MANAGEMENT MARKET


4.19.3
CASE STUDY OF AI IMPLEMENTATION IN DATA CENTER INFRASTRUCTURE MANAGEMENT MARKET


4.19.3.1
TELSTRA TRANSFORMS DATA CENTER MANAGEMENT WITH NLYTE’S AI-POWERED DCIM SOLUTION


4.19.4
INTERCONNECTED ADJACENCT ECOSYSTEM AND IMPACT ON MARKET PLAYERS


4.19.5
CLIENT READINESS TO ADOPT GENERATIVE AI IN THE DATA CENTER INFRASTRUCTURE MANAGEMENT


4.20
REGULATORY LANDSCAPE


4.20.1
REGULATORY BODIES, GOVERNMENT AGENCIES, AND OTHER ORGANIZATIONS


4.20.2
REGULATIONS, BY COUNTRY/REGION


4.21
DECISION-MAKING PROCESS


4.22
KEY STAKEHOLDERS AND BUYING CRITERIA


4.22.1
KEY STAKEHOLDERS IN BUYING PROCESS


4.22.2
BUYING CRITERIA


4.23
ADOPTION BARRIERS AND INTERNAL CHALLENGES


4.24
UNMET NEEDS IN VARIOUS END-USER INDUSTRIES


4.25
MARKET PROFITABILITY


4.25.1
REVENUE POTENTIAL


4.25.2
COST DYNAMICS


4.25.3
MARGIN OPPORTUNITIES IN KEY APPLICATIONS


4.26
BUSINESS MODEL ANALYSIS


4.26.1
PRODUCT OFFERINGS


4.26.2
REVENUE STREAMS


4.26.3
REVENUE MODEL TRENDS


4.26.4
CHANNELS


4.26.5
CUSTOMER SEGMENTS


4.27
DCIM SOURCES OF DATA GENERATION


4.27.1
IT EQUIPMENT


4.27.2
ELECTRICAL SYSTEMS


4.27.3
COOLING EQUIPMENT


4.27.4
ENVIRONMENTAL RESOURCES


5
DATA CENTER INFRASTRUCTURE MANAGEMENT MARKET, BY OFFERING
Market Size & Growth Rate Forecast Analysis to 2031 in USD Million | 16 Data Tables


105
 
5.1
INTRODUCTION


5.1.1
OFFERING: DATA CENTER INFRASTRUCTURE MANAGEMENT MARKET DRIVERS


5.2
DCIM SOFTWARE


5.2.1
MONITORING


5.2.1.1
OPTIMIZING DATA CENTER EFFICIENCY AND UPTIME WITH ADVANCED DCIM MONITORING SOLUTIONS FOR POWER, COOLING, AND INFRASTRUCTURE


5.2.2
OPERATIONS & MANAGEMENT


5.2.2.1
ENHANCING DATA CENTER EFFICIENCY WITH AI-DRIVEN DCIM SOFTWARE FOR REAL-TIME MONITORING AND PREDICTIVE MAINTENANCE


5.3
SERVICES


5.3.1
DESIGN & CONSULTING


5.3.1.1
OPTIMIZING DATA CENTER OPERATIONS THROUGH STRATEGIC DESIGN AND CONSULTING SERVICES FOR EFFICIENCY AND SCALABILITY


5.3.2
INTEGRATION & DEPLOYMENT


5.3.2.1
ENHANCING DATA CENTER EFFICIENCY THROUGH ADVANCED INTEGRATION AND DEPLOYMENT SERVICES


5.3.3
SUPPORT & MAINTENANCE


5.3.3.1
ESSENTIAL SUPPORT AND MAINTENANCE SERVICES FOR OPTIMIZING DATA CENTER INFRASTRUCTURE RELIABILITY AND PERFORMANCE


6
DATA CENTER INFRASTRUCTURE MANAGEMENT MARKET, BY FUNCTIONALITY
Market Size & Growth Rate Forecast Analysis to 2031 in USD Million | 14 Data Tables


115
 
6.1
INTRODUCTION


6.1.1
FUNCTIONALITY: DATA CENTER INFRASTRUCTURE MANAGEMENT MARKET DRIVERS


6.2
PERFORMANCE OPTIMIZATION


6.2.1
AI-DRIVEN PERFORMANCE OPTIMIZATION IN DCIM FOR ENERGY EFFICIENCY, COST REDUCTION, AND PREDICTIVE DIAGNOSTICS


6.2.2
ENERGY OPTIMIZATION


6.2.3
COST ANALYSIS


6.2.4
PREDICTIVE DIAGNOSTICS


6.3
ASSET MANAGEMENT


6.3.1
ENHANCING DATA CENTER EFFICIENCY WITH ADVANCED ASSET MANAGEMENT TO REDUCE RISKS AND OPTIMIZE OPERATIONS


6.3.2
INVENTORY MANAGEMENT


6.3.3
WORKFLOW & CHANGE MANAGEMENT


6.3.4
LOCATION TRACKING


6.3.5
POWER INFRASTRUCTURE MANAGEMENT


6.4
CONFIGURATION


6.4.1
OPTIMIZING DATA CENTER EFFICIENCY THROUGH ADVANCED CONFIGURATION TO ENABLE CAPACITY, FLOOR SPACE, AND RACK & CABINET PLANNING


6.4.2
CAPACITY PLANNING & RESOURCE UTILIZATION


6.4.3
FLOOR SPACE PLANNING


6.4.4
RACK & CABINET PLANNING


6.5
OPERATIONAL MONITORING


6.5.1
MAXIMIZING DATA CENTER EFFICIENCY THROUGH COMPREHENSIVE OPERATIONAL MONITORING


6.5.2
POWER MONITORING


6.5.3
ENVIRONMENTAL MONITORING


6.5.4
IT EQUIPMENT MONITORING


6.6
REPORTING & DASHBOARDS


6.6.1
OPTIMIZING DATA CENTER OPERATIONS WITH ADVANCED REPORTING, DASHBOARDS, AND REAL-TIME ALERTS


6.6.2
DATA VISUALIZATION & REPORTING


6.6.3
PERFORMANCE DASHBOARDS


6.6.4
ALERT & INCIDENT REPORTING


6.7
OTHER FUNCTIONALITIES


7
DATA CENTER INFRASTRUCTURE MANAGEMENT MARKET, BY DEPLOYMENT MODE
Market Size & Growth Rate Forecast Analysis to 2031 in USD Million | 6 Data Tables


132
 
7.1
INTRODUCTION


7.1.1
DEPLOYMENT MODE: DATA CENTER INFRASTRUCTURE MANAGEMENT MARKET DRIVERS


7.2
ON-PREMISES


7.2.1
ON-PREMISE DCIM PROVIDES CONTROL, SECURITY, AND CUSTOMIZATION FOR REGULATED INDUSTRIES


7.3
CLOUD


7.3.1
INCREASING NEED FOR SCALABLE, FLEXIBLE, AND COST-EFFICIENT SOLUTIONS TO MANAGE DATA CENTER INFRASTRUCTURE


8
DATA CENTER INFRASTRUCTURE MANAGEMENT MARKET, BY TIER TYPE
Market Size & Growth Rate Forecast Analysis to 2031 in USD Million | 10 Data Tables


137
 
8.1
INTRODUCTION


8.1.1
TIER TYPE: DATA CENTER INFRASTRUCTURE MANAGEMENT MARKET DRIVERS


8.2
TIER 1


8.2.1
ASSESSING TIER 1 DATA CENTERS FOR COST, RELIABILITY, AND SCALABILITY LIMITATIONS


8.3
TIER 2


8.3.1
NEED FOR ENHANCED INFRASTRUCTURE RELIABILITY AND REDUNDANCY TO DRIVE DEMAND


8.4
TIER 3


8.4.1
NEED FOR HIGH RELIABILITY AND DUAL POWER AND COOLING PATHS TO DRIVE DEMAND


8.5
TIER 4


8.5.1
REQUIREMENT FOR UNMATCHED RELIABILITY AND COMPLETE REDUNDANCY TO DRIVE DEMAND


9
DATA CENTER INFRASTRUCTURE MANAGEMENT MARKET, BY DATA CENTER SIZE
Market Size & Growth Rate Forecast Analysis to 2031 in USD Million | 8 Data Tables


144
 
9.1
INTRODUCTION


9.1.1
DATA CENTER SIZE: DATA CENTER INFRASTRUCTURE MANAGEMENT MARKET DRIVERS


9.2
SMALL DATA CENTERS


9.2.1
SMALL DATA CENTERS ADOPT ENERGY-EFFICIENT, MODULAR DESIGNS TO ENHANCE PERFORMANCE AND SCALABILITY


9.3
MID-SIZED DATA CENTERS


9.3.1
MID-SIZED DATA CENTERS ENHANCE EFFICIENCY WITH ENERGY-SAVING TECHNOLOGIES AND ADVANCED DCIM SOLUTIONS


9.4
LARGE DATA CENTERS


9.4.1
LARGE DATA CENTERS OPTIMIZE EFFICIENCY AND SUSTAINABILITY WITH ADVANCED POWER SYSTEMS AND DCIM SOFTWARE


10
DATA CENTER INFRASTRUCTURE MANAGEMENT MARKET, BY END USER
Market Size & Growth Rate Forecast Analysis to 2031 in USD Million | 8 Data Tables


150
 
10.1
INTRODUCTION


10.1.1
END USER: DATA CENTER INFRASTRUCTURE MANAGEMENT MARKET DRIVERS


10.2
ENTERPRISES


10.2.1
DCIM SOLUTIONS DRIVE ENTERPRISE EFFICIENCY WITH IMPROVED RESOURCE MANAGEMENT AND REDUCED OPERATIONAL COSTS


10.3
TELECOM SERVICE PROVIDERS


10.3.1
DCIM SOLUTIONS ENHANCE TELECOM EFFICIENCY WITH IMPROVED ENERGY USE AND REDUCED DOWNTIME


10.4
CLOUD SERVICE PROVIDERS


10.4.1
DCIM SOLUTIONS BOOST CLOUD SERVICE EFFICIENCY: FASTER LAUNCHES, COST REDUCTIONS, AND ENHANCED RELIABILITY


11
DATA CENTER INFRASTRUCTURE MARKET, BY REGION
Comprehensive coverage of 8 Regions with country-level deep-dive of 14 Countries | 128 Data Tables.


156
 
11.1
INTRODUCTION


11.2
NORTH AMERICA


11.2.1
NORTH AMERICA: DATA CENTER INFRASTRUCTURE MANAGEMENT MARKET DRIVERS


11.2.2
US


11.2.2.1
IMPLEMENTATION OF ADVANCED TECHNOLOGIES IN ESTABLISHED HUBS AND EMERGING RURAL REGIONS TO DRIVE MARKET


11.2.3
CANADA


11.2.3.1
DATA CENTER EXPANSION DRIVES GROWTH AMID REGIONAL ENERGY AND REGULATORY CHALLENGES


11.3
EUROPE


11.3.1
EUROPE: DATA CENTER INFRASTRUCTURE MANAGEMENT MARKET DRIVERS


11.3.2
UK


11.3.2.1
USD 1.31 BILLION DATA CENTER INVESTMENT DRIVES HYPERSCALE EXPANSION AMID ENERGY AND SECURITY CHALLENGES


11.3.3
GERMANY


11.3.3.1
DATA CENTER EXPANSION ACCELERATES WITH USD 10 BILLION INVESTMENT AND REGULATORY CHANGES AMID INFRASTRUCTURE CHALLENGES


11.3.4
FRANCE


11.3.4.1
MAJOR INVESTMENTS IN SUSTAINABILITY AND TECHNOLOGY TO DRIVE MARKET


11.3.5
ITALY


11.3.5.1
MARKET GROWTH FUELED BY MAJOR INVESTMENTS, REGULATORY CHALLENGES, AND TECHNOLOGICAL INNOVATIONS


11.3.6
REST OF EUROPE


11.4
ASIA PACIFIC


11.4.1
ASIA PACIFIC: DATA CENTER INFRASTRUCTURE MANAGEMENT MARKET DRIVERS


11.4.2
CHINA


11.4.2.1
MAJOR GOVERNMENT INVESTMENTS AND SUSTAINABLE INNOVATIONS TO DRIVE MARKET


11.4.3
JAPAN


11.4.3.1
MAJOR CLOUD AND AI INVESTMENTS TO DRIVE MARKET


11.4.4
INDIA


11.4.4.1
MAJOR INVESTMENTS AND INCREASING DIGITAL NEED TO BOOST MARKET


11.4.5
REST OF ASIA PACIFIC


11.5
MIDDLE EAST & AFRICA


11.5.1
MIDDLE EAST & AFRICA: DATA CENTER INFRASTRUCTURE MANAGEMENT MARKET DRIVERS


11.5.2
GULF COOPERATION COUNCIL (GCC)


11.5.2.1
SAUDI ARABIA


11.5.2.1.1
MARKET GROWTH DRIVEN BY MAJOR INVESTMENTS AND FOCUS ON ENERGY EFFICIENCY


11.5.2.2
UAE


11.5.2.2.1
STRATEGIC INVESTMENTS AND GOVERNMENT SUPPORT TO DRIVE MARKET


11.5.2.3
REST OF GCC


11.5.3
SOUTH AFRICA


11.5.3.1
MAJOR DATA CENTER INVESTMENTS IN JOHANNESBURG AND CAPE TOWN TO PROPEL MARKET GROWTH


11.5.4
REST OF MIDDLE EAST & AFRICA


11.6
LATIN AMERICA


11.6.1
LATIN AMERICA: DATA CENTER INFRASTRUCTURE MANAGEMENT MARKET DRIVERS


11.6.2
BRAZIL


11.6.2.1
MAJOR INVESTMENTS AND INFRASTRUCTURE ENHANCEMENTS TO DRIVE MARKET


11.6.3
MEXICO


11.6.3.1
MAJOR TECH INVESTMENTS AND SUSTAINABILITY FOCUS TO DRIVE MARKET


11.6.4
REST OF LATIN AMERICA


12
COMPETITIVE LANDSCAPE
Discover key players' winning strategies and market positions shaping the competitive landscape.


203
 
12.1
INTRODUCTION


12.2
KEY PLAYER STRATEGIES/RIGHT TO WIN


12.3
MARKET SHARE ANALYSIS


12.4
BRAND/PRODUCT COMPARISON


12.4.1
SCHNEIDER ELECTRIC - ECOSTRUXURE IT


12.4.2
VERTIV - ENVIRONET


12.4.3
JOHNSON CONTROLS - METASYS DCIM MODULE


12.4.4
EATON - BRIGHTLAYER DCIM


12.4.5
SIEMENS- DESIGO CC / BUILDING X


12.5
REVENUE ANALYSIS


12.6
COMPANY EVALUATION MATRIX: KEY PLAYERS, 2023


12.6.1
STARS


12.6.2
EMERGING LEADERS


12.6.3
PERVASIVE PLAYERS


12.6.4
PARTICIPANTS


12.6.5
COMPANY FOOTPRINT: KEY PLAYERS, 2025


12.6.5.1
COMPANY FOOTPRINT


12.6.5.2
OFFERING FOOTPRINT


12.6.5.3
END USER FOOTPRINT


12.6.5.4
REGIONAL FOOTPRINT


12.7
COMPANY EVALUATION MATRIX: STARTUPS/SMES, 2025


12.7.1
PROGRESSIVE COMPANIES


12.7.2
RESPONSIVE COMPANIES


12.7.3
DYNAMIC COMPANIES


12.7.4
STARTING BLOCKS


12.7.5
COMPETITIVE BENCHMARKING: STARTUP/SMES, 2025


12.7.5.1
DETAILED LIST OF KEY STARTUPS/SMES


12.7.5.2
COMPETITIVE BENCHMARKING OF STARTUPS/SMES


12.8
COMPANY VALUATION AND FINANCIAL METRICS


12.9
COMPETITIVE SCENARIO AND TRENDS


12.9.1
PRODUCT LAUNCHES/ENHANCEMENTS


12.9.2
DEALS


13
COMPANY PROFILES
In-depth Company Profiles of Leading Market Players with detailed Business Overview, Product and Service Portfolio, Recent Developments, and Unique Analyst Perspective (MnM View)


238
 
13.1
INTRODUCTION


13.2
MAJOR PLAYERS


13.2.1
SCHNEIDER ELECTRIC


13.2.1.1
BUSINESS OVERVIEW


13.2.1.2
PRODUCTS/SOLUTIONS/SERVICES OFFERED


13.2.1.3
RECENT DEVELOPMENTS


13.2.1.3.1
PRODUCT LAUNCHES/ENHANCEMENTS


13.2.1.3.2
DEALS


13.2.1.4
MNM VIEW


13.2.1.4.1
RIGHT TO WIN


13.2.1.4.2
STRATEGIC CHOICES


13.2.1.4.3
WEAKNESSES AND COMPETITIVE THREATS


13.2.2
VERTIV


13.2.3
JOHNSON CONTROLS


13.2.4
SIEMENS


13.2.5
EATON


13.2.6
HUAWEI


13.2.7
ABB


13.2.8
FNT SOFTWARE


13.2.9
NLYTE SOFTWARE


13.2.10
SUNBIRD SOFTWARE


13.3
OTHER PLAYERS


13.3.1
CORMANT


13.3.2
RF CODE


13.3.3
RACKWISE


13.3.4
PAESSLER


13.3.5
ITRACS


13.3.6
STULZ


13.3.7
DEVICE42


13.3.8
HYPERVIEW


13.3.9
RITTAL


13.3.10
PATCH MANAGER


13.3.11
MANAGEENGINE


13.3.12
GREENFIELD SOFTWARE


13.3.13
ISPSYSTEM


13.3.14
DELTA ELECTRONICS


13.3.15
ZPE SYSTEMS


13.3.16
MODIUS


13.3.17
NETZOOM


13.3.18
EKKOSENSE


13.3.19
CENTEROS


13.3.20
TEECUBE SOLUTIONS


13.3.21
UNITEDLAYER


13.3.22
RIT TECH


14
RESEARCH METHODOLOGY


308
 
14.1
RESEARCH APPROACH


14.1.1
SECONDARY DATA


14.1.2
PRIMARY DATA


14.1.2.1
BREAKUP OF PRIMARY PROFILES


14.1.2.2
KEY INDUSTRY INSIGHTS


14.2
MARKET BREAKUP AND DATA TRIANGULATION


14.3
MARKET SIZE ESTIMATION


14.4
MARKET FORECAST


14.5
RESEARCH ASSUMPTIONS


14.6
RESEARCH LIMITATIONS


15
ADJACENT AND RELATED MARKETS


320
 
15.1
INTRODUCTION


15.1.1
RELATED MARKETS


15.2
DATA CENTER SOLUTIONS MARKET


15.3
DATA CENTER TRANSFORMATION MARKET


16
APPENDIX


326
 
16.1
DISCUSSION GUIDE


16.2
KNOWLEDGESTORE: MARKETSANDMARKETS’ SUBSCRIPTION PORTAL


16.3
CUSTOMIZATION OPTIONS


16.4
RELATED REPORTS


16.5
AUTHOR DETAILS


LIST OF TABLES


TABLE 1
USD EXCHANGE RATES, 2020–2025


TABLE 2
DATA CENTER INFRASTRUCTURE MANAGEMENT MARKET: PORTER’S FIVE FORCES ANALYSIS


TABLE 3
GDP PERCENTAGE CHANGE, BY KEY COUNTRIES, 2021–2029


TABLE 4
INDICATIVE PRICING ANALYSIS, BY SOFTWARE


TABLE 5
AVERAGE SELLING PRICE TREND, BY REGION


TABLE 6
DATA CENTER INFRASTRUCTURE MANAGEMENT MARKET: LIST OF KEY CONFERENCES AND EVENTS, 2026–2027


TABLE 7
US ADJUSTED RECIPROCAL TARIFF RATES


TABLE 8
LIST OF GRANTED PATENTS IN DATA CENTER INFRASTRUCTURE MANAGEMENT MARKET 2024-2026


TABLE 9
TOP USE CASES AND MARKET POTENTIAL


TABLE 10
BEST PRACTICES: COMPANIES IMPLEMENTING AI IN DATA CENTER INFRASTRUCTURE MANAGEMENT


TABLE 11
INTERCONNECTED ADJACENT ECOSYSTEMS AND IMPLICATIONS FOR MARKET PLAYERS


TABLE 12
NORTH AMERICA: LIST OF REGULATORY BODIES, GOVERNMENT AGENCIES, AND OTHER ORGANIZATIONS


TABLE 13
EUROPE: LIST OF REGULATORY BODIES, GOVERNMENT AGENCIES, AND OTHER ORGANIZATIONS


TABLE 14
ASIA PACIFIC: LIST OF REGULATORY BODIES, GOVERNMENT AGENCIES, AND OTHER ORGANIZATIONS


TABLE 15
REST OF THE WORLD: LIST OF REGULATORY BODIES, GOVERNMENT AGENCIES, AND OTHER ORGANIZATIONS


TABLE 16
INFLUENCE OF STAKEHOLDERS ON BUYING PROCESS FOR END USERS


TABLE 17
KEY BUYING CRITERIA FOR END USERS


TABLE 18
DATA CENTER INFRASTRUCTURE MANAGEMENT MARKET: UNMET NEEDS IN KEY END-USER INDUSTRIES


TABLE 19
DATA CENTER INFRASTRUCTURE MANAGEMENT MARKET, BY OFFERING, 2021–2025 (USD MILLION)


TABLE 20
DATA CENTER INFRASTRUCTURE MANAGEMENT MARKET, BY OFFERING, 2026–2031 (USD MILLION)


TABLE 21
DATA CENTER INFRASTRUCTURE MANAGEMENT MARKET, BY DCIM SOFTWARE, 2021–2025 (USD MILLION)


TABLE 22
DATA CENTER INFRASTRUCTURE MANAGEMENT MARKET, BY DCIM SOFTWARE, 2026–2031 (USD MILLION)


TABLE 23
DCIM MONITORING SOFTWARE MARKET, BY REGION, 2021–2025 (USD MILLION)


TABLE 24
DCIM MONITORING SOFTWARE MARKET, BY REGION, 2026–2031 (USD MILLION)


TABLE 25
DCIM OPERATIONS & MANAGEMENT SOFTWARE MARKET, BY REGION, 2021–2025 (USD MILLION)


TABLE 26
DCM OPERATIONS & MANAGEMENT SOFTWARE MARKET, BY REGION, 2026–2031 (USD MILLION)


TABLE 27
DATA CENTER INFRASTRUCTURE MANAGEMENT MARKET, BY SERVICE, 2021–2025 (USD MILLION)


TABLE 28
DATA CENTER INFRASTRUCTURE MANAGEMENT MARKET, BY SERVICE, 2026–2031 (USD MILLION)


TABLE 29
DCIM DESIGN & CONSULTING SERVICES MARKET, BY REGION, 2021–2025 (USD MILLION)


TABLE 30
DCIM DESIGN & CONSULTING SERVICES MARKET, BY REGION, 2026–2031 (USD MILLION)


TABLE 31
DCIM INTEGRATION & DEPLOYMENT SERVICES MARKET, BY REGION, 2021–2025 (USD MILLION)


TABLE 32
DCIM INTEGRATION & DEPLOYMENT SERVICES MARKET, BY REGION, 2026–2031 (USD MILLION)


TABLE 33
DCIM SUPPORT & MAINTENANCE SERVICES MARKET, BY REGION, 2021–2025 (USD MILLION)


TABLE 34
DCIM SUPPORT & MAINTENANCE SERVICES MARKET, BY REGION, 2026–2031 (USD MILLION)


TABLE 35
DATA CENTER INFRASTRUCTURE MANAGEMENT MARKET, BY FUNCTIONALITY, 2021–2025 (USD MILLION)


TABLE 36
DATA CENTER INFRASTRUCTURE MANAGEMENT MARKET, BY FUNCTIONALITY, 2026–2031 (USD MILLION)


TABLE 37
DATA CENTER INFRASTRUCTURE MANAGEMENT MARKET FOR PERFORMANCE OPTIMIZATION, BY REGION, 2021–2025 (USD MILLION)


TABLE 38
DATA CENTER INFRASTRUCTURE MANAGEMENT MARKET FOR PERFORMANCE OPTIMIZATION, BY REGION, 2026–2031 (USD MILLION)


TABLE 39
DATA CENTER INFRASTRUCTURE MANAGEMENT MARKET FOR ASSET MANAGEMENT, BY REGION, 2021–2025 (USD MILLION)


TABLE 40
DATA CENTER INFRASTRUCTURE MANAGEMENT MARKET FOR ASSET MANAGEMENT, BY REGION, 2026–2031 (USD MILLION)


TABLE 41
DATA CENTER INFRASTRUCTURE MANAGEMENT MARKET FOR CONFIGURATION, BY REGION, 2021–2025 (USD MILLION)


TABLE 42
DATA CENTER INFRASTRUCTURE MANAGEMENT MARKET FOR CONFIGURATION, BY REGION, 2026–2031 (USD MILLION)


TABLE 43
DATA CENTER INFRASTRUCTURE MANAGEMENT MARKET FOR OPERATIONAL MONITORING, BY REGION, 2021–2025 (USD MILLION)


TABLE 44
DATA CENTER INFRASTRUCTURE MANAGEMENT MARKET FOR OPERATIONAL MONITORING, BY REGION, 2026–2031 (USD MILLION)


TABLE 45
DATA CENTER INFRASTRUCTURE MANAGEMENT MARKET FOR REPORTING & DASHBOARDS, BY REGION, 2021–2025 (USD MILLION)


TABLE 46
DATA CENTER INFRASTRUCTURE MANAGEMENT MARKET FOR REPORTING & DASHBOARDS, BY REGION, 2026–2031 (USD MILLION)


TABLE 47
DATA CENTER INFRASTRUCTURE MANAGEMENT MARKET FOR OTHER FUNCTIONALITIES, BY REGION, 2021–2025 (USD MILLION)


TABLE 48
DATA CENTER INFRASTRUCTURE MANAGEMENT MARKET FOR OTHER FUNCTIONALITIES, BY REGION, 2026–2031 (USD MILLION)


TABLE 49
DATA CENTER INFRASTRUCTURE MANAGEMENT MARKET, BY DEPLOYMENT MODE, 2021–2025 (USD MILLION)


TABLE 50
DATA CENTER INFRASTRUCTURE MANAGEMENT MARKET, BY DEPLOYMENT MODE, 2026–2031 (USD MILLION)


TABLE 51
ON-PREMISE DATA CENTER INFRASTRUCTURE MANAGEMENT MARKET, BY REGION, 2021–2025 (USD MILLION)


TABLE 52
ON-PREMISE DATA CENTER INFRASTRUCTURE MANAGEMENT MARKET, BY REGION, 2026–2031 (USD MILLION)


TABLE 53
CLOUD-BASED DATA CENTER INFRASTRUCTURE MANAGEMENT MARKET, BY REGION, 2021–2025 (USD MILLION)


TABLE 54
CLOUD-BASED DATA CENTER INFRASTRUCTURE MANAGEMENT MARKET, BY REGION, 2026–2031 (USD MILLION)


TABLE 55
DATA CENTER INFRASTRUCTURE MANAGEMENT MARKET, BY TIER TYPE, 2021–2025 (USD MILLION)


TABLE 56
DATA CENTER INFRASTRUCTURE MANAGEMENT MARKET, BY TIER TYPE, 2026–2031 (USD MILLION)


TABLE 57
TIER 1: DATA CENTER INFRASTRUCTURE MANAGEMENT MARKET, BY REGION, 2021–2025 (USD MILLION)


TABLE 58
TIER 1: DATA CENTER INFRASTRUCTURE MANAGEMENT MARKET, BY REGION, 2026–2031 (USD MILLION)


TABLE 59
TIER 2: DATA CENTER INFRASTRUCTURE MANAGEMENT MARKET, BY REGION, 2021–2025 (USD MILLION)


TABLE 60
TIER 2: DATA CENTER INFRASTRUCTURE MANAGEMENT MARKET, BY REGION, 2026–2031 (USD MILLION)


TABLE 61
TIER 3: DATA CENTER INFRASTRUCTURE MANAGEMENT MARKET, BY REGION, 2021–2025 (USD MILLION)


TABLE 62
TIER 3: DATA CENTER INFRASTRUCTURE MANAGEMENT MARKET, BY REGION, 2026–2031 (USD MILLION)


TABLE 63
TIER 4: DATA CENTER INFRASTRUCTURE MANAGEMENT MARKET, BY REGION, 2021–2025 (USD MILLION)


TABLE 64
TIER 4: DATA CENTER INFRASTRUCTURE MANAGEMENT MARKET, BY REGION, 2026–2031 (USD MILLION)


TABLE 65
DATA CENTER INFRASTRUCTURE MANAGEMENT MARKET, BY DATA CENTER SIZE, 2021–2025 (USD MILLION)


TABLE 66
DATA CENTER INFRASTRUCTURE MANAGEMENT MARKET, BY DATA CENTER SIZE, 2026–2031 (USD MILLION)


TABLE 67
SMALL DATA CENTER INFRASTRUCTURE MANAGEMENT MARKET, BY REGION, 2021–2025 (USD MILLION)


TABLE 68
SMALL DATA CENTER INFRASTRUCTURE MANAGEMENT MARKET, BY REGION, 2026–2031 (USD MILLION)


TABLE 69
MID-SIZED DATA CENTER INFRASTRUCTURE MANAGEMENT MARKET, BY REGION, 2021–2025 (USD MILLION)


TABLE 70
MID-SIZED DATA CENTER INFRASTRUCTURE MANAGEMENT MARKET, BY REGION, 2026–2031 (USD MILLION)


TABLE 71
LARGE DATA CENTER INFRASTRUCTURE MANAGEMENT MARKET, BY REGION, 2021–2025 (USD MILLION)


TABLE 72
LARGE DATA CENTER INFRASTRUCTURE MANAGEMENT MARKET, BY REGION, 2026–2031 (USD MILLION)


TABLE 73
DATA CENTER INFRASTRUCTURE MANAGEMENT MARKET, BY END USER, 2021–2025 (USD MILLION)


TABLE 74
DATA CENTER INFRASTRUCTURE MANAGEMENT MARKET, BY END USER, 2026–2031 (USD MILLION)


TABLE 75
DATA CENTER INFRASTRUCTURE MANAGEMENT MARKET FOR ENTERPRISES, BY REGION, 2021–2025 (USD MILLION)


TABLE 76
DATA CENTER INFRASTRUCTURE MANAGEMENT MARKET FOR ENTERPRISES, BY REGION, 2026–2031 (USD MILLION)


TABLE 77
DATA CENTER INFRASTRUCTURE MANAGEMENT MARKET FOR TELECOM SERVICE PROVIDERS, BY REGION, 2021–2025 (USD MILLION)


TABLE 78
DATA CENTER INFRASTRUCTURE MANAGEMENT MARKET FOR TELECOM SERVICE PROVIDERS, BY REGION, 2026–2031 (USD MILLION)


TABLE 79
DATA CENTER INFRASTRUCTURE MANAGEMENT MARKET FOR CLOUD SERVICE PROVIDERS, BY REGION, 2021–2025 (USD MILLION)


TABLE 80
DATA CENTER INFRASTRUCTURE MANAGEMENT MARKET FOR CLOUD SERVICE PROVIDERS, BY REGION, 2026–2031 (USD MILLION)


TABLE 81
DATA CENTER INFRASTRUCTURE MARKET, BY REGION, 2021–2025 (USD MILLION)


TABLE 82
DATA CENTER INFRASTRUCTURE MARKET, BY REGION, 2026–2031 (USD MILLION)


TABLE 83
NORTH AMERICA: DATA CENTER INFRASTRUCTURE MANAGEMENT MARKET, BY OFFERING, 2021–2025 (USD MILLION)


TABLE 84
NORTH AMERICA: DATA CENTER INFRASTRUCTURE MANAGEMENT MARKET, BY OFFERING, 2026–2031 (USD MILLION)


TABLE 85
NORTH AMERICA: DATA CENTER INFRASTRUCTURE MANAGEMENT MARKET, BY DCIM SOFTWARE, 2021–2025 (USD MILLION)


TABLE 86
NORTH AMERICA: DATA CENTER INFRASTRUCTURE MANAGEMENT MARKET, BY DCIM SOFTWARE, 2026–2031 (USD MILLION)


TABLE 87
NORTH AMERICA: DATA CENTER INFRASTRUCTURE MANAGEMENT MARKET, BY SERVICE, 2021–2025 (USD MILLION)


TABLE 88
NORTH AMERICA: DATA CENTER INFRASTRUCTURE MANAGEMENT MARKET, BY SERVICE, 2026–2031 (USD MILLION)


TABLE 89
NORTH AMERICA: DATA CENTER INFRASTRUCTURE MANAGEMENT MARKET, BY FUNCTIONALITY, 2021–2025 (USD MILLION)


TABLE 90
NORTH AMERICA: DATA CENTER INFRASTRUCTURE MANAGEMENT MARKET, BY FUNCTIONALITY, 2026–2031 (USD MILLION)


TABLE 91
NORTH AMERICA: DATA CENTER INFRASTRUCTURE MANAGEMENT MARKET, BY DEPLOYMENT MODE, 2021–2025 (USD MILLION)


TABLE 92
NORTH AMERICA: DATA CENTER INFRASTRUCTURE MANAGEMENT MARKET, BY DEPLOYMENT MODE, 2026–2031 (USD MILLION)


TABLE 93
NORTH AMERICA: DATA CENTER INFRASTRUCTURE MANAGEMENT MARKET, BY TIER TYPE, 2021–2025 (USD MILLION)


TABLE 94
NORTH AMERICA: DATA CENTER INFRASTRUCTURE MANAGEMENT MARKET, BY TIER TYPE, 2026–2031 (USD MILLION)


TABLE 95
NORTH AMERICA: DATA CENTER INFRASTRUCTURE MANAGEMENT MARKET, BY DATA CENTER SIZE, 2021–2025 (USD MILLION)


TABLE 96
NORTH AMERICA: DATA CENTER INFRASTRUCTURE MANAGEMENT MARKET, BY DATA CENTER SIZE, 2026–2031 (USD MILLION)


TABLE 97
NORTH AMERICA: DATA CENTER INFRASTRUCTURE MANAGEMENT MARKET, BY END USER, 2021–2025 (USD MILLION)


TABLE 98
NORTH AMERICA: DATA CENTER INFRASTRUCTURE MANAGEMENT MARKET, BY END USER, 2026–2031 (USD MILLION)


TABLE 99
NORTH AMERICA: DATA CENTER INFRASTRUCTURE MANAGEMENT MARKET, BY COUNTRY, 2021–2025 (USD MILLION)


TABLE 100
NORTH AMERICA: DATA CENTER INFRASTRUCTURE MANAGEMENT MARKET, BY COUNTRY, 2026–2031 (USD MILLION)


TABLE 101
US: DATA CENTER INFRASTRUCTURE MANAGEMENT MARKET, BY OFFERING, 2021–2025 (USD MILLION)


TABLE 102
US: DATA CENTER INFRASTRUCTURE MANAGEMENT MARKET, BY OFFERING, 2026–2031 (USD MILLION)


TABLE 103
CANADA: DATA CENTER INFRASTRUCTURE MANAGEMENT MARKET, BY OFFERING, 2021–2025 (USD MILLION)


TABLE 104
CANADA: DATA CENTER INFRASTRUCTURE MANAGEMENT MARKET, BY OFFERING, 2026–2031 (USD MILLION)


TABLE 105
EUROPE: DATA CENTER INFRASTRUCTURE MANAGEMENT MARKET, BY OFFERING, 2021–2025 (USD MILLION)


TABLE 106
EUROPE: DATA CENTER INFRASTRUCTURE MANAGEMENT MARKET, BY OFFERING, 2026–2031 (USD MILLION)


TABLE 107
EUROPE: DATA CENTER INFRASTRUCTURE MANAGEMENT MARKET, BY DCIM SOFTWARE, 2021–2025 (USD MILLION)


TABLE 108
EUROPE: DATA CENTER INFRASTRUCTURE MANAGEMENT MARKET, BY DCIM SOFTWARE, 2026–2031 (USD MILLION)


TABLE 109
EUROPE: DATA CENTER INFRASTRUCTURE MANAGEMENT MARKET, BY SERVICE, 2021–2025 (USD MILLION)


TABLE 110
EUROPE: DATA CENTER INFRASTRUCTURE MANAGEMENT MARKET, BY SERVICE, 2026–2031 (USD MILLION)


TABLE 111
EUROPE: DATA CENTER INFRASTRUCTURE MANAGEMENT MARKET, BY FUNCTIONALITY, 2021–2025 (USD MILLION)


TABLE 112
EUROPE: DATA CENTER INFRASTRUCTURE MANAGEMENT MARKET, BY FUNCTIONALITY, 2026–2031 (USD MILLION)


TABLE 113
EUROPE: DATA CENTER INFRASTRUCTURE MANAGEMENT MARKET, BY DEPLOYMENT MODE, 2021–2025 (USD MILLION)


TABLE 114
EUROPE: DATA CENTER INFRASTRUCTURE MANAGEMENT MARKET, BY DEPLOYMENT MODE, 2026–2031 (USD MILLION)


TABLE 115
EUROPE: DATA CENTER INFRASTRUCTURE MANAGEMENT MARKET, BY TIER TYPE, 2021–2025 (USD MILLION)


TABLE 116
EUROPE: DATA CENTER INFRASTRUCTURE MANAGEMENT MARKET, BY TIER TYPE, 2026–2031 (USD MILLION)


TABLE 117
EUROPE: DATA CENTER INFRASTRUCTURE MANAGEMENT MARKET, BY DATA CENTER SIZE, 2021–2025 (USD MILLION)


TABLE 118
EUROPE: DATA CENTER INFRASTRUCTURE MANAGEMENT MARKET, BY DATA CENTER SIZE, 2026–2031 (USD MILLION)


TABLE 119
EUROPE: DATA CENTER INFRASTRUCTURE MANAGEMENT MARKET, BY END USER, 2021–2025 (USD MILLION)


TABLE 120
EUROPE: DATA CENTER INFRASTRUCTURE MANAGEMENT MARKET, BY END USER, 2026–2031 (USD MILLION)


TABLE 121
EUROPE: DATA CENTER INFRASTRUCTURE MANAGEMENT MARKET, BY COUNTRY, 2021–2025 (USD MILLION)


TABLE 122
EUROPE: DATA CENTER INFRASTRUCTURE MANAGEMENT MARKET, BY COUNTRY, 2026–2031 (USD MILLION)


TABLE 123
UK: DATA CENTER INFRASTRUCTURE MANAGEMENT MARKET, BY OFFERING, 2021–2025 (USD MILLION)


TABLE 124
UK: DATA CENTER INFRASTRUCTURE MANAGEMENT MARKET, BY OFFERING, 2026–2031 (USD MILLION)


TABLE 125
GERMANY: DATA CENTER INFRASTRUCTURE MANAGEMENT MARKET, BY OFFERING, 2021–2025 (USD MILLION)


TABLE 126
GERMANY: DATA CENTER INFRASTRUCTURE MANAGEMENT MARKET, BY OFFERING, 2026–2031 (USD MILLION)


TABLE 127
FRANCE: DATA CENTER INFRASTRUCTURE MANAGEMENT MARKET, BY OFFERING, 2021–2025 (USD MILLION)


TABLE 128
FRANCE: DATA CENTER INFRASTRUCTURE MANAGEMENT MARKET, BY OFFERING, 2026–2031 (USD MILLION)


TABLE 129
ITALY: DATA CENTER INFRASTRUCTURE MANAGEMENT MARKET, BY OFFERING, 2021–2025 (USD MILLION)


TABLE 130
ITALY: DATA CENTER INFRASTRUCTURE MANAGEMENT MARKET, BY OFFERING, 2026–2031 (USD MILLION)


TABLE 131
REST OF EUROPE: DATA CENTER INFRASTRUCTURE MANAGEMENT MARKET, BY OFFERING, 2021–2025 (USD MILLION)


TABLE 132
REST OF EUROPE: DATA CENTER INFRASTRUCTURE MANAGEMENT MARKET, BY OFFERING, 2026–2031 (USD MILLION)


TABLE 133
ASIA PACIFIC: DATA CENTER INFRASTRUCTURE MANAGEMENT MARKET, BY OFFERING, 2021–2025 (USD MILLION)


TABLE 134
ASIA PACIFIC: DATA CENTER INFRASTRUCTURE MANAGEMENT MARKET, BY OFFERING, 2026–2031 (USD MILLION)


TABLE 135
ASIA PACIFIC: DATA CENTER INFRASTRUCTURE MANAGEMENT MARKET, BY DCIM SOFTWARE, 2021–2025 (USD MILLION)


TABLE 136
ASIA PACIFIC: DATA CENTER INFRASTRUCTURE MANAGEMENT MARKET, BY DCIM SOFTWARE, 2026–2031 (USD MILLION)


TABLE 137
ASIA PACIFIC: DATA CENTER INFRASTRUCTURE MANAGEMENT MARKET, BY SERVICE, 2021–2025 (USD MILLION)


TABLE 138
ASIA PACIFIC: DATA CENTER INFRASTRUCTURE MANAGEMENT MARKET, BY SERVICE, 2026–2031 (USD MILLION)


TABLE 139
ASIA PACIFIC: DATA CENTER INFRASTRUCTURE MANAGEMENT MARKET, BY FUNCTIONALITY, 2021–2025 (USD MILLION)


TABLE 140
ASIA PACIFIC: DATA CENTER INFRASTRUCTURE MANAGEMENT MARKET, BY FUNCTIONALITY, 2026–2031 (USD MILLION)


TABLE 141
ASIA PACIFIC: DATA CENTER INFRASTRUCTURE MANAGEMENT MARKET, BY DEPLOYMENT MODE, 2021–2025 (USD MILLION)


TABLE 142
ASIA PACIFIC: DATA CENTER INFRASTRUCTURE MANAGEMENT MARKET, BY DEPLOYMENT MODE, 2026–2031 (USD MILLION)


TABLE 143
ASIA PACIFIC: DATA CENTER INFRASTRUCTURE MANAGEMENT MARKET, BY TIER TYPE, 2021–2025 (USD MILLION)


TABLE 144
ASIA PACIFIC: DATA CENTER INFRASTRUCTURE MANAGEMENT MARKET, BY TIER TYPE, 2026–2031 (USD MILLION)


TABLE 145
ASIA PACIFIC: DATA CENTER INFRASTRUCTURE MANAGEMENT MARKET, BY DATA CENTER SIZE, 2021–2025 (USD MILLION)


TABLE 146
ASIA PACIFIC: DATA CENTER INFRASTRUCTURE MANAGEMENT MARKET, BY DATA CENTER SIZE, 2026–2031 (USD MILLION)


TABLE 147
ASIA PACIFIC: DATA CENTER INFRASTRUCTURE MANAGEMENT MARKET, BY END USER, 2021–2025 (USD MILLION)


TABLE 148
ASIA PACIFIC: DATA CENTER INFRASTRUCTURE MANAGEMENT MARKET, BY END USER, 2026–2031 (USD MILLION)


TABLE 149
ASIA PACIFIC: DATA CENTER INFRASTRUCTURE MANAGEMENT MARKET, BY COUNTRY, 2021–2025 (USD MILLION)


TABLE 150
ASIA PACIFIC: DATA CENTER INFRASTRUCTURE MANAGEMENT MARKET, BY COUNTRY, 2026–2031 (USD MILLION)


TABLE 151
CHINA: DATA CENTER INFRASTRUCTURE MANAGEMENT MARKET, BY OFFERING, 2021–2025 (USD MILLION)


TABLE 152
CHINA: DATA CENTER INFRASTRUCTURE MANAGEMENT MARKET, BY OFFERING, 2026–2031 (USD MILLION)


TABLE 153
JAPAN: DATA CENTER INFRASTRUCTURE MANAGEMENT MARKET, BY OFFERING, 2021–2025 (USD MILLION)


TABLE 154
JAPAN: DATA CENTER INFRASTRUCTURE MANAGEMENT MARKET, BY OFFERING, 2026–2031 (USD MILLION)


TABLE 155
INDIA: DATA CENTER INFRASTRUCTURE MANAGEMENT MARKET, BY OFFERING, 2021–2025 (USD MILLION)


TABLE 156
INDIA: DATA CENTER INFRASTRUCTURE MANAGEMENT MARKET, BY OFFERING, 2026–2031 (USD MILLION)


TABLE 157
REST OF ASIA PACIFIC: DATA CENTER INFRASTRUCTURE MANAGEMENT MARKET, BY OFFERING, 2021–2025 (USD MILLION)


TABLE 158
REST OF ASIA PACIFIC: DATA CENTER INFRASTRUCTURE MANAGEMENT MARKET, BY OFFERING, 2026–2031 (USD MILLION)


TABLE 159
MIDDLE EAST & AFRICA: DATA CENTER INFRASTRUCTURE MANAGEMENT MARKET, BY OFFERING, 2021–2025 (USD MILLION)


TABLE 160
MIDDLE EAST & AFRICA: DATA CENTER INFRASTRUCTURE MANAGEMENT MARKET, BY OFFERING, 2026–2031 (USD MILLION)


TABLE 161
MIDDLE EAST & AFRICA: DATA CENTER INFRASTRUCTURE MANAGEMENT MARKET, BY DCIM SOFTWARE, 2021–2025 (USD MILLION)


TABLE 162
MIDDLE EAST & AFRICA: DATA CENTER INFRASTRUCTURE MANAGEMENT MARKET, BY DCIM SOFTWARE, 2026–2031 (USD MILLION)


TABLE 163
MIDDLE EAST & AFRICA: DATA CENTER INFRASTRUCTURE MANAGEMENT MARKET, BY SERVICE, 2021–2025 (USD MILLION)


TABLE 164
MIDDLE EAST & AFRICA: DATA CENTER INFRASTRUCTURE MANAGEMENT MARKET, BY SERVICE, 2026–2031 (USD MILLION)


TABLE 165
MIDDLE EAST & AFRICA: DATA CENTER INFRASTRUCTURE MANAGEMENT MARKET, BY FUNCTIONALITY, 2021–2025 (USD MILLION)


TABLE 166
MIDDLE EAST & AFRICA: DATA CENTER INFRASTRUCTURE MANAGEMENT MARKET, BY FUNCTIONALITY, 2026–2031 (USD MILLION)


TABLE 167
MIDDLE EAST & AFRICA: DATA CENTER INFRASTRUCTURE MANAGEMENT MARKET, BY DEPLOYMENT MODE, 2021–2025 (USD MILLION)


TABLE 168
MIDDLE EAST & AFRICA: DATA CENTER INFRASTRUCTURE MANAGEMENT MARKET, BY DEPLOYMENT MODE, 2026–2031 (USD MILLION)


TABLE 169
MIDDLE EAST & AFRICA: DATA CENTER INFRASTRUCTURE MANAGEMENT MARKET, BY TIER TYPE, 2021–2025 (USD MILLION)


TABLE 170
MIDDLE EAST & AFRICA: DATA CENTER INFRASTRUCTURE MANAGEMENT MARKET, BY TIER TYPE, 2026–2031 (USD MILLION)


TABLE 171
MIDDLE EAST & AFRICA: DATA CENTER INFRASTRUCTURE MANAGEMENT MARKET, BY DATA CENTER SIZE, 2021–2025 (USD MILLION)


TABLE 172
MIDDLE EAST & AFRICA: DATA CENTER INFRASTRUCTURE MANAGEMENT MARKET, BY DATA CENTER SIZE, 2026–2031 (USD MILLION)


TABLE 173
MIDDLE EAST & AFRICA: DATA CENTER INFRASTRUCTURE MANAGEMENT MARKET, BY END USER, 2021–2025 (USD MILLION)


TABLE 174
MIDDLE EAST & AFRICA: DATA CENTER INFRASTRUCTURE MANAGEMENT MARKET, BY END USER, 2026–2031 (USD MILLION)


TABLE 175
MIDDLE EAST & AFRICA: DATA CENTER INFRASTRUCTURE MANAGEMENT MARKET, BY COUNTRY, 2021–2025 (USD MILLION)


TABLE 176
MIDDLE EAST & AFRICA: DATA CENTER INFRASTRUCTURE MANAGEMENT MARKET, BY COUNTRY, 2026–2031 (USD MILLION)


TABLE 177
GCC: DATA CENTER INFRASTRUCTURE MANAGEMENT MARKET, BY OFFERING, 2021–2025 (USD MILLION)


TABLE 178
GCC: DATA CENTER INFRASTRUCTURE MANAGEMENT MARKET, BY OFFERING, 2026–2031 (USD MILLION)


TABLE 179
GCC: DATA CENTER INFRASTRUCTURE MANAGEMENT MARKET, BY COUNTRY, 2021–2025 (USD MILLION)


TABLE 180
GCC: DATA CENTER INFRASTRUCTURE MANAGEMENT MARKET, BY COUNTRY, 2026–2031 (USD MILLION)


TABLE 181
SOUTH AFRICA: DATA CENTER INFRASTRUCTURE MANAGEMENT MARKET, BY OFFERING, 2021–2025 (USD MILLION)


TABLE 182
SOUTH AFRICA: DATA CENTER INFRASTRUCTURE MANAGEMENT MARKET, BY OFFERING, 2026–2031 (USD MILLION)


TABLE 183
REST OF MIDDLE EAST & AFRICA: DATA CENTER INFRASTRUCTURE MANAGEMENT MARKET, BY OFFERING, 2021–2025 (USD MILLION)


TABLE 184
REST OF MIDDLE EAST & AFRICA: DATA CENTER INFRASTRUCTURE MANAGEMENT MARKET, BY OFFERING, 2026–2031 (USD MILLION)


TABLE 185
LATIN AMERICA: DATA CENTER INFRASTRUCTURE MANAGEMENT MARKET, BY OFFERING, 2021–2025 (USD MILLION)


TABLE 186
LATIN AMERICA: DATA CENTER INFRASTRUCTURE MANAGEMENT MARKET, BY OFFERING, 2026–2031 (USD MILLION)


TABLE 187
LATIN AMERICA: DATA CENTER INFRASTRUCTURE MANAGEMENT MARKET, BY DCIM SOFTWARE, 2021–2025 (USD MILLION)


TABLE 188
LATIN AMERICA: DATA CENTER INFRASTRUCTURE MANAGEMENT MARKET, BY DCIM SOFTWARE, 2026–2031 (USD MILLION)


TABLE 189
LATIN AMERICA: DATA CENTER INFRASTRUCTURE MANAGEMENT MARKET, BY SERVICE, 2021–2025 (USD MILLION)


TABLE 190
LATIN AMERICA: DATA CENTER INFRASTRUCTURE MANAGEMENT MARKET, BY SERVICE, 2026–2031 (USD MILLION)


TABLE 191
LATIN AMERICA: DATA CENTER INFRASTRUCTURE MANAGEMENT MARKET, BY FUNCTIONALITY, 2021–2025 (USD MILLION)


TABLE 192
LATIN AMERICA: DATA CENTER INFRASTRUCTURE MANAGEMENT MARKET, BY FUNCTIONALITY, 2026–2031 (USD MILLION)


TABLE 193
LATIN AMERICA: DATA CENTER INFRASTRUCTURE MANAGEMENT MARKET, BY DEPLOYMENT MODE, 2021–2025 (USD MILLION)


TABLE 194
LATIN AMERICA: DATA CENTER INFRASTRUCTURE MANAGEMENT MARKET, BY DEPLOYMENT MODE, 2026–2031 (USD MILLION)


TABLE 195
LATIN AMERICA: DATA CENTER INFRASTRUCTURE MANAGEMENT MARKET, BY TIER TYPE, 2021–2025 (USD MILLION)


TABLE 196
LATIN AMERICA: DATA CENTER INFRASTRUCTURE MANAGEMENT MARKET, BY TIER TYPE, 2026–2031 (USD MILLION)


TABLE 197
LATIN AMERICA: DATA CENTER INFRASTRUCTURE MANAGEMENT MARKET, BY DATA CENTER SIZE, 2021–2025 (USD MILLION)


TABLE 198
LATIN AMERICA: DATA CENTER INFRASTRUCTURE MANAGEMENT MARKET, BY DATA CENTER SIZE, 2026–2031 (USD MILLION)


TABLE 199
LATIN AMERICA: DATA CENTER INFRASTRUCTURE MANAGEMENT MARKET, BY END USER, 2021–2025 (USD MILLION)


TABLE 200
LATIN AMERICA: DATA CENTER INFRASTRUCTURE MANAGEMENT MARKET, BY END USER, 2026–2031 (USD MILLION)


TABLE 201
LATIN AMERICA: DATA CENTER INFRASTRUCTURE MANAGEMENT MARKET, BY COUNTRY, 2021–2025 (USD MILLION)


TABLE 202
LATIN AMERICA: DATA CENTER INFRASTRUCTURE MANAGEMENT MARKET, BY COUNTRY, 2026–2031 (USD MILLION)


TABLE 203
BRAZIL: DATA CENTER INFRASTRUCTURE MANAGEMENT MARKET, BY OFFERING, 2021–2025 (USD MILLION)


TABLE 204
BRAZIL: DATA CENTER INFRASTRUCTURE MANAGEMENT MARKET, BY OFFERING, 2026–2031 (USD MILLION)


TABLE 205
MEXICO: DATA CENTER INFRASTRUCTURE MANAGEMENT MARKET, BY OFFERING, 2021–2025 (USD MILLION)


TABLE 206
MEXICO: DATA CENTER INFRASTRUCTURE MANAGEMENT MARKET, BY OFFERING, 2026–2031 (USD MILLION)


TABLE 207
REST OF LATIN AMERICA: DATA CENTER INFRASTRUCTURE MANAGEMENT MARKET, BY OFFERING, 2021–2025 (USD MILLION)


TABLE 208
REST OF LATIN AMERICA: DATA CENTER INFRASTRUCTURE MANAGEMENT MARKET, BY OFFERING, 2026–2031 (USD MILLION)


TABLE 209
OVERVIEW OF STRATEGIES ADOPTED BY KEY VENDORS


TABLE 210
MARKET SHARE ANALYSIS OF KEY VENDORS, 2025


TABLE 211
DATA CENTER INFRASTRUCTURE MANAGEMENT MARKET: OFFERING FOOTPRINT


TABLE 212
DATA CENTER INFRASTRUCTURE MANAGEMENT MARKET: END USER FOOTPRINT


TABLE 213
DATA CENTER INFRASTRUCTURE MANAGEMENT MARKET: REGIONAL FOOTPRINT


TABLE 214
DETAILED LIST OF KEY STARTUPS/SMES


TABLE 215
COMPETITIVE BENCHMARKING OF KEY STARTUPS/SMES


TABLE 216
DATA CENTER INFRASTRUCTURE MANAGEMENT MARKET: PRODUCT LAUNCHES/ENHANCEMENTS, NOVEMBER 2022- SEPTEMBER 2026


TABLE 217
DATA CENTER INFRASTRUCTURE MANAGEMENT MARKET: DEALS, JANUARY 2022–JUNE 2026


TABLE 218
SCHNEIDER ELECTRIC: COMPANY OVERVIEW


TABLE 219
SCHNEIDER ELECTRIC: PRODUCTS/SOLUTIONS/SERVICES OFFERED


TABLE 220
SCHNEIDER ELECTRIC: PRODUCT LAUNCHES/ENHANCEMENTS


TABLE 221
SCHNEIDER ELECTRIC: DEALS


TABLE 222
VERTIV: COMPANY OVERVIEW


TABLE 223
VERTIV: PRODUCTS/SOLUTIONS/SERVICES OFFERED


TABLE 224
VERTIV: PRODUCT LAUNCHES/ENHANCEMENTS


TABLE 225
VERTIV: DEALS


TABLE 226
JOHNSON CONTROLS: COMPANY OVERVIEW


TABLE 227
JOHNSON CONTROLS: PRODUCTS/SOLUTIONS/SERVICES OFFERED


TABLE 228
JOHNSON CONTROLS: PRODUCT LAUNCHES/ENHANCEMENTS


TABLE 229
JOHNSON CONTROLS: DEALS


TABLE 230
SIEMENS: COMPANY OVERVIEW


TABLE 231
SIEMENS: PRODUCTS/SOLUTIONS/SERVICES OFFERED


TABLE 232
SIEMENS: PRODUCT LAUNCHES/ENHANCEMENTS


TABLE 233
SIEMENS: DEALS


TABLE 234
EATON: COMPANY OVERVIEW


TABLE 235
EATON: PRODUCTS/SOLUTIONS/SERVICES OFFERED


TABLE 236
EATON: PRODUCT LAUNCHES/ENHANCEMENTS


TABLE 237
EATON: DEALS


TABLE 238
HUAWEI: COMPANY OVERVIEW


TABLE 239
HUAWEI: PRODUCTS/SOLUTIONS/SERVICES OFFERED


TABLE 240
HUAWEI: PRODUCT LAUNCHES/ENHANCEMENTS


TABLE 241
ABB: COMPANY OVERVIEW


TABLE 242
ABB: PRODUCTS/SOLUTIONS/SERVICES OFFERED


TABLE 243
ABB: DEALS


TABLE 244
FNT SOFTWARE: COMPANY OVERVIEW


TABLE 245
FNT SOFTWARE: PRODUCTS/SOLUTIONS/SERVICES OFFERED


TABLE 246
FNT SOFTWARE: PRODUCT LAUNCHES/ENHANCEMENTS


TABLE 247
FNT SOFTWARE: DEALS


TABLE 248
NLYTE SOFTWARE: COMPANY OVERVIEW


TABLE 249
NLYTE SOFTWARE: PRODUCTS/SOLUTIONS/SERVICES OFFERED


TABLE 250
NLYTE SOFTWARE: PRODUCT LAUNCHES/ENHANCEMENTS


TABLE 251
NLYTE SOFTWARE: DEALS


TABLE 252
SUNBIRD SOFTWARE: COMPANY OVERVIEW


TABLE 253
SUNBIRD SOFTWARE: PRODUCTS/SOLUTIONS/SERVICES OFFERED


TABLE 254
SUNBIRD SOFTWARE: PRODUCT LAUNCHES/ENHANCEMENTS


TABLE 255
SUNBIRD SOFTWARE: DEALS


TABLE 256
FACTOR ANALYSIS


TABLE 257
DATA CENTER SOLUTIONS MARKET, BY OFFERING, 2018–2022 (USD MILLION)


TABLE 258
DATA CENTER SOLUTIONS MARKET, BY OFFERING, 2023–2028 (USD MILLION)


TABLE 259
DATA CENTER SOLUTIONS MARKET, BY VERTICAL, 2018–2022 (USD MILLION)


TABLE 260
DATA CENTER SOLUTIONS MARKET, BY VERTICAL, 2023–2028 (USD MILLION)


TABLE 261
DATA CENTER SOLUTIONS MARKET, BY REGION, 2018–2022 (USD MILLION)


TABLE 262
DATA CENTER SOLUTIONS MARKET, BY REGION, 2023–2028 (USD MILLION)


TABLE 263
DATA CENTER TRANSFORMATION MARKET, BY SERVICE TYPE, 2017–2022 (USD MILLION)


TABLE 264
DATA CENTER TRANSFORMATION MARKET, BY SERVICE TYPE, 2023–2028 (USD MILLION)


TABLE 265
DATA CENTER TRANSFORMATION MARKET, BY VERTICAL, 2017–2022 (USD MILLION)


TABLE 266
DATA CENTER TRANSFORMATION MARKET, BY VERTICAL, 2023–2028 (USD MILLION)


TABLE 267
DATA CENTER TRANSFORMATION MARKET, BY REGION, 2017–2022 (USD MILLION)


TABLE 268
DATA CENTER TRANSFORMATION MARKET, BY REGION, 2023–2028 (USD MILLION)


LIST OF FIGURES


FIGURE 1
DATA CENTER INFRASTRUCTURE MANAGEMENT MARKET SNAPSHOT, 2021–2031


FIGURE 2
MAJOR STRATEGIES ADOPTED BY KEY PLAYERS IN DATA CENTER INFRASTRUCTURE MARKET, 2023–2026


FIGURE 3
DISRUPTIONS INFLUENCING GROWTH OF DATA CENTER INFRASTRUCTURE MANAGEMENT MARKET


FIGURE 4
HIGH-GROWTH SEGMENTS IN DATA CENTER INFRASTRUCTURE MANAGEMENT MARKET, 2026–2031


FIGURE 5
ASIA PACIFIC TO REGISTER HIGHEST CAGR IN DATA CENTER INFRASTRUCTURE MANAGEMENT MARKET DURING FORECAST PERIOD


FIGURE 6
SURGE IN DEMAND FOR EFFICIENT DATA CENTER MANAGEMENT AND OPERATIONAL EFFICIENCY TO PROPEL MARKET


FIGURE 7
DCIM SOFTWARE SEGMENT TO ACCOUNT FOR LARGER MARKET SHARE THAN SERVICES SEGMENT IN 2026 AND 2031


FIGURE 8
ASSET MANAGEMENT SEGMENT TO ACCOUNT FOR LARGEST MARKET SHARE IN 2026 AND 2031


FIGURE 9
ON-PREMISES SEGMENT TO ACCOUNT FOR LARGER MARKET SHARE THAN CLOUD SEGMENT IN 2026 AND 2031


FIGURE 10
TIER 4 SEGMENT TO ACCOUNT FOR LARGEST MARKET SHARE IN 2026


FIGURE 11
LARGE DATA CENTERS SEGMENT TO ACCOUNT FOR LARGEST MARKET SHARE IN 2026


FIGURE 12
ENTERPRISES SEGMENT TO ACCOUNT FOR LARGEST MARKET SHARE IN 2026 AND 2031


FIGURE 13
ASIA PACIFIC TO EMERGE AS BEST MARKET FOR INVESTMENTS IN NEXT FIVE YEARS


FIGURE 14
DATA CENTER INFRASTRUCTURE MANAGEMENT MARKET: DRIVERS, RESTRAINTS, OPPORTUNITIES, AND CHALLENGES


FIGURE 15
DATA CENTER INFRASTRUCTURE MANAGEMENT MARKET: PORTER’S FIVE FORCES ANALYSIS


FIGURE 16
DATA CENTER INFRASTRUCTURE MANAGEMENT MARKET: SUPPLY CHAIN ANALYSIS


FIGURE 17
DATA CENTER INFRASTRUCTURE MANAGEMENT MARKET: ECOSYSTEM


FIGURE 18
DATA CENTER INFRASTRUCTURE MANAGEMENT MARKET: TRENDS/DISRUPTIONS IMPACTING CUSTOMER BUSINESS


FIGURE 19
INVESTMENT AND FUNDING SCENARIO OF MAJOR DATA CENTER INFRASTRUCTURE MANAGEMENT COMPANIES


FIGURE 20
DCIM MARKET: PATENT ANALYSIS, 2015–2025


FIGURE 21
FUTURE APPLICATIONS OF DATA CENTER INFRASTRUCTURE MANAGEMENT MARKET


FIGURE 22
DATA CENTER INFRASTRUCTURE MANAGEMENT MARKET: DECISION-MAKING FACTORS


FIGURE 23
INFLUENCE OF STAKEHOLDERS ON BUYING PROCESS FOR END USERS


FIGURE 24
KEY BUYING CRITERIA FOR END USERS


FIGURE 25
ADOPTION BARRIERS AND INTERNAL CHALLENGES


FIGURE 26
SERVICES SEGMENT TO REGISTER HIGHER CAGR THAN DCIM SOFTWARE SEGMENT DURING FORECAST PERIOD


FIGURE 27
PERFORMANCE OPTIMIZATION SEGMENT TO REGISTER HIGHEST CAGR DURING FORECAST PERIOD


FIGURE 28
ON-PREMISES SEGMENT TO LEAD MARKET DURING FORECAST PERIOD


FIGURE 29
TIER 3 SEGMENT TO REGISTER HIGHEST CAGR DURING FORECAST PERIOD


FIGURE 30
SMALL DATA CENTERS SEGMENT TO REGISTER HIGHEST CAGR DURING FORECAST PERIOD


FIGURE 31
ENTERPRISES SEGMENT TO LEAD MARKET DURING FORECAST PERIOD


FIGURE 32
NORTH AMERICA TO LEAD MARKET FROM 2026 TO 2031


FIGURE 33
NORTH AMERICA: DATA CENTER INFRASTRUCTURE MANAGEMENT MARKET SNAPSHOT


FIGURE 34
ASIA PACIFIC: DATA CENTER INFRASTRUCTURE MANAGEMENT MARKET SNAPSHOT


FIGURE 35
DATA CENTER INFRASTRUCTURE MANAGEMENT MARKET: MARKET SHARE ANALYSIS


FIGURE 36
DATA CENTER INFRASTRUCTURE MANAGEMENT MARKET: BRAND/PRODUCT COMPARISON


FIGURE 37
HISTORICAL REVENUE ANALYSIS, 2021–2025 (USD MILLION)


FIGURE 38
COMPANY EVALUATION MATRIX FOR KEY PLAYERS: CRITERIA WEIGHTAGE


FIGURE 39
DATA CENTER INFRASTRUCTURE MANAGEMENT MARKET: COMPANY EVALUATION MATRIX (KEY PLAYERS), 2023


FIGURE 40
DATA CENTER INFRASTRUCTURE MANAGEMENT MARKET: COMPANY FOOTPRINT


FIGURE 41
EVALUATION MATRIX FOR STARTUPS/SMES: CRITERIA WEIGHTAGE


FIGURE 42
DATA CENTER INFRASTRUCTURE MANAGEMENT MARKET: COMPANY EVALUATION MATRIX (STARTUPS/SMES), 2025


FIGURE 43
EV/EBITDA OF KEY VENDORS


FIGURE 44
YEAR-TO-DATE (YTD) PRICE TOTAL RETURN AND 5-YEAR STOCK BETA OF KEY VENDORS


FIGURE 45
VALUATION OF KEY VENDORS


FIGURE 46
SCHNEIDER ELECTRIC: COMPANY SNAPSHOT


FIGURE 47
VERTIV: COMPANY SNAPSHOT


FIGURE 48
JOHNSON CONTROLS: COMPANY SNAPSHOT


FIGURE 49
SIEMENS: COMPANY SNAPSHOT


FIGURE 50
EATON: COMPANY SNAPSHOT


FIGURE 51
HUAWEI: COMPANY SNAPSHOT


FIGURE 52
ABB: COMPANY SNAPSHOT


FIGURE 53
DATA CENTER INFRASTRUCTURE MANAGEMENT MARKET: RESEARCH DESIGN


FIGURE 54
BREAKUP OF PRIMARY INTERVIEWS: BY COMPANY TYPE, DESIGNATION, AND REGION


FIGURE 55
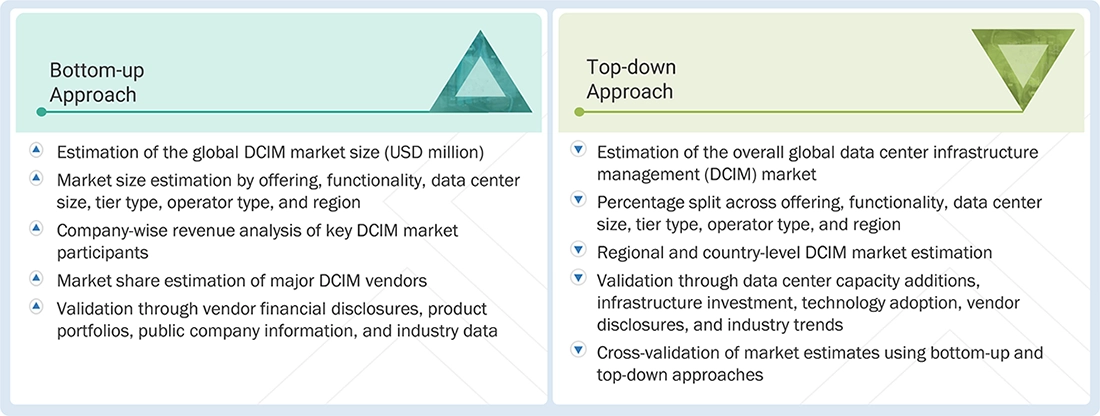
DATA CENTER INFRASTRUCTURE MANAGEMENT MARKET: TOP-DOWN AND BOTTOM-UP APPROACHES


FIGURE 56
MARKET SIZE ESTIMATION METHODOLOGY: SUPPLY-SIDE ANALYSIS


FIGURE 57
MARKET SIZE ESTIMATION METHODOLOGY - BOTTOM-UP APPROACH (SUPPLY SIDE): COLLECTIVE REVENUE OF DCIM VENDORS


FIGURE 58
MARKET SIZE ESTIMATION METHODOLOGY – (SUPPLY SIDE): ILLUSTRATION OF VENDOR REVENUE ESTIMATION


FIGURE 59
MARKET SIZE ESTIMATION METHODOLOGY – APPROACH 2 (DEMAND SIDE): REVENUE GENERATED FROM OFFERINGS


FIGURE 60
MARKET SIZE ESTIMATION METHODOLOGY – APPROACH 2 (DEMAND SIDE): DATA CENTER INFRASTRUCTURE MANAGEMENT MARKET


Methodology

The study involved four major activities to estimate the data center infrastructure management market. We conducted secondary research to gather information on the market, competitors, and the parent market. The next stage was to validate these findings and assumptions and size them with industry professionals across the value chain through primary research. Top-down and bottom-up methodologies were used to determine the total market size. We used market breakup and data triangulation techniques to estimate the market size of the data center infrastructure management market segments.     

Secondary Research

Multiple sources were used to collect data for this research project during the secondary research phase. These included annual reports, press releases, investor presentations, white papers, journals, publications, and articles from reputable sources, as well as directories and databases. Information was also collected from additional secondary sources such as academic journals, official government sites, blogs, and vendor websites.

Primary Research

Primary sources included industry experts from the core and associated industries, preferred software suppliers, hardware manufacturers, distributors, service providers, technology developers, alliances, and organizations representing all parts of the industry's value chain. In-depth interviews were conducted with primary respondents, including major industry participants, subject-matter experts, C-level executives at key market companies, and industry consultants, to collect and verify critical qualitative and quantitative data and to analyze the market's potential.

Primary interviews were conducted to gain insights such as market statistics, current disruptive industry trends, new use cases, revenue data from products and services, market breakdowns, size projections, predictions, and data triangulation. This research also helped to understand various technology trends, segmentation types, industry movements, and geographic factors. Demand-side stakeholders—including Chief Information Officers (CIOs), Chief Technology Officers (CTOs), Chief Security Officers (CSOs), installation teams of governments and end users utilizing data center infrastructure management solutions and services, as well as digital initiatives project teams—were interviewed to understand the buyer's perspective on suppliers, products, service providers, and current service usage, which influence the overall data center infrastructure management market.

Breakup of Primary Profiles:

Data Center Infrastructure Management Market Size, and Share

*Others include sales managers, marketing managers, and product managers
Note: Tier 1 – recorded overall annual revenues of more than USD 10 billion; Tier 2 company – USD 1–10 billion; and Tier 3 company – USD 500 million – 1 billion of the overall revenues

To know about the assumptions considered for the study, download the pdf brochure

Market Size Estimation

The data center infrastructure management market and related submarkets were estimated and forecasted using top-down and bottom-up methodologies. A bottom-up approach was employed to determine the overall market size by analyzing the revenues and offerings of significant market players. Data triangulation and validation through primary interviews were utilized to establish and confirm the precise value of the parent market. The overall market size was used in the top-down process to estimate the size of other specific markets through percentage splits of market segments.  

Top-down and bottom-up approaches were used to estimate and validate the data center infrastructure management market and its dependent subsegments. 
The research methodology used to estimate the market size included the following details:    

  •  Key players in the market were identified through secondary research. Their revenue contributions in the respective countries were then determined using primary and secondary research..
  • This procedure included studying top market players’ annual and financial reports and extensive interviews for key insights from industry leaders, such as Chief Executive Officers (CEOs), VPs, directors, and marketing executives.
  • All percentage splits and breakups were determined using secondary sources and verified through primary sources.

Using top-down and bottom-up methodologies, the data center infrastructure management market and related submarkets were estimated and forecasted. a bottom-up approach was used to calculate the overall market size by analyzing the revenues and offerings of significant market players. data triangulation methods and validation through primary interviews were employed to determine and confirm the precise worth of the entire parent market. the overall market size in the top-down process was used to estimate the size of other specific markets using percentage splits of market segments.

Data Center Infrastructure Management Market : Top-Down and Bottom-Up Approach

Data Center Infrastructure Management Market Top Down and Bottom Up Approach

Data Triangulation

After determining the overall market size, the market was segmented and subsegmented using the previously described market size estimation techniques. Where applicable, data triangulation and market breakdown methods were used to complete the market engineering process and determine the exact numbers for each market segment and subsegment. The data was triangulated by evaluating multiple elements and trends on the demand and supply sides of the data center infrastructure management (DCIM) market. 

Market Definition

Based on input from various sources and associations, data center infrastructure management (DCIM) is defined as “a suite of tools and platforms that a data center can use to control and monitor the IT, facility, and environmental settings across all departments. Flexible integration with IT and facility management enables DCIM systems to provide real-time operating information necessary for more efficient resource utilization, energy conservation, and operational enhancements in a data center.”    

Key Stakeholders

  • Cloud Service Providers (CSPs)
  • Original Equipment Manufacturers (OEMs)
  • Data Center Equipment Suppliers
  • Colocation Providers
  • Technology Services Providers
  • Data Center Managed Service Providers
  • Government Organizations
  • Networking Companies
  • Consultants/Consultancies/Advisory Firms
  • Support and Maintenance Service Providers
  • Telecom Service Providers
  • Information Technology (IT) Infrastructure Providers
  • System Integrators (SIs)
  • Regional Associations
  • Independent Software Vendors
  • Value-added Resellers and Distributors

Report Objectives

  • To define, describe, and forecast the data center infrastructure management (DCIM) market based on offering, functionality, deployment mode, tier type, data center size, end user, and region
  • To forecast the market size of the five major regional segments: North America, Europe, Asia Pacific, Middle East & Africa, and Latin America
  • To strategically analyze the market subsegments concerning individual growth trends, prospects, and contributions to the total market
  • To provide detailed information related to the significant factors influencing the growth of the market (drivers, restraints, opportunities, and challenges)
  • To strategically analyze macro and micromarkets concerning growth trends, prospects, and their contribution to the overall market
  • To analyze industry trends, patents and innovations, and pricing data related to the market
  • To analyze the opportunities in the market for stakeholders and provide details of the competitive landscape for major players
  • To profile key players in the market and comprehensively analyze their market share/ranking and core competencies
  • To track and analyze competitive developments, such as mergers & acquisitions, product developments, and partnerships & collaborations in the market

Available customizations:

With the given market data, MarketsandMarkets offers customizations per the company's specific needs. The following customization options are available for the report:

Product Analysis

  • The product matrix provides a detailed comparison of each company's product portfolio.

Geographic Analysis

  • Further breakup of the Asia Pacific market into countries contributing 75% to the regional market size
  • Further breakup of the North American market into countries contributing 75% to the regional market size
  • Further breakup of the Latin American market into countries contributing 75% to the regional market size
  • Further breakup of the Middle Eastern & African market into countries contributing 75% to the regional market size
  • Further breakup of the European market into countries contributing 75% to the regional market size  

Company Information

  • Detailed analysis and profiling of additional market players (up to 5)

Personalize This Research

  • Triangulate with your Own Data
  • Get Data as per your Format and Definition
  • Gain a Deeper Dive on a Specific Application, Geography, Customer or Competitor
  • Any level of Personalization
Request A Free Customisation

Let Us Help You

  • What are the Known and Unknown Adjacencies Impacting the Data Center Infrastructure Management Market
  • What will your New Revenue Sources be?
  • Who will be your Top Customer; what will make them switch?
  • Defend your Market Share or Win Competitors
  • Get a Scorecard for Target Partners
Customized Workshop Request

Custom Market Research Services

We Will Customise The Research For You, In Case The Report Listed Above Does Not Meet With Your Requirements

Get 10% Free Customisation

TESTIMONIALS

Growth opportunities and latent adjacency in Data Center Infrastructure Management Market

DMCA.com Protection Status
popup img