
Tax Management Market Size, Share, Growth & Latest trends

Tax Management Market by Solution Type (Tax Compliance & Optimization, Document Management & Archiving, Tax Preparation & Reporting, Tax Analytics Tools, Audit & Risk Management Tools), Tax Type (Indirect Tax and Direct Tax) - Global Forecast to 2030


OVERVIEW
Source: Secondary Research, Interviews with Experts, MarketsandMarkets Analysis
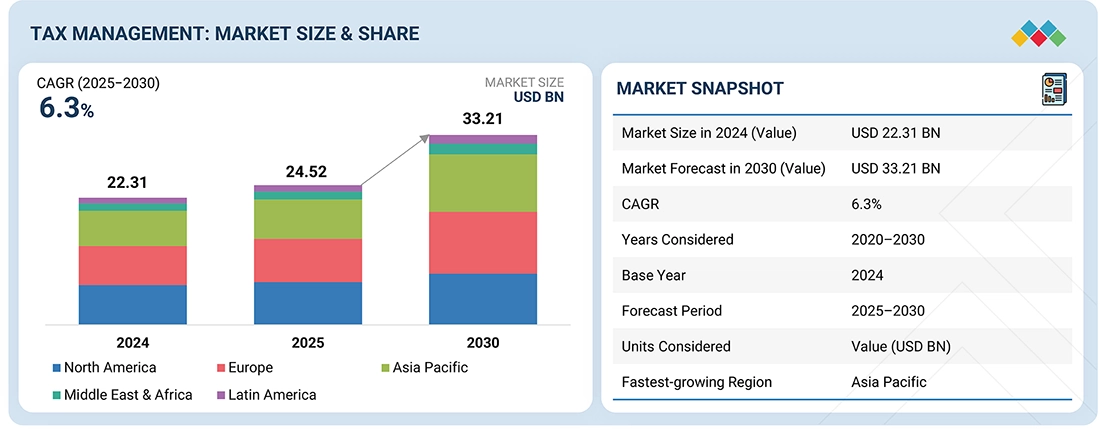
The global tax management market is set for substantial growth, with estimates showing an increase from USD 24.52 billion in 2025 to USD 33.21 billion by 2030, at a CAGR of 6.3%. This growth reflects a rising need for flexible, compliant, and internationally coordinated tax systems as multinational companies deal with complex regulations, cross-border activities, and real-time reporting demands. Key growth areas include cloud-based tax automation, indirect tax compliance, and transfer pricing management, supported by improved accuracy, consistency, and flexibility. Government initiatives that promote digital tax reporting, e-invoicing, and standardized audit trails are accelerating this trend, while public-private partnerships are encouraging technological adoption, reinforcing the importance of tax management in financial governance.
Market Size and Forecast:
- 2024 Market Size: USD 22.31 Billion
- 2025 Projected Market Size: USD 24.52 Billion
- 2030 Forecasted Market Size: USD 33.21 Billion
- Growth Rate (2025-2030): CAGR of 6.3%
- Data available from 2025 to 2030
Key Market Trends and Insights
- Fastest Growing region: Asia Pacific
-
Driving Factors: Complex tax regulations, digitalization, and demand for automated compliance solutions.
- Latest Trends: AI automation, global e-invoicing mandates, and a shift toward cloud platforms.
- Opportunities Exist: AI-driven compliance, real-time tax analytics, and cloud-based automation for global tax efficiency.
- AI Impact: AI is transforming the Tax Management Market by automating compliance, improving tax accuracy, and enabling predictive analytics for smarter decision-making.
KEY TAKEAWAYS
-
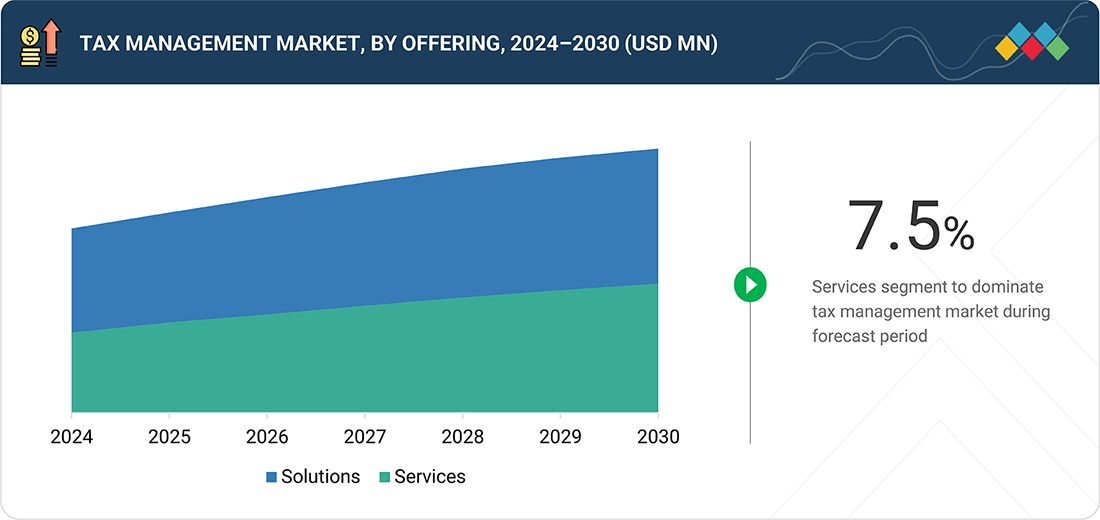
BY OFFERINGThe tax management services segment is expected to grow at the highest CAGR among offerings. Tax management services help organizations maximize their platforms through expert consulting, implementation, training, and ongoing support. They facilitate smooth system integration, customized workflows, and continuous compliance, assisting businesses in achieving efficiency and long-term success in tax operations.
-
BY TAX TYPEIndirect tax solutions are expected to hold the largest market share. They automate VAT, GST, and sales tax compliance, providing real-time calculation, filing, and exemption management. With integrations into ERP and e-commerce systems, they reduce compliance risks, enhance accuracy, and streamline cross-border tax operations.
-
BY VERTICALThe retail and e-commerce sector is projected to have the highest CAGR growth, fueled by rising online transactions and complex multi-jurisdictional tax requirements. Automated tax management solutions assist these businesses in ensuring precise compliance, simplifying reporting, and expanding efficiently across regions.
-
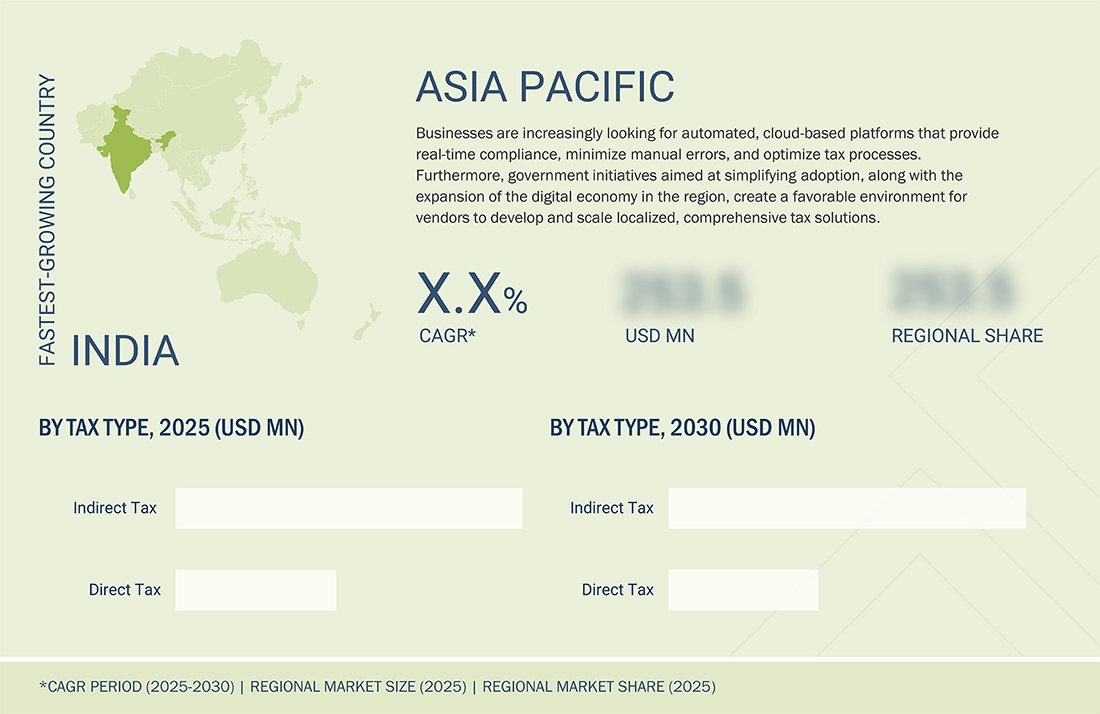
BY REGIONAsia Pacific is expected to grow fastest, driven by increasing digital adoption, expanding cross-border trade, and rising compliance demands across BFSI, retail, and manufacturing. Organizations are leveraging AI-enabled tax platforms for real-time reporting, multi-jurisdictional compliance, and automated document management to meet complex regulatory requirements. The growing focus on automation, accuracy, and operational efficiency positions Asia Pacific as a high-growth region for next-generation tax management solutions.
-
COMPETITIVE LANDSCAPEMajor players in the tax management market have adopted both organic and inorganic strategies, such as partnerships, investments, and strategic collaborations. For example, Wolters Kluwer, Thomson Reuters, Avalara, ADP, and Vertex are forming agreements and alliances to meet the growing demand for tax management solutions across various industries and enterprise applications.
The tax management market is witnessing steady growth, driven by the rising demand for automated, AI-powered solutions that enhance compliance, improve accuracy, and streamline reporting across multiple tax types, including direct and indirect taxes. Organizations are increasingly adopting these solutions to reduce operational risks, ensure regulatory adherence, and achieve cost efficiencies. New deals and developments, including strategic partnerships between software vendors and enterprises, investments in cloud-based platforms and real-time analytics, and innovations in AI-driven tax planning, cross-border compliance tools, and sustainable process automation, are reshaping the industry landscape.
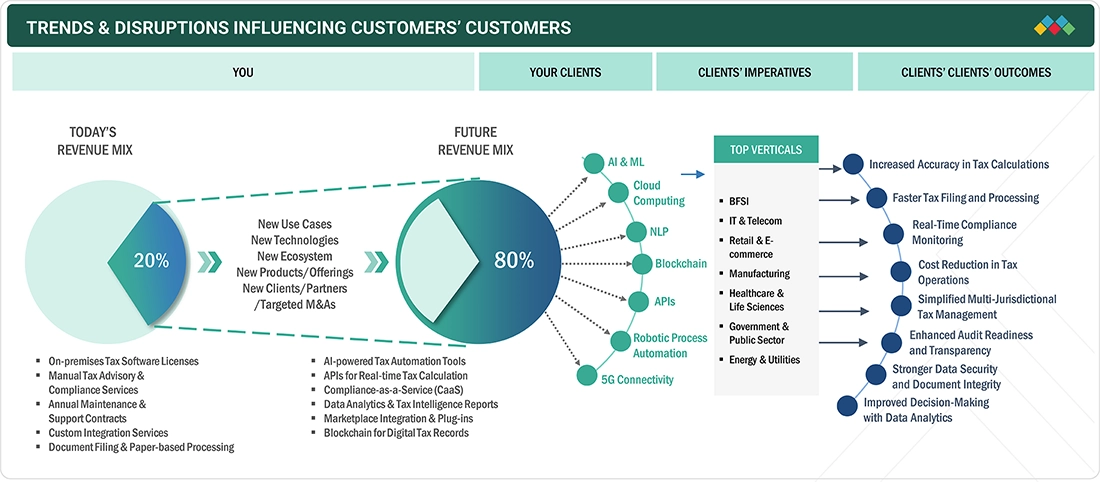
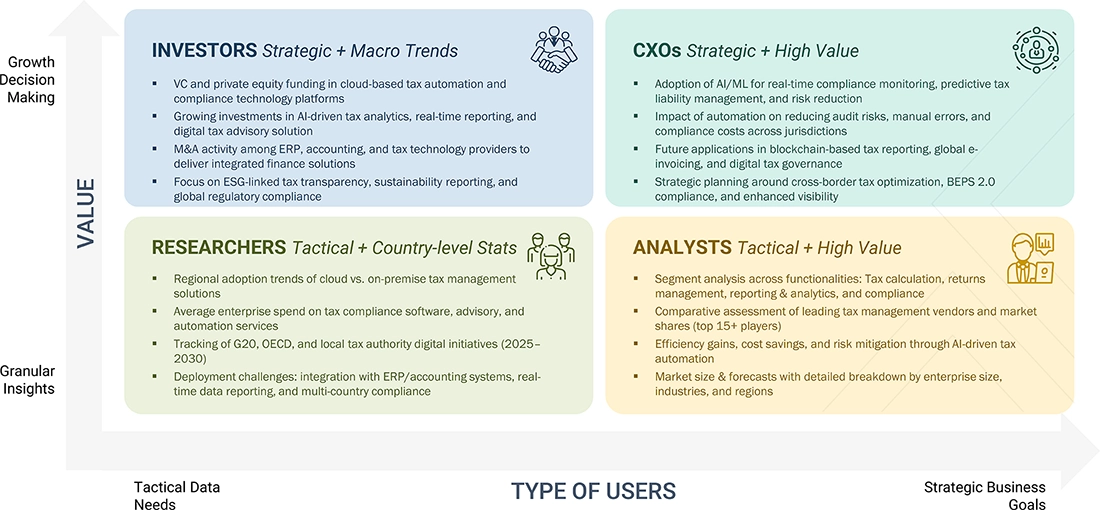
TRENDS & DISRUPTIONS IMPACTING CUSTOMERS' CUSTOMERS
The section highlights the key trends and disruptions shaping the tax management market, focusing on how compliance models are shifting toward AI-driven automation, advanced analytics, and cloud-based platforms. It emphasizes the evolving priorities of core client segments such as BFSI, retail, and manufacturing, linking their strategic imperatives to measurable outcomes like improved compliance accuracy, reduced reporting timelines, cost efficiency, regulatory adherence, and enhanced transparency in tax operations.
Source: Secondary Research, Interviews with Experts, MarketsandMarkets Analysis
MARKET DYNAMICS
Level
-
Global business growth demands agile tax management infrastructure

-
Adoption of AI tools boosts tax accuracy and efficiency

Level
-
Integration with legacy system delays cloud-based tax adoption

Level
-
Automation adoption by SMEs fuels tax management expansion

-
Advisory services boosts innovation in tax management

Level
-
Shortage of skilled workforce slows tax tech adoption

Source: Secondary Research, Interviews with Experts, MarketsandMarkets Analysis
Driver: Global business growth demand an agile tax management infrastructure
The globalization of business operations is expected to propel the tax management market as companies encounter increasing complexity in cross-border compliance. Frequent policy changes, e-invoicing mandates, in-country data retention, and local language requirements raise the risk of errors, inefficiencies, and penalties. To address these challenges, organizations are adopting advanced tax management solutions that offer real-time updates, localized compliance, and seamless ERP integration. Vendors like Vertex, Thomson Reuters, Avalara, and Sovos help global enterprises automate indirect tax, simplify reporting, and maintain centralized tax data, driving widespread adoption of intelligent tax technology.
Restraint: Integration with legacy systems delays cloud-based tax adoption
Integration with legacy systems delays cloud-based tax adoption and is expected to hinder the growth of tax management solutions. Outdated, siloed platforms often lack flexibility and interoperability, making adoption costly, time-consuming, and prone to data errors. Many organizations require heavy customization or middleware to bridge gaps, straining IT resources and delaying transformation initiatives. This barrier is especially challenging for multinational firms with diverse regulatory obligations, slowing the shift toward advanced tax management technologies. As a result, businesses with rigid IT frameworks or limited budgets may postpone investments, hindering overall market adoption and slowing digital transformation in tax compliance.
Opportunity: Growing adoption of tax automation by SMEs
The increasing use of automation and AI by SMEs is expected to drive strong growth in the tax management market. With rising regulatory complexity, limited expertise, and tight deadlines, SMEs are turning to digital tools to boost efficiency and ensure compliance. Manual tasks like invoicing, expense tracking, and reporting often lead to errors, increasing demand for integrated, automated solutions. A 2023 Intuit QuickBooks survey revealed that 68% of SMEs plan to automate invoicing and 69% want to automate expense management, both vital for tax preparation. Cloud-based tax platforms, valued for their scalability, user-friendliness, and seamless integration, are especially attractive to this market segment. As SMEs speed up their digital transformation to fuel growth, they form a rapidly expanding customer base, creating significant opportunities for vendors in long-term innovation and market expansion.
Challenge: Frequent changes in tax regulations present an ongoing challenge for tax management systems
Frequent regulatory changes are expected to be one of the major challenges for tax management, especially for enterprises operating across multiple jurisdictions. Governments are introducing mandates like real-time e-invoicing, digital VAT reporting, and country-specific compliance rules with tight deadlines, pushing companies to adapt quickly. Avalara projects global e-invoicing adoption to increase from 47% in 2025 to 57% by 2027, while initiatives such as the EU’s ViDA aim to cut tax fraud by USD 11.9 billion annually and significantly reduce compliance costs. In India, expanded e-invoicing could unlock USD 3.9 billion in value and deliver average savings of USD 132,000 per business. These shifts require continuous updates to tax systems, localized rule settings, and adherence to language and data retention requirements, which add to operational strain. Enterprises with legacy systems face higher risks of delays, inaccuracies, and penalties, prompting the adoption of modern tax platforms with real-time updates, jurisdictional customization, and automated compliance workflows.
Tax Management Market: COMMERCIAL USE CASES ACROSS INDUSTRIES
| COMPANY | USE CASE DESCRIPTION | BENEFITS |
|---|---|---|
 |
Inovonics faced multi-state tax compliance and certificate management challenges; solved them by adopting Avalara’s full tax compliance suite | Avalara automated tax calculations, returns filing, and certificate management, reducing compliance risks and manual effort. Inovonics gained peace of mind, confident compliance across 20 states, and streamlined processes that scale effortlessly with business growth. |
 |
Presti & Naegele used CCH ProSystem fx Tax and CCH Axcess to streamline tax compliance and manage a growing remote workforce efficiently. | The firm improved accuracy and reliability in tax calculations, gained real-time visibility into workflows, and optimized staff management. Automated document handling and secure portals enhanced client collaboration, while hybrid operations supported remote hiring and scalable growth. |
 |
Wesleyan University automated its paper-heavy payroll and tax processes using ADP SmartCompliance, improving compliance and efficiency. | Streamlined W-2C processing, reduced tax notices, real-time tax updates, and reliable ADP support enhanced payroll accuracy and reporting. |
 |
LEGO automated complex e-commerce sales tax and holiday management by partnering with Vertex. | Sales tax is now calculated automatically and accurately on every online transaction, ensuring compliance and a seamless customer experience. Automated handling of sales tax holidays reduces manual effort and errors, freeing the Tax Operations team to focus on strategic projects. |
Logos and trademarks shown above are the property of their respective owners. Their use here is for informational and illustrative purposes only.
MARKET ECOSYSTEM
The ecosystem in tax management includes end-to-end platforms and specialized tools that support essential functions such as tax compliance engines, preparation and reporting, analytics, and document management with archiving. Solution providers offer features like automated compliance checks, real-time reporting, advanced tax analytics, and secure digital recordkeeping to improve accuracy and transparency. These tools help organizations streamline tax workflows, comply with changing regulations, and make data-driven financial decisions while lowering manual effort and compliance risks.
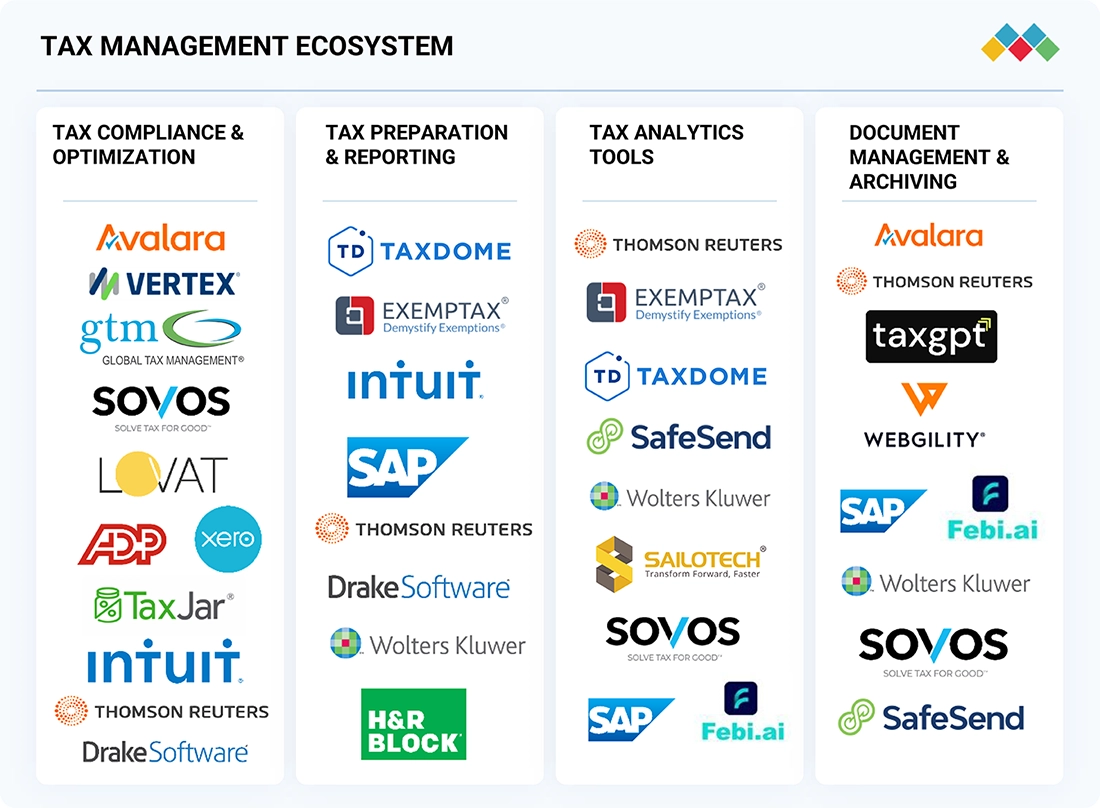
Logos and trademarks shown above are the property of their respective owners. Their use here is for informational and illustrative purposes only.
MARKET SEGMENTS
Source: Secondary Research, Interviews with Experts, MarketsandMarkets Analysis
Tax Management Market, By Offering
In the tax management market, the solution segment is expected to hold the largest share as enterprises increasingly adopt advanced platforms to address growing regulatory complexity. Solutions such as tax compliance engines, preparation and reporting tools, analytics platforms, and document management systems provide end-to-end automation and accuracy, reducing manual effort and compliance risks. With mandates like e-invoicing and digital reporting expanding globally, organizations prioritize scalable, cloud-based tax solutions that integrate seamlessly with ERP systems. These platforms not only streamline workflows but also enable real-time updates, localized compliance, and advanced data insights. As businesses focus on cost efficiency and risk reduction, the demand for comprehensive tax management solutions continues to outpace services, driving their dominant market position.
Tax Management Market, By Tax Type
The indirect tax segment is expected to hold the largest market share due to the increasing complexity of VAT, GST, sales, and excise tax regulations across multiple jurisdictions. Businesses are facing growing requirements for real-time e-invoicing, digital reporting, and country-specific compliance, making automation essential. Indirect tax solutions help organizations calculate, collect, and remit taxes accurately while reducing manual errors and compliance risks. Integration with ERP systems allows centralized management and reporting, enhancing efficiency and transparency. As global trade and cross-border transactions expand, companies prioritize indirect tax automation to ensure timely compliance, optimize tax processes, and minimize financial exposure, driving strong adoption in this segment.
Tax Management Market, By Vertical
The BFSI segment is expected to command the largest market share in the tax management industry due to the sector’s high transaction volumes, strict regulatory requirements, and complex tax obligations across multiple jurisdictions. Banks, insurance companies, and financial institutions need accurate, real-time tax calculations, reporting, and compliance to reduce risks and avoid penalties. Advanced tax management solutions enable BFSI organizations to automate indirect and direct tax processes, integrate with ERP systems, and keep audit-ready records. The demand for efficiency, transparency, and regulatory compliance drives strong adoption of cloud-based and AI-powered tax platforms. With increasing digital transactions and cross-border operations, BFSI remains a key driver of market growth.
REGION
Asia Pacific is expected to grow at the highest CAGR in market during the forecast period
The Asia Pacific tax management market is accelerating due to regulatory digitization, rapid growth in digital commerce, and vendor-driven localization strategies. Governments across the region are mandating real-time reporting and e-invoicing, pushing enterprises to adopt scalable, automated tax platforms. For instance, Peppol e-invoicing in Australia surged from 16,000 in 2022 to over 410,000 by January 2025, while Singapore’s InvoiceNow Accelerate initiative further eased adoption with free infrastructure support. Vendors are also investing heavily, with Avalara expanding its engineering base in India and Vertex enhancing its cloud compliance platform to align with Asia Pacific-specific transaction controls. These dynamics create a strong environment for recurring revenue growth, early partnerships, and localized innovation. The region offers a significant opportunity for end-to-end compliance transformation as digital and fiscal modernization accelerates.
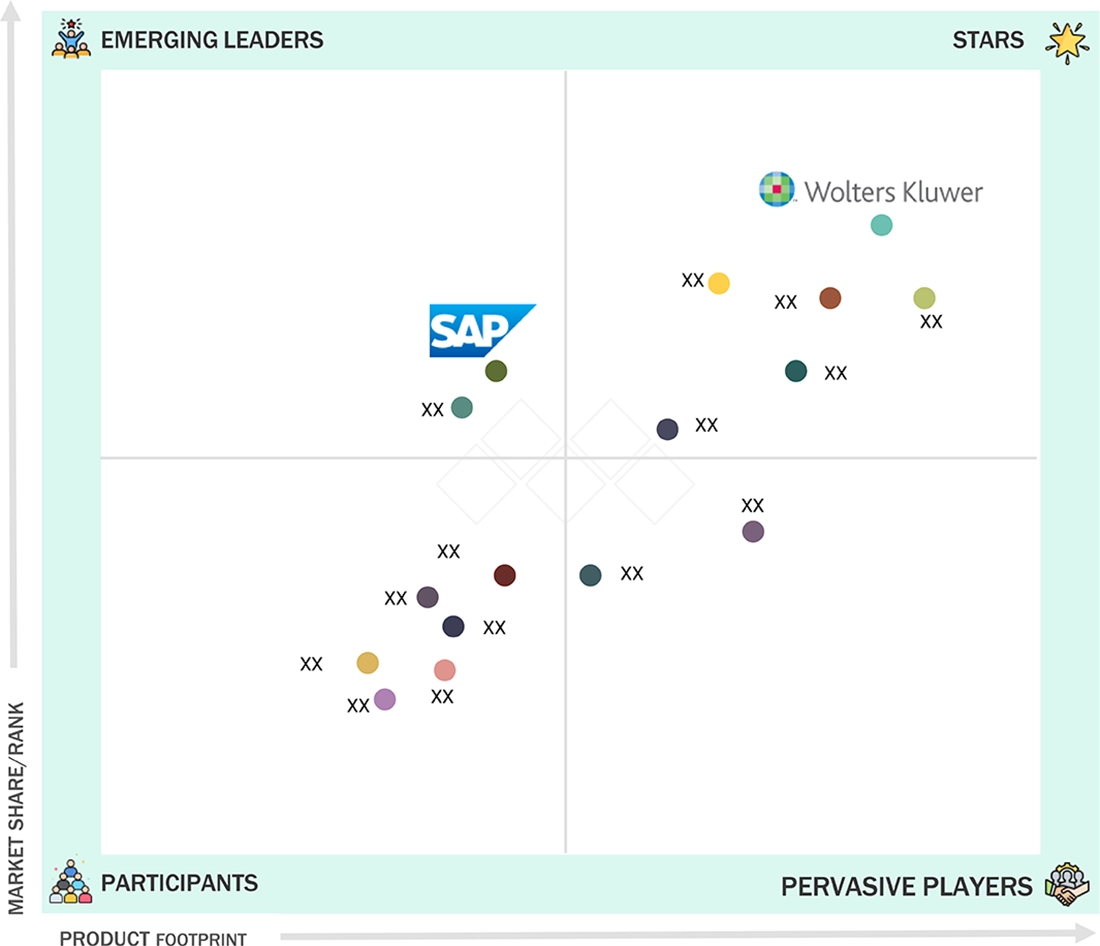
Tax Management Market: COMPANY EVALUATION MATRIX
In the tax management market matrix, Wolters Kluwer (Star) leads with a strong market presence and a comprehensive suite of tax solutions, supporting large-scale adoption across industries such as BFSI, retail, and manufacturing. SAP (Emerging Leader) is gaining traction with scalable, data-driven platforms tailored for multinational enterprises and complex tax environments. While Wolters Kluwer dominates with extensive regulatory coverage and integrated compliance capabilities, other providers like Vertex and Avalara show strong growth potential to move toward the leaders’ quadrant.
Source: Secondary Research, Interviews with Experts, MarketsandMarkets Analysis
KEY MARKET PLAYERS
MARKET SCOPE
| REPORT METRIC | DETAILS |
|---|---|
| Market Size in 2024 (Value) | USD 22.31 BN |
| Market Forecast in 2030 (value) | USD 33.21 BN |
| Growth Rate | 6.3% |
| Years Considered | 2020–2030 |
| Base Year | 2024 |
| Forecast Period | 2025–2030 |
| Units Considered | Value (USD BN) |
| Report Coverage | Revenue forecast, company ranking, competitive landscape, growth factors, and trends |
| Segments Covered |
|
| Regions Covered | North America, Asia Pacific, Europe, Latin America, Middle East & Africa |
WHAT IS IN IT FOR YOU: Tax Management Market REPORT CONTENT GUIDE
DELIVERED CUSTOMIZATIONS
We have successfully delivered the following deep-dive customizations:
| CLIENT REQUEST | CUSTOMIZATION DELIVERED | VALUE ADDS |
|---|---|---|
| Leading Solution Provider (US) |
|
|
| Leading Solution Provider (EU) | Detailed analysis and profiling of additional market players (up to 5) |
|
RECENT DEVELOPMENTS
- June 2025 : Sovos partnered with Shopify to launch automated sales tax filing through Shopify Tax in the US. The integration enables eligible Shopify merchants to automate the preparation, filing, and remittance of sales tax returns using Sovos' Sales and Use Tax Filing solution. The partnership helps reduce manual effort, minimize audit risks, and streamline tax compliance, allowing merchants to focus on growing their business.
- June 2025 : Vertex joined Oracle's enhanced partner program, strengthening its long-standing collaboration with Oracle to deliver integrated global tax automation solutions. This partnership allows Vertex to embed its certified tax technology within Oracle Fusion Cloud Applications, helping businesses across industries manage tax with greater accuracy, automation, and compliance. By participating, Vertex gains access to Oracle Expertise opportunities, further validating its capabilities and supporting ERP modernization efforts.
- May 2025 : Sovos joined the AWS ISV Accelerate Program, strengthening its global reach by co-selling its tax compliance solutions with AWS. The partnership enhances Sovos' ability to deliver secure, cloud-based tools for e-invoicing, VAT compliance, and regulatory reporting via AWS Marketplace. It streamlines procurement and helps enterprises reduce compliance risks while improving operational efficiency.
- April 2025 : Intuit announced a significant collaboration with Google Cloud at Cloud Next '25 to enhance TurboTax with generative AI. Using Google Cloud's Doc AI and Gemini models, Intuit expanded autofill capabilities for the 10 most common US tax forms, including complex 1099s and the 1040 series. The integration, powered by Intuit's GenOS platform, aims to save time and improve accuracy by automating tax data extraction and entry.
- April 2025 : Savant Labs formed a strategic alliance with Wolters Kluwer to integrate its Gen AI analytics automation platform with the CCH Integrator solution. The partnership focuses initially on Australia's financial services sector, automating GST compliance workflows, including ABN lookups and BAS reporting. This integration enhances accuracy, governance, and efficiency in indirect tax processes, driving smarter, AI-powered tax compliance for enterprises.
- April 2025 : H&R Block partnered with OpenAI to integrate generative AI into its tax services, enhancing real-time client support and personalization. The partnership builds on the launch of AI Tax Assist in 2023 and aims to empower over 60,000 tax professionals with advanced AI tools. The first integration phase will begin in 2025, with a full rollout planned for the 2026 tax season. Joint research will assess AI's impact on tax preparation for future innovation.
Table of Contents
 Exclusive indicates content/data unique to MarketsandMarkets and not available with any competitors.
Methodology
This research study on the tax management market involved extensive secondary sources, directories, IEEE Communication-Efficient: Algorithms and Systems, International Journal of Innovation and Technology Management, and paid databases. Primary sources were mainly industry experts from the core and related industries, preferred tax management software providers, third-party service providers, consulting service providers, end users, and other commercial enterprises. In-depth interviews with primary respondents, including key industry participants and subject matter experts, were conducted to obtain and verify critical qualitative and quantitative information and assess the market's prospects.
Secondary Research
In the secondary research process, various sources were referred to identify and collect information for this study. Secondary sources included annual reports, press releases, and investor presentations of companies; white papers, journals, and certified publications; and articles from recognized authors, directories, and databases. The data was also collected from other secondary sources, such as journals, government websites, blogs, and vendors' websites. Additionally, the tax management spending of various countries was extracted from the respective sources.
Primary Research
In the primary research process, various sources from the supply and demand sides were interviewed to obtain qualitative and quantitative information on the market. The primary sources from the supply side included various industry experts, such as Chief Experience Officers (CXOs), Vice Presidents (VPs), and directors specializing in business development, marketing, and tax management providers. It also included key executives from tax management vendors, system integrators (SIs), professional service providers, industry associations, and other key opinion leaders.

Note: Tier 1 companies' revenues are more than USD 10 billion; tier 2 companies' revenues range between
USD 1 and 10 billion; and tier 3 companies' revenues range between USD 500 million and USD 1 billion. Other designations include sales
managers, marketing managers, and product managers.
Source: Industry Experts
To know about the assumptions considered for the study, download the pdf brochure
Market Size Estimation
Multiple approaches were adopted to estimate and forecast the tax management market. The first approach involved estimating the market size by companies' revenue generated through the sale of tax management solutions.
Market Size Estimation Methodology: Top-down Approach
The top-down approach prepared an exhaustive list of all the vendors offering products in the tax management market. The revenue contribution of the market vendors was estimated through annual reports, press releases, funding, investor presentations, paid databases, and primary interviews. Each vendor's offerings were evaluated based on platform, degree of customization, type, application, end user, and region. The markets were triangulated through primary and secondary research. The primary procedure included extensive interviews for key insights from industry leaders, such as CIOs, CEOs, VPs, directors, and marketing executives. The market numbers were further triangulated with the existing MarketsandMarkets' repository for validation.
Market Size Estimation Methodology: Bottom-up Approach
The bottom-up approach identified the adoption rate of tax management solutions among different verticals in key countries, considering their regions contributing the most to the market share. The adoption of tax management solutions among enterprises and various use cases for their regions was identified and extrapolated for cross-validation. Use cases identified in other areas were weighted for the market size calculation.
Based on the market numbers, the regional split was determined by primary and secondary sources. The procedure included an analysis of the tax management market's regional penetration. Based on secondary research, the regional spending on Information and Communications Technology (ICT), socioeconomic Analysis of each country, strategic vendor analysis of major tax management solution providers, and organic and inorganic business development activities of regional and global players were estimated.
Tax Management Market : Top-Down and Bottom-Up Approach

Data Triangulation
After determining the overall market size using the market size estimation processes explained above, the market was split into several segments and subsegments. Where applicable, data triangulation and market breakup procedures were employed to complete the overall market engineering process and determine each market segment's and subsegment's exact statistics. The overall market size was then used in the top-down procedure to estimate the size of other individual markets via percentage splits of the market segmentation.
Market Definition
Tax management refers to the software solutions, platforms, and services ecosystem that enable organizations to automate, manage, and ensure compliance across direct and indirect tax functions. It includes tools for tax compliance & optimization, tax preparation & reporting, audit & risk management tools, tax analytics tools, document management & archiving, tax configuration & advisory services, and support & regulatory maintenance.
Stakeholders
- Tax software vendors
- Government & regulatory bodies
- Tax advisory firms
- Financial institutions & payment providers
- Tax policy advocacy organizations
- Digital payment platforms
- Legal firms
- ERP & accounting software providers
Report Objectives
- To define, describe, and forecast the tax management market based on offering - solutions (tax compliance & optimization, tax preparation & reporting, audit & risk management tools, tax, analytics tools, document management & archiving) and services (implementation & system integration, tax configuration & advisory services, support & regulatory maintenance), deployment mode (on-premises, cloud), organization size (large enterprises, small & medium sized enterprises), tax type (indirect tax, direct tax), vertical (BFSI, IT & telecom, manufacturing, retail & e-commerce, healthcare & life sciences, government & public sector, energy & utilities, and others), and region
- To forecast the market size of five major regional segments: North America, Europe, Asia Pacific, the Middle East & Africa, and Latin America
- To strategically analyze the market subsegments to individual growth trends, prospects, and contributions to the total market
- To provide detailed information on the significant factors influencing the market's growth (drivers, restraints, opportunities, and challenges)
- To strategically analyze macro and micro markets concerning growth trends, prospects, and their contributions to the overall market
- To analyze industry trends, patents, innovations, and pricing data related to the market
- To analyze the opportunities in the market for stakeholders and provide details of the competitive landscape for major players
- To analyze the impact of AI/generative AI on the market
- To profile key players in the market and comprehensively analyze their market share/ranking and core competencies
- To track and analyze competitive developments such as mergers & acquisitions, product launches, and partnerships & collaborations in the market
Available Customizations
With the given market data, MarketsandMarkets offers customizations to meet the company's needs. The following customization options are available for the report:
Product Analysis
- The product matrix provides a detailed comparison of each company's product portfolio.
Geographic Analysis as per Feasibility
- Further breakup of the North American tax management market
- Further breakup of the European tax management market
- Further breakup of the Asia Pacific tax management market
- Further breakup of the Middle East & African tax management market
- Further breakup of the Latin American tax management market
Company Information
- Detailed analysis and profiling of additional market players (up to five)
Key Questions Addressed by the Report
What is tax management?
Tax management refers to handling a business's or individual's tax obligations in a structured, compliant, and efficient manner. According to the Organisation for Economic Co-operation and Development (OECD), tax management encompasses the administration, calculation, filing, and strategic planning of tax liabilities following applicable laws. The Internal Revenue Service (IRS) defines it as the appropriate application of tax laws to ensure accurate reporting and timely payment of taxes.
What are the different deployment modes for tax management solutions?
Tax management solutions are deployed through two main models: on-premises and cloud. On-premises deployment offers complete control over infrastructure but requires higher capital investment and internal IT resources. Cloud deployment enables scalability, quicker updates, and lower maintenance, making it suitable for organizations with evolving compliance needs and distributed operations. Each model offers different benefits regarding flexibility, security, and cost efficiency.
What are the major factors driving the growth of the tax management industry?
The tax management industry is growing due to rising regulatory complexity, global expansion, and the demand for real-time compliance. Mandates such as e-invoicing and digital tax reporting drive the adoption of automated solutions. Cloud-based systems and AI integration further accelerate this shift. Businesses seek to reduce audit risks, improve accuracy, and ensure transparency across jurisdictions.
What challenges are hindering the widespread adoption of tax management services?
The widespread adoption of tax management services is limited by high implementation costs, challenges integrating with legacy systems, and varying tax regulations across jurisdictions. Many businesses also face issues related to data standardization, limited in-house expertise, and frequent regulatory changes. For small and mid-sized enterprises, concerns around cybersecurity, scalability, and return on investment further slow the shift toward automated tax platforms.
Who are the key vendors in the tax management market?
The key vendors in the global tax management market include Avalara (US), ADP (US), Intuit (US), Thomas Reuters (Canada), Wolter Kluwer (Netherlands), H&R Block (US), SAP (Germany), TaxBit (US), Xero (Australia), and Vertex (US).
Need a Tailored Report?
Customize this report to your needs
Get 10% FREE Customization
Customize This ReportPersonalize This Research
- Triangulate with your Own Data
- Get Data as per your Format and Definition
- Gain a Deeper Dive on a Specific Application, Geography, Customer or Competitor
- Any level of Personalization
Let Us Help You
- What are the Known and Unknown Adjacencies Impacting the Tax Management Market
- What will your New Revenue Sources be?
- Who will be your Top Customer; what will make them switch?
- Defend your Market Share or Win Competitors
- Get a Scorecard for Target Partners

Custom Market Research Services
We Will Customise The Research For You, In Case The Report Listed Above Does Not Meet With Your Requirements
Get 10% Free CustomisationTESTIMONIALS


Growth opportunities and latent adjacency in Tax Management Market