
Terminal Tractor Market Size, Share & Analysis

Terminal Tractor Market by Type (Manual, Automated), Drive (4x2, 4x4, 6x4), Tonnage (< 50 Tons, 50�100 Tons, > 100 Tons), Application (Marine, Airport, Oil & Gas, Warehouse), Battery Chemistry, Logistics, Propulsion, Motor Power Output, and Region - Global Forecast to 2032


OVERVIEW
Source: Secondary Research, Interviews with Experts, MarketsandMarkets Analysis
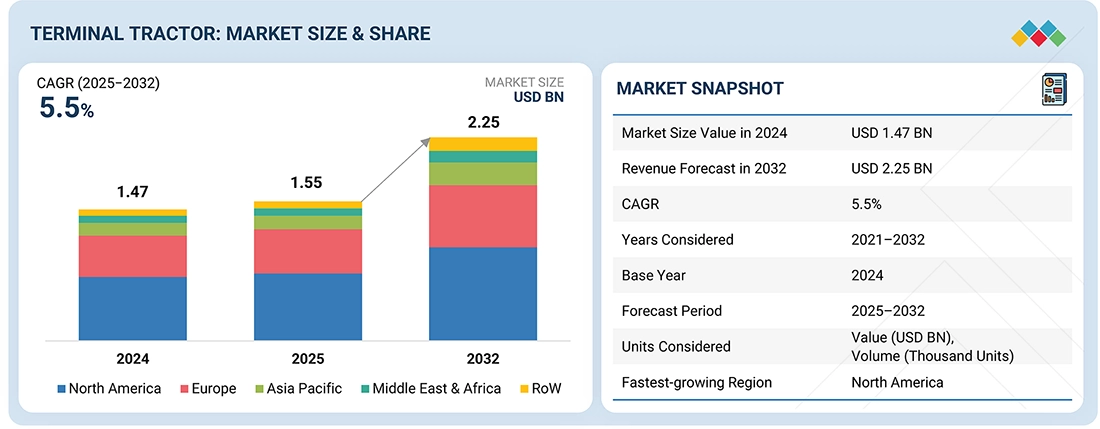
The global terminal tractor market size is projected to grow from USD 1.55 billion in 2025 to USD 2.25 billion by 2032, with a CAGR of 5.5%. Increased international trade, expansion of ports and distribution centers, booming e-commerce, and growing warehouses have raised goods movement volumes, boosting the demand for terminal tractors to ensure efficient cargo handling and quick turnaround. Furthermore, integrating automation and AI into terminal tractors enhances operational efficiency and safety, further driving the logistics and port operations market growth. However, high initial costs for electric and automated models, along with limited charging and servicing infrastructure, remain key challenges for adoption despite lifecycle savings. North America continues to be the largest market for terminal tractors, with Europe and the Asia Pacific region following.
Terminal Tractor Market Size and Forecast:
- Market Size Value in 2024: USD 1.47 Billion
- Market Size Value in 2025: USD 1.55 Billion
- Revenue Forecast in 2032: USD 2.25 Billion
- Growth Rate: CAGR of 5.5% from 2025 to 2032
- Data available from 2021 to 2032
- Base year: 2024
- Forecast period: 2025–2032
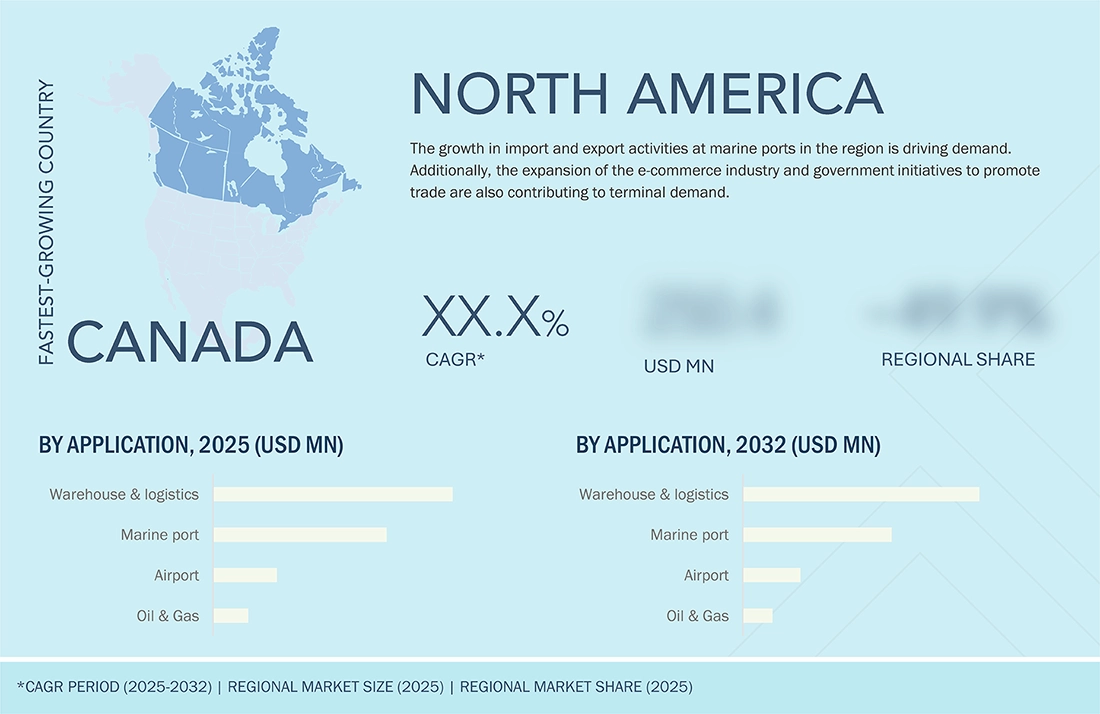
- Largest Growing Region: North America
- Units Considered: Value (USD Billion), Volume (Units)
Key Market Trends and Insights
- Market Growth: The terminal tractor market growth is driven by expanding port operations, rising e-commerce logistics, and increasing adoption of automated terminal tractors.
-
IoT Impact: IoT enables real-time fleet monitoring, predictive maintenance, and optimized yard operations.
- Growing Trends: The terminal tractor market is witnessing increased adoption of electric terminal tractors, automation, and AI-enabled logistics solutions.
- Growth Opportunities: The terminal tractor market opportunities are driven by smart port development, warehouse automation, and zero-emission terminal tractor deployment.
KEY TAKEAWAYS
-
BY DRIVE TYPEThe 4x2 segment dominates the terminal tractor market due to cost-effectiveness, low maintenance, and suitability for high-frequency logistics operations. Widely used across Asia Pacific, MEA, Europe, and North America, 4x2 models from OEMs like Kalmar and Terberg serve ports, warehouses, and intermodal hubs, making them the preferred choice for short-distance trailer movement on flat terrains.
-
BY TONNAGE CAPACITYTerminal tractors weighing 50–100 tons dominate the market thanks to their balance of load capacity and versatility in ports, rail, automotive, and retail logistics. Electric and autonomous models, like Gaussin’s APM 75T and Capacity’s TJ 9000, are gaining popularity, with North America leading the way because of e-commerce growth and automation trends.
-
BY TYPEManual terminal tractors lead the global market because they are affordable, reliable, and easy to deploy, despite increasing interest in automation. However, high costs and infrastructure needs are slowing the adoption of autonomous terminal tractors. Several OEMs, such as Kalmar, Terberg, TICO, SANY, and Capacity Trucks, are developing electric and semi-autonomous options alongside proven manual models.
-
BY APPLICATIONThe warehouse and logistics sector dominates the terminal tractor market, fueled by e-commerce, retail, cold storage, pharmaceuticals, and heavy industries. These tractors facilitate quick trailer movement, efficient handling of sensitive products, and smooth intra-yard transfers, reducing turnaround times and increasing yard productivity.
-
BY PROPULSIONDiesel terminal tractors will dominate the market by 2032, driven by high power, heavy-load capacity, and lower initial costs. Despite increasing interest in electrification, ports in North America and Europe still depend on diesel, with OEMs like Kalmar and Terberg developing cleaner, fuel-efficient models to meet stricter emission standards.
-
BY REGIONNorth America will dominate the terminal tractor market by 2032, fueled by major port expansions, growing e-commerce, and increased automation adoption. Ports such as Houston and Brunswick exemplify rising trade volumes, while OEMs like Orange EV, TICO, and Hyster-Yale are developing electric and hybrid models to achieve sustainability goals.
-
COMPETITIVE LANDSCAPEThe terminal tractor market includes major players like Kalmar (Finland), Konecranes (Finland), Terberg Special Vehicles (Netherlands), Linde Material Handling (Germany), and Capacity Trucks (US). Key strategies for these companies to sustain their leadership in the global terminal market are extensive networking, mergers and acquisitions, partnerships, new product development, and technological advancement.
The rising international trade, driven by the expansion of ports, distribution hubs, and the rapid growth of e-commerce, has significantly increased cargo movement volumes. This growing port, distribution hubs, and growth in the e-commerce industry are creating strong demand for terminal tractors as essential assets to ensure faster turnaround times and seamless cargo handling. The integration of automation and AI into terminal tractors is further transforming operations—delivering higher efficiency, predictive safety, and reduced downtime—which positions them as important equipment for next-generation logistics infrastructure. North America leads the global terminal tractor market, owing to advanced port infrastructure and early adoption of smart technologies.
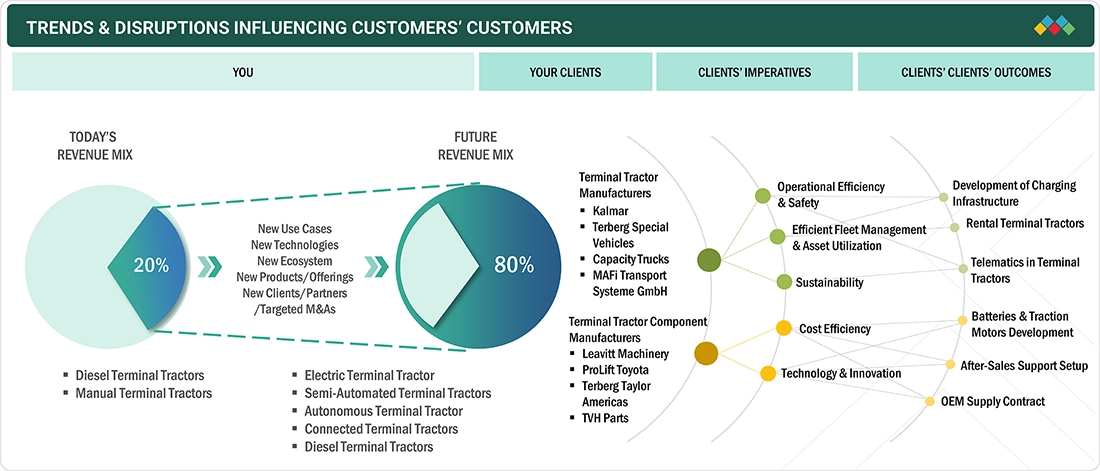
TRENDS & DISRUPTIONS IMPACTING CUSTOMERS' CUSTOMERS
The terminal tractor market is moving from traditional diesel and manual models to advanced electric, semi-automated, and autonomous solutions. New use cases, ecosystem partnerships, and product innovations will boost revenue growth. This shift highlights efficiency, sustainability, and technology-led operations, positioning manufacturers and suppliers as key enablers of next-generation fleet performance and customer value.
Source: Secondary Research, Interviews with Experts, MarketsandMarkets Analysis
MARKET DYNAMICS
Level
-
Increase in port traffic

-
Increase in rail freight transportation

Level
-
High initial investment cost

-
Limited charging infrastructure for electric terminal tractors

Level
-
Strong inclination toward electric terminal tractors

-
Developments in Automated Terminal Tractor with Electric Propulsion.

Level
-
Lack of synchronization with other port equipment

Source: Secondary Research, Interviews with Experts, MarketsandMarkets Analysis
Driver: Increase in rail freight transportation
The increase in global trade and rail freight volumes drives strong demand for terminal tractors at ports, rail yards, and logistics hubs. In 2023, China-Europe freight trains made 17,000 trips, transporting 1.9 million TEUs with double-digit growth. New routes to Central Asia and cross-border railways with Mongolia and Uzbekistan further enhance connectivity. India is also experiencing growth, with Indian Railways handling approximately 1617 million tons of freight in FY 2024-25, up 1.68% year-over-year. These developments underscore the growing importance of high-performance terminal tractors in efficiently managing rail-road cargo flows, reinforcing their role in modern freight transportation infrastructure.
Restraint: Limited charging infrastructure for electric terminal tractors
Despite the growing interest in green alternatives, transitioning to electric terminal trucks presents financial and logistical challenges. In addition to the cost of the terminal tractors themselves, operators must invest in high-capacity charging infrastructure, upgrade the power grid, and coordinate with utility suppliers. These factors both increase costs and extend the timeline for shifting to an all-electric fleet. Moreover, charging times for electric terminal tractors tend to be lengthy, and their battery range can be limited. These issues create inefficiencies in busy areas like ports and logistics hubs and restrict the use of electric terminal trucks in larger yards. Consequently, these challenges hinder the adoption of electric terminal trucks in markets where the total cost of ownership is a significant concern. However, advancements such as fast-charging networks and improved battery technology are gradually overcoming these barriers, facilitating better adoption of electric terminal trucks.
Opportunity: Developments in automated terminal tractor technology
Terminal tractors, with a 10,000–20,000-hour lifespan, are rapidly advancing through automation, which enhances safety, efficiency, and real-time monitoring. Leading OEMs like Kalmar and Terberg are developing autonomous models—Kalmar’s Ottawa AutoTT integrates automation platforms for complex environments, while Terberg has tested driverless tractors with EasyMile in the Netherlands. Full production of these autonomous units is anticipated by 2026, marking a significant industry milestone. Meanwhile, ports are speeding up electrification to reduce emissions, improve air quality, and lower costs. Recent pilots include Westwell’s electric fleet at the Port of Felixstowe (2024) and Terberg–Embotech’s 30-unit rollout at APM Terminals Maasvlakte II (2025). These advances highlight a strong shift toward autonomous, electric, and sustainable terminal tractors, transforming global port operations and logistics efficiency.
Challenge: Lack of synchronization with other port equipment
Automating terminal tractors is crucial for managing increasing container volumes safely and efficiently. However, diverse fleets and equipment from different manufacturers pose integration challenges because of incompatible control systems and protocols. This results in workflow misalignment, idle time, and higher operational costs. Smaller ports are particularly affected by limited digital infrastructure and smart yard systems. To fully unlock automation benefits, standard communication protocols, integrated yard and fleet platforms, and collaboration among manufacturers are essential. Addressing these gaps will enhance port productivity, reliability, and cost efficiency.
Terminal Tractor Market: COMMERCIAL USE CASES ACROSS INDUSTRIES
| COMPANY | USE CASE DESCRIPTION | BENEFITS |
|---|---|---|
 |
Deployment of 100 autonomous electric terminal tractors, supported by advanced navigation systems and upgraded charging infrastructure | Enhances operational efficiency, ensures precise and safe container handling, and supports sustainability by reducing carbon emissions through renewable energy and advanced infrastructure. |
 |
Replace diesel-powered terminal trucks with electric alternatives | The use of electric terminal trucks enhanced efficiency and significantly cut emissions at the waste transfer station. This approach also reduced ownership costs and supported sustainability goals with incentive utilization and continuous performance tracking |
Logos and trademarks shown above are the property of their respective owners. Their use here is for informational and illustrative purposes only.
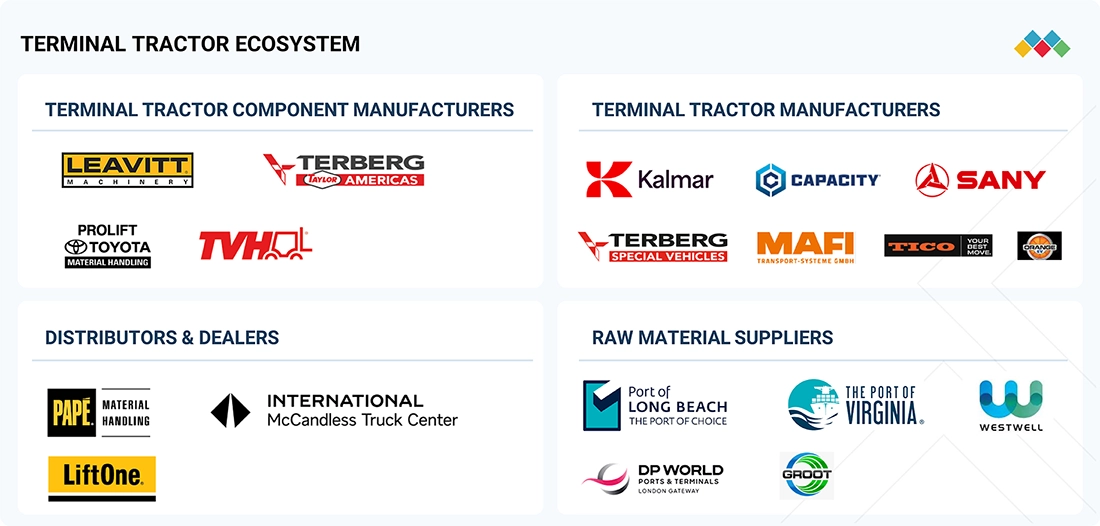
MARKET ECOSYSTEM
The ecosystem analysis explores the connections and interdependence within a complex system. It can be applied across various fields. An ecosystem analysis of the terminal tractor market provides a comprehensive overview of the interconnected stakeholders, technologies, and market forces that shape the industry's growth. This highlights key players in the terminal tractor market ecosystem, including component suppliers, OEMs, distributors, end users, and regulatory agencies.
Logos and trademarks shown above are the property of their respective owners. Their use here is for informational and illustrative purposes only.
MARKET SEGMENTS
Source: Secondary Research, Interviews with Experts, MarketsandMarkets Analysis
Terminal Tractor Market, By Application
The warehouse & logistics sector dominates the terminal tractor market because of its wide range of uses. In e-commerce and retail, terminal tractors facilitate quick trailer movement for high-volume fulfillment and distribution. In cold storage and food and beverage, they guarantee timely handling of temperature-sensitive goods to reduce spoilage while supporting the safe transportation of medical supplies under strict standards. For automotive and heavy industries, they simplify intra-yard transfers of large parts and finished products. These functions improve internal logistics, decrease turnaround times, and increase yard efficiency. As shipment volumes grow and automation advances, the need for versatile, high-performance terminal tractors is expected to increase rapidly.
Terminal Tractor Market, By Type
The manual segment continues to lead the terminal tractor market because of its affordability, reliability, and ease of deployment in ports, warehouses, and distribution centers. Unlike automated models, manual tractors need minimal infrastructure, making them a cost-effective choice for operators. In 2024, they held the largest market share, with OEMs like Kalmar, Terberg, TICO, SANY, and Capacity Trucks offering extensive manual options. High costs and complexity slow down large-scale automation adoption, keeping manual models relevant. While OEMs are developing electric and semi-autonomous solutions, including Terberg’s RT253EV 4x4 RoRo prototype and Kalmar’s OT2 EV, manual tractors remain the backbone of global logistics operations.
Terminal Tractor Market, By Drive Type
The 4x2 segment is expected to hold the largest share of the terminal tractor market because of its affordability, operational effectiveness, and versatility in logistics applications. By 2024, over 80% of terminal tractors in Asia Pacific, MEA, and RoW are 4x2 models. Leading OEMs like Kalmar and Terberg provide 4x2 tractors with high capacity and advanced electric systems for warehousing, distribution, and intermodal handling. The simpler drivetrain reduces purchase and maintenance costs, making it ideal for high-demand operations in busy ports and logistics centers. In Europe and North America, 4x2 tractors are dominant due to their suitability for flat terrain, lower total ownership costs, and widespread use in logistics and intermodal hubs.
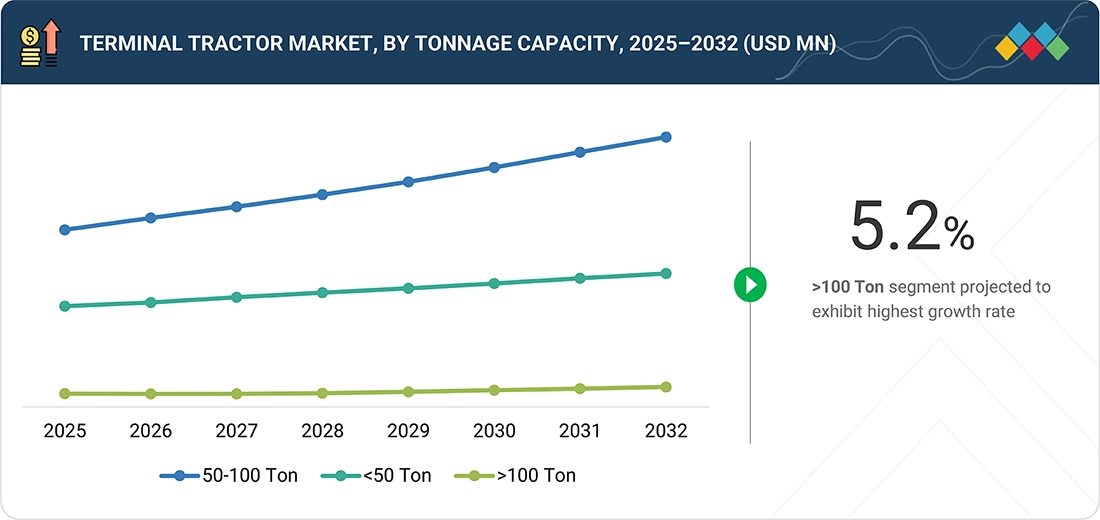
Terminal Tractor Market, By Tonnage Capacity
Terminal tractors in the 50–100-ton range are the most popular due to their balance of load capacity and operational versatility. They are widely used for single-laden container handling, with electric and autonomous variants, like Gaussin’s APM 75T, gaining traction. North America leads this segment, driven by e-commerce, large distribution centers, and automation adoption. Industries such as shipping, ports, rail freight, automotive, and retail rely on these tractors for high-volume operations. Models like Capacity Trucks’ TJ 9000 offer high-capacity hauling with better maneuverability than heavier tractors, fitting well within existing terminal layouts.
Terminal Tractor Market, By Propulsion
The diesel segment is expected to hold the largest share of the global terminal tractor market by 2032 due to its high power, heavy-load capability, and lower initial costs. It remains the preferred choice for small to mid-sized North American and European ports with extensive cargo handling needs. Growing emission regulations push manufacturers toward cleaner diesel technologies, such as Kalmar’s Eco Heavy Terminal Tractor and Terberg’s Stage V/Tier 4 compliant models. Despite the rise of electric variants, diesel tractors continue to offer robust performance, cost-efficiency, and benefit from established infrastructure, ensuring their long-term relevance.
Electric Terminal Tractor Market, By Battery Chemistry
NMC batteries hold the largest share in the global electric terminal tractor market. The increased demand for NMC batteries is mainly due to their higher energy storage capacity and strong power output. Nickel manganese cobalt (NMC) battery chemistry continues to lead the market in North America and Europe. Key industry players such as Kalmar, Terberg, and Konecranes are actively adopting NMC battery systems in their terminal tractor offerings, which aligns with this trend. For example, in February 2025, Terberg Benschop introduced an upgraded electric terminal tractor model for European ports featuring advanced NMC battery packs designed for high-duty cycles and fast recharging.
Electric Terminal Tractor Market, By Power Output
The >250 kW segment is expected to grow the most, driven by heavy-duty logistics, port operations, and industrial applications. These high-power electric terminal tractors handle oversized containers, multi-trailer configurations, and dense cargo while providing instant torque similar to diesel models. Demand is strongest in North America due to large ports and high material volumes. Leading OEMs like SANY and MAFI offer models exceeding 250 kW, such as the MAFI T230e with 300 kW and around 40-ton capacity, and the SANY SM4256 with a 280-kW electric motor and 4x2 drive.
REGION
North America is expected to be the largest region in the global Terminal Tractor market during the forecast period.
North America is leading the global terminal tractor market during the forecast period, with the US holding the largest share, followed by Canada and Mexico. Major investments in port infrastructure, e-commerce expansion, and automation adoption drive growth. Key ports like Houston and Brunswick are increasing capacity, boosting demand for efficient cargo handling solutions. The rise of online shopping further accelerates the need for fast intra-yard logistics. Technological advancements, including AI and automation, improve efficiency through autonomous navigation, predictive maintenance, and optimized routing. Leading OEMs like Orange EV, TICO, and Hyster-Yale are expanding electric and hybrid terminal tractor offerings to meet sustainability goals. Supportive government policies and a focus on zero-emission solutions reinforce North America’s market dominance.
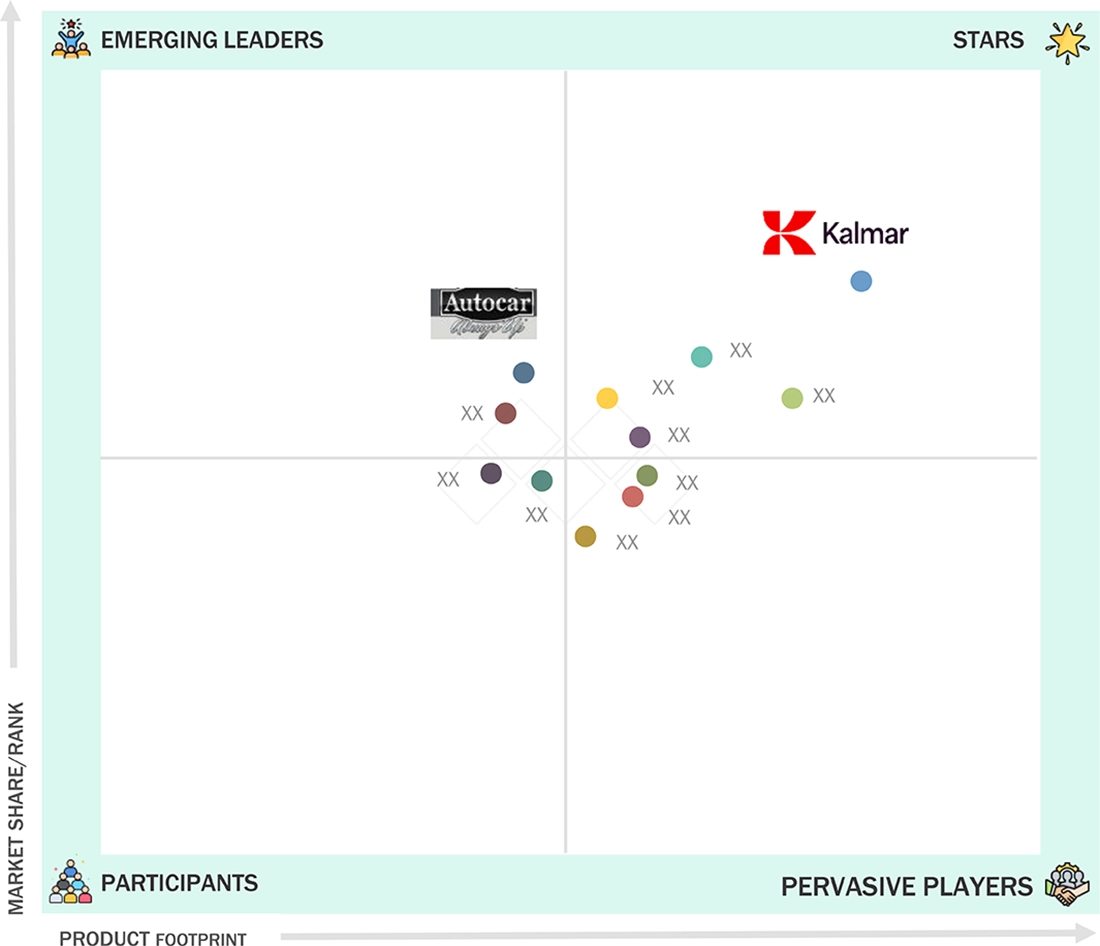
Terminal Tractor Market: COMPANY EVALUATION MATRIX
The figure shows the competitive landscape of the global terminal tractor market, positioning key players based on their market share and product footprint. In the market matrix, Kalmar (Finland) (Star) leads with a strong market presence, a wide product portfolio, and innovation in R&D in 2024 that improves its position in the market. Autocars, LLC (US) (Emerging Leader) is gaining traction by securing supply contracts from companies such as Walmart (US) and Lazer Logistics (US) to deliver its electric terminal tractor E-ACTT and meet emission targets.
Source: Secondary Research, Interviews with Experts, MarketsandMarkets Analysis
KEY MARKET PLAYERS
MARKET SCOPE
| REPORT METRIC | DETAILS |
|---|---|
| Market Size Value in 2024 | USD 1.47 Billion |
| Revenue Forecast in 2032 | USD 2.55 Billion |
| Growth Rate | 5.5% |
| Years Considered | 2021 – 2032 |
| Base Year | 2024 |
| Forecast Period | 2032 |
| Units Considered | USD Million/Billion, Thousand Units |
| Report Coverage | Revenue forecast, Global Market Shares, Competitive Landscape, Driving factors, Trends & Disruption, OEM Analysis, Others |
| Segments Covered |
|
| Regional Scope | Asia Pacific, Europe, North America, Middle East & Africa, Rest of the World |
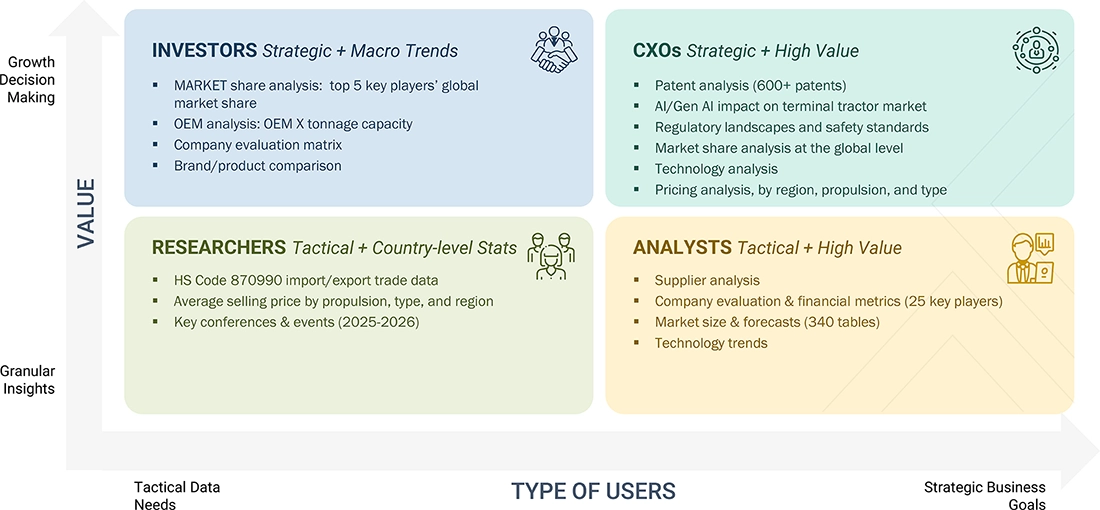
WHAT IS IN IT FOR YOU: Terminal Tractor Market REPORT CONTENT GUIDE
DELIVERED CUSTOMIZATIONS
We have successfully delivered the following deep-dive customizations:
| CLIENT REQUEST | CUSTOMIZATION DELIVERED | VALUE ADDS |
|---|---|---|
| Leading Terminal Tractor OEM | Provided the historic and forecast sales of the terminal tractor vs. body carries at the country level in terms of volume and value | Country-level adoption of terminal vs. body carriers identified |
| Split between Terminal Tractor Vs. Body Carriers for European Major Countries | Identified industry-wise application of body carriers and terminal tractors |
RECENT DEVELOPMENTS
- May 2025 : Two electric Terberg YT203-EV terminal tractors from N.C. Nielsen became operational at Horsens, Denmark's massive DSV logistics center. This series was designed for internal transport in busy terminals, central warehouses, and distribution centers.
- April 2025 : American Battery Solutions partnered with TICO to provide its Proliance Intelligent Battery Series 700-volt lithium-ion batteries to power TICO’s Pro-Spotter Electric terminal tractors.
- December 2024 : Terberg Special Vehicles partnered with MBA AG to provide tractor service in Switzerland. MBA AG is a VRP SA subsidiary based in Boussens near Lausanne.
- April 2024 : Konecranes acquired the business of German crane and service supplier Kocks Kranbau, giving it access to new European and global customers.
- March 2024 : Kalmar announced a strategic partnership with Forterra to develop its first fully autonomous terminal tractor. The autonomous terminal tractor is being tested extensively and will be piloted live at customer sites in 2025. The Kalmar Ottawa T2 AutoTT will be available in 2026, followed by the Ottawa T2EV AutoTT and Kalmar T2EV AutoTT.
- January 2024 : APM Terminals Maasvlakte II signed a cooperation contract with Embotech and Terberg to purchase and implement 30 automated terminal tractors.
Table of Contents
 Exclusive indicates content/data unique to MarketsandMarkets and not available with any competitors.
Methodology
The study involves four main activities to estimate the current size of the terminal tractor market. Exhaustive secondary research was done to collect market information. This included studying the market based on application, drive, type, tonnage, propulsion, logistics by industry, electric terminal tractor by battery chemistry, and region. The next step was to validate these findings, assumptions, and market analysis with industry experts across value chains through primary research. Bottom-up and top-down approaches were employed to estimate the complete market size for different segments considered in this study. Thereafter, market breakdown and data triangulation processes were used to estimate the market size of segments and subsegments.
Secondary Research
Secondary sources referred to in this research study included the Port Equipment Manufacturers Association (PEMA), Tractor and Mechanization Association, Container Dealers Association (CDA), and Container Owners Association (COA); corporate filings (such as annual reports, investor presentations, and financial statements); and trade, business, and terminal tractor associations. The secondary data was collected and analyzed to determine the overall market size, which was further validated by primary research.
Primary Research
Extensive primary research was conducted after understanding the terminal tractor market scenario through secondary research. Several primary interviews were conducted with market experts from terminal tractor providers, component/system providers, and end-user organizations across three major regions: North America, Europe, and Asia Pacific. Approximately 75% of the primary interviews were conducted from the terminal tractor providers and component/system providers and 25% from the end-user organizations. Primary data was collected through questionnaires, emails, and telephonic interviews. Various departments within organizations, including sales, operations, and administration, were contacted to provide a holistic viewpoint in the report while canvassing primaries.

Note: Tiers of companies are based on the supply chain of the terminal tractor market;
companies’ revenues have not been considered.
To know about the assumptions considered for the study, download the pdf brochure
Market Size Estimation
Both top-down and bottom-up approaches were used to estimate and validate the total size of the terminal tractor market. These methods were also used extensively to estimate the size of various subsegments in the market.
The research methodology used to estimate the market size included the following approaches:
Market Size Estimation Methodology- Top-down approach
The top-down approach was used to estimate and validate the market, by propulsion, in terms of volume and value. The terminal tractor market volume (units) and value (USD million) by region (Asia Pacific, North America, Middle East & Africa, Europe, and Rest of the World) were derived from the global market. The penetration of each propulsion (diesel, electric, and CNG/LNG) at the regional level was derived from secondary sources and validated through primaries. The penetration of each propulsion (diesel, electric, and CNG/LNG) was multiplied by the regional market to get the market volume (units) and value (USD million) for each region. All region-wise markets were summated to derive the total market volume (units) and value (USD million).
Market Size Estimation Methodology-Bottom-up approach
The terminal tractor market was estimated using a bottom-up approach, starting with the annual sales volume (units) of terminal tractors at the country level. Application-wise penetration (airport, marine port, oil & gas, and warehouse & logistics) was determined for each country using secondary sources and validated through primary research. These penetration rates were applied to the total country-level sales to calculate the application-wise volume. The market value was derived by multiplying this volume with the average terminal tractor price (USD million), which was also sourced from secondary research and validated through primaries. Country-level market values were aggregated to estimate regional markets, which were then summed to obtain the global market size. The sales forecast by terminal tractor is driven by factors, including country-wise macroeconomic indicators, growth in the logistics and transportation industry, GDP growth, expansion of the e-commerce industry, infrastructure development trends (port, airport, logistics hub expansions), and government infrastructure spending.
Terminal Tractor Market : Top-Down and Bottom-Up Approach

Data Triangulation
After arriving at the overall size of the terminal tractor market through the above-mentioned methodology, the market was split into several segments and subsegments. The data triangulation and market breakdown procedures were employed, wherever applicable, to complete the overall market engineering process and arrive at the exact data of the market by volume and value for the key segments and subsegments. The extrapolated market data was triangulated by studying various macro indicators and regional trends from both the supply and demand sides.
Market Definition
A terminal tractor is a type of tractor intended to move semitrailers and containers in cargo yards, warehouse facilities, intermodal facilities, railway yards, airports, and other heavy industries. It has a short wheelbase with space to accommodate a single person. A terminal tractor provides the driver a 360-degree view from inside the vehicle.
Stakeholders
- Battery Manufacturers
- Container Handling Equipment Traders and Distributors
- Dealers and Distributors
- Fleet Operators
- Global Industrial Vehicle and Container Handling Associations
- Government and Regulatory Authorities
- Industrial Vehicle Manufacturers
- Material Handling Associations
- Material Handling Equipment Manufacturers
- Port Equipment Manufacturers
- Port Operators
- Raw Material Suppliers
- Research and Consulting Associations
- Regional Vehicle Emission Regulatory Authorities
- Technology Companies
- Terminal Tractor Manufacturers
- Tier 1 Component/System Manufacturers
Report Objectives
-
To define, describe, and forecast the size of the terminal tractor market, in terms of volume and value, for the following categories:
- By Application (Warehouse & Logistics, Marine Port, Airport, Oil & Gas)
- By Drive (4x2, 4x4, 6x4)
- By Type (Manual, Automated)
- By tonnage (< 50 Tons, 50–100 Tons, > 100 Tons)
- By Propulsion (Diesel, Electric, Hydrogen, CNG/LNG)
- Logistics, By Industry (Retail, Food & Beverages, Inland Waterways & Marine Service, Rail Logistics, RoRo)
- Electric Terminal Tractor Market, By Battery Chemistry (LFP, NMC, Others)
- Electric Terminal Tractor Market, By Motor Power Output (< 150 kW, 150–250 kW, > 250 kW)
- By Region (Asia Pacific, North America, Middle East & Africa [MEA], Europe, Rest of the World [RoW])
- Hydrogen Technologies in Terminal Tractor (Qualitative Chapter)
- To understand the dynamics (Drivers, Restraints, Opportunities, and Challenges) of the market
- To analyze the market share analysis/ranking of key players operating in the terminal tractor market.
- To study the market with supply chain analysis, ecosystem analysis, trade analysis, case study analysis, pricing analysis, patent analysis, trends/disruptions impacting buyers, technology analysis, regulatory analysis
- To analyze the competitive landscape, prepare a company evaluation matrix for the players operating in the global market, evaluate the share/ranking based on product footprints of leading market players, and position them on the 2x2 quadrant.
- To analyze the competitive landscape of SMEs in the terminal tractor market, evaluate them based on product footprint, and position them on a 2x2 quadrant.
- To analyze the recent developments, including product launches, deals, expansions, and other developments, carried out by the key participants in the market.
- To strategically analyze the competitive evaluation matrix for terminal tractor manufacturers and electric terminal tractor manufacturers
- To study the OEM Analysis (Battery Capacity VS. Power Output and Tonnage VS. Power Output)
- To analyze recent developments, including supply contracts, product launches, expansion, and other activities undertaken by key industry participants in the market
Available Customizations
Along with the given market data, MarketsandMarkets offers customizations in accordance with a company’s specific needs. The following customization options are available:
Terminal Tractor Market, By Propulsion & Country
- Detailed Analysis And Profiling Of Additional Market Players (Up To 5)
Key Questions Addressed by the Report
What is the current size of the global terminal tractor market?
The global terminal tractor market is valued at USD 1.55 billion in 2025 and is expected to reach USD 2.25 billion by 2032, at a CAGR of 5.5%.
Which application is estimated to dominate the terminal tractor market in 2025?
The warehouse & logistics segment is estimated to drive the demand for terminal tractors in 2025.
Who are the leading companies in the terminal tractor market, and what strategies have they implemented?
Key players in the terminal tractor market include Kalmar (Finland), Terberg Special Vehicles (Netherlands), Capacity Trucks (US), MAFI Transport-Systeme GmbH (Germany), and TICO Tractors (US). These companies focus on product launches and securing supply contracts to enhance their market presence.
How does the demand for terminal tractors differ by region?
North America is projected to be the largest market for terminal tractors during the forecast period, with Europe following. The growing e-commerce industry and demand for sustainable and cost-efficient terminal tractors primarily drive the market growth in North America.
What are the growth opportunities for suppliers in the terminal tractor industry?
The rising demand for electric and automated terminal tractors is expected to create significant growth opportunities for suppliers in the terminal tractor market.
Need a Tailored Report?
Customize this report to your needs
Get 10% FREE Customization
Customize This ReportPersonalize This Research
- Triangulate with your Own Data
- Get Data as per your Format and Definition
- Gain a Deeper Dive on a Specific Application, Geography, Customer or Competitor
- Any level of Personalization
Let Us Help You
- What are the Known and Unknown Adjacencies Impacting the Terminal Tractor Market
- What will your New Revenue Sources be?
- Who will be your Top Customer; what will make them switch?
- Defend your Market Share or Win Competitors
- Get a Scorecard for Target Partners

Custom Market Research Services
We Will Customise The Research For You, In Case The Report Listed Above Does Not Meet With Your Requirements
Get 10% Free CustomisationTESTIMONIALS

JIM NAAS
PRODUCT DIRECTOR, WEASLER
Weasler Engineering, a CentroMotion organization
Global Provider of Industrial Actuation & Control Solutionswww.weasler.com
Our organization was interested in learning more about the attractiveness of a particular market space. We contacted MarketsandMarkets to help us based on previous positive experiences we had with them. The results did not disappoint! We discussed our objectives with them, and the team at MarketsandMarkets developed and executed a proposal that met our needs precisely. We were very impressed by their level of expertise, the quality of the analysis and their insightful recommendations. We would not hesitate in working with them again in the future.

Matt Kardel,
Vice President
Aptiv,
A global technology company that develops safer, greener and more connected solutions.www.aptiv.com
We contracted with
MarketsandMarkets to evaluate the value chain and potential go-to-market partners related to our
interest in the Fleet Management space. The team successfully completed the work on time and at the
pricing agreed. MarketsandMarkets listened and understood our objectives and collaborated well with
us to help us get the visibility we needed to make an investment.
We have subsequently used
MarketsandMarkets again related to Smart Cities to good results.


Growth opportunities and latent adjacency in Terminal Tractor Market