The study involves two major activities in estimating the current market size for the UV-curable resins market. Exhaustive secondary research was done to collect information on the market, peer market, and parent market. The next step was to validate these findings, assumptions, and sizing with industry experts across the value chain through primary research. Both top-down and bottom-up approaches were employed to estimate the complete market size. After that, market breakdown and data triangulation were used to estimate the market size of segments and subsegments.
Secondary Research
Secondary sources referred to for this research study include financial statements of companies offering UV-curable resins and information from various trade, business, and professional associations. Secondary research has been used to obtain critical information about the industry’s value chain, the total pool of key players, market classification, and segmentation according to industry trends to the bottom-most level and regional markets. The secondary data was collected and analyzed to arrive at the overall size of the UV-curable resins market, which was validated by primary respondents.
Primary Research
Extensive primary research was conducted after obtaining information regarding the UV-curable resins market scenario through secondary research. Several primary interviews were conducted with market experts from both the demand and supply sides across major countries of North America, Europe, Asia Pacific, the Middle East & Africa, and South America. Primary data was collected through questionnaires, emails, and telephonic interviews. The primary sources from the supply side included various industry experts, such as Chief X Officers (CXOs), Vice Presidents (VPs), Directors from business development, marketing, product development/innovation teams, and related key executives from UV-curable resins industry vendors; system integrators; component providers; distributors; and key opinion leaders. Primary interviews were conducted to gather insights such as market statistics, data on revenue collected from the products and services, market breakdowns, market size estimations, market forecasting, and data triangulation. Primary research also helped in understanding the various trends related to type, storage & distribution and transportation, manufacturing process, function, end-use industry, and region. Stakeholders from the demand side, such as CIOs, CTOs, CSOs, and installation teams of the customer/end users who are using UV-curable resins, were interviewed to understand the buyer’s perspective on the suppliers, products, component providers, and their current usage of UV-curable resins and future outlook of their business which will affect the overall market.
The Breakup of Primary Research:

To know about the assumptions considered for the study, download the pdf brochure
Market Size Estimation
The research methodology used to estimate the size of the UV-curable resins market includes the following details. The market sizing of the market was undertaken from the demand side. The market was upsized based on procurements and modernizations in UV-curable resins in different end-use industries at a regional level. Such procurements provide information on the demand aspects of the UV-curable resins industry for each application. For each application, all possible segments of the UV-curable resins market were integrated and mapped.
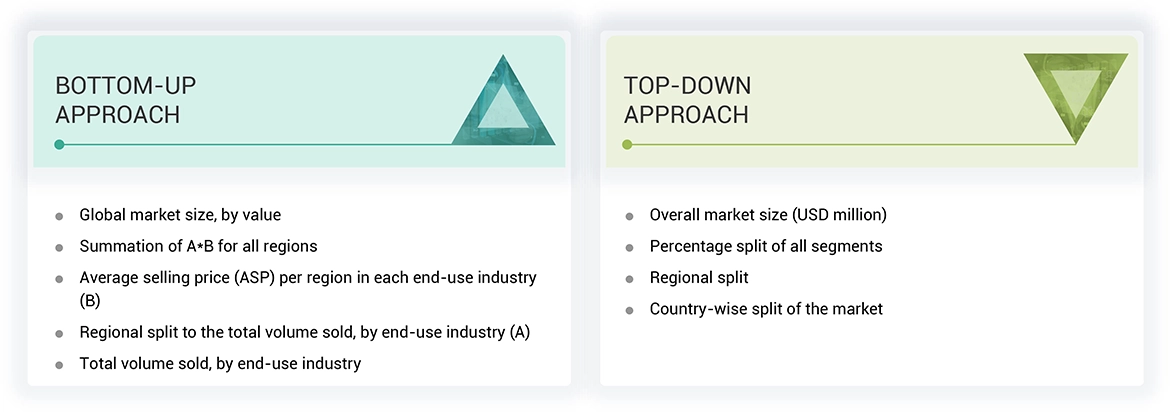
Data Triangulation
After arriving at the overall size from the market size estimation process explained above, the total market was split into several segments and subsegments. The data triangulation and market breakdown procedures explained below were implemented, wherever applicable, to complete the overall market engineering process and arrive at the exact statistics for various market segments and subsegments. The data was triangulated by studying various factors and trends from the demand and supply sides. Along with this, the market size was validated using both the top-down and bottom-up approaches.
Market Definition
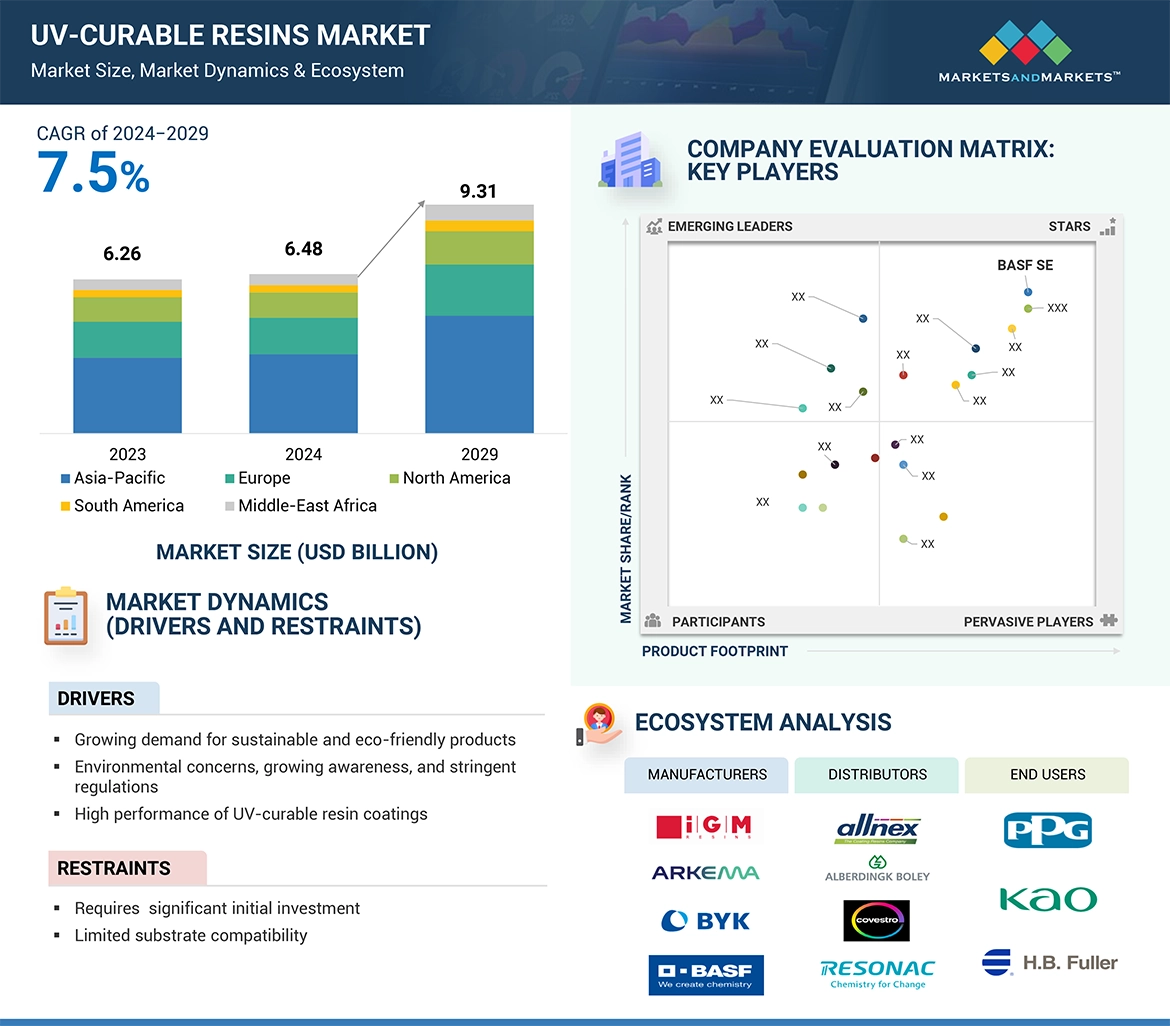
UV-curable formulated products primarily include coatings, inks, and adhesives. These products are composed of a base resin (oligomers) formulated with monomers, additives, and photoinitiators. Oligomers have moderately low molecular weight and impart most of the basic properties to the UV curing formulations. Reactive monomers are primarily used in a formulation as reactive diluents and crosslinking agents to modify the properties of oligomers. The UV curing process describes the use of UV or visible light to polymerize a combination of oligomers and monomers onto a substrate. Subsequently, the UV material resins can be formulated into coatings, printing inks, adhesives, or other products. The process is also called radiation curing, as UV light is used as a radiant energy source. Energy sources that are typically used for UV cure include pulsed xenon lamps, medium medium-pressure mercury lamps, light-emitting diodes (LEDs), and lasers.
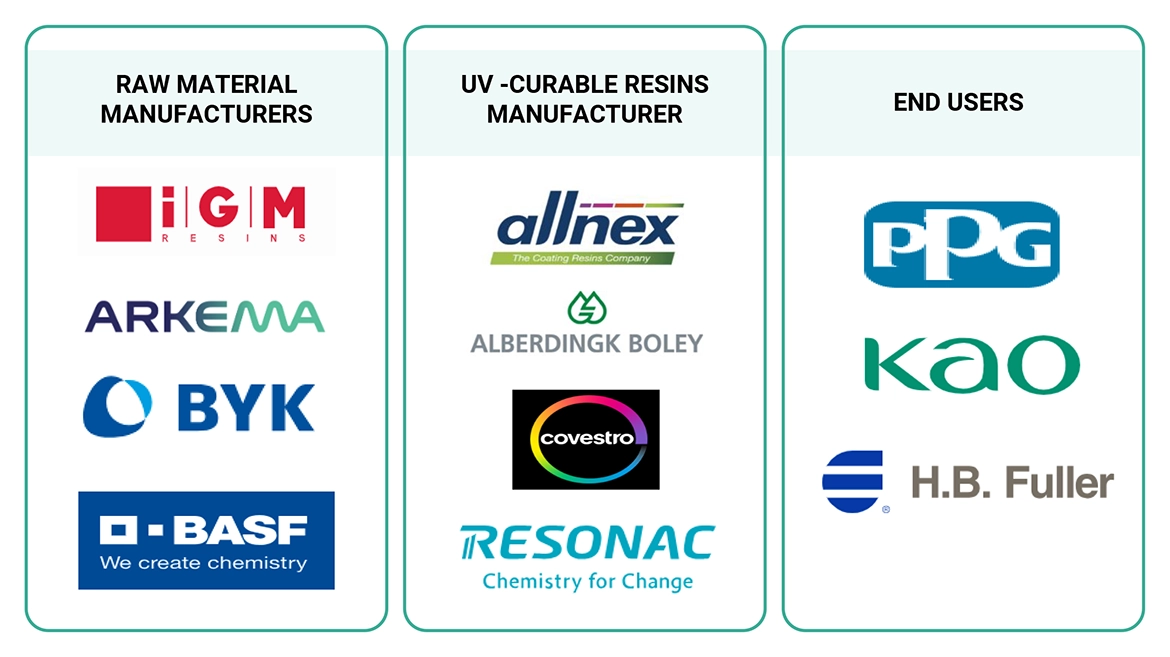
Stakeholders
-
Manufacturers of radiation-curable coatings
-
Manufacturers of resins, additives, pigments, and other feedstock chemicals
-
Manufacturers of industrial coatings, overprint varnishes, adhesives, printing inks, and 3D printing
-
Traders, distributors, and suppliers of radiation-curable coatings
-
Regional manufacturer associations and general radiation curable associations
-
Government and regional agencies and research organizations
Report Objectives
-
To define, describe, and forecast the UV-curable resins market size in terms of volume and value
-
To provide detailed information regarding the key factors, such as drivers, restraints, opportunities, and challenges influencing market growth
-
To analyze and project the global UV-curable resins market by composition, chemistry, technology, application, end-use industry, and region
-
To forecast the market size concerning five main regions (along with country-level data), namely, North America, Europe, Asia Pacific, South America, and the Middle East & Africa, and analyze the significant region-specific trends
-
To strategically analyze micro markets with respect to individual growth trends, prospects, and contributions of the submarkets to the overall market
-
To analyze the market opportunities and the competitive landscape for stakeholders and market leaders
-
To assess recent market developments and competitive strategies, such as agreements, contracts, acquisitions, and new product developments/new product launches, to draw the competitive landscape
-
To strategically profile the key market players and comprehensively analyze their core competencies


 HIGHEST CAGR MARKET IN 2024-2029
 ASIA PACIFIC FASTEST GROWING MARKET IN THE REGION
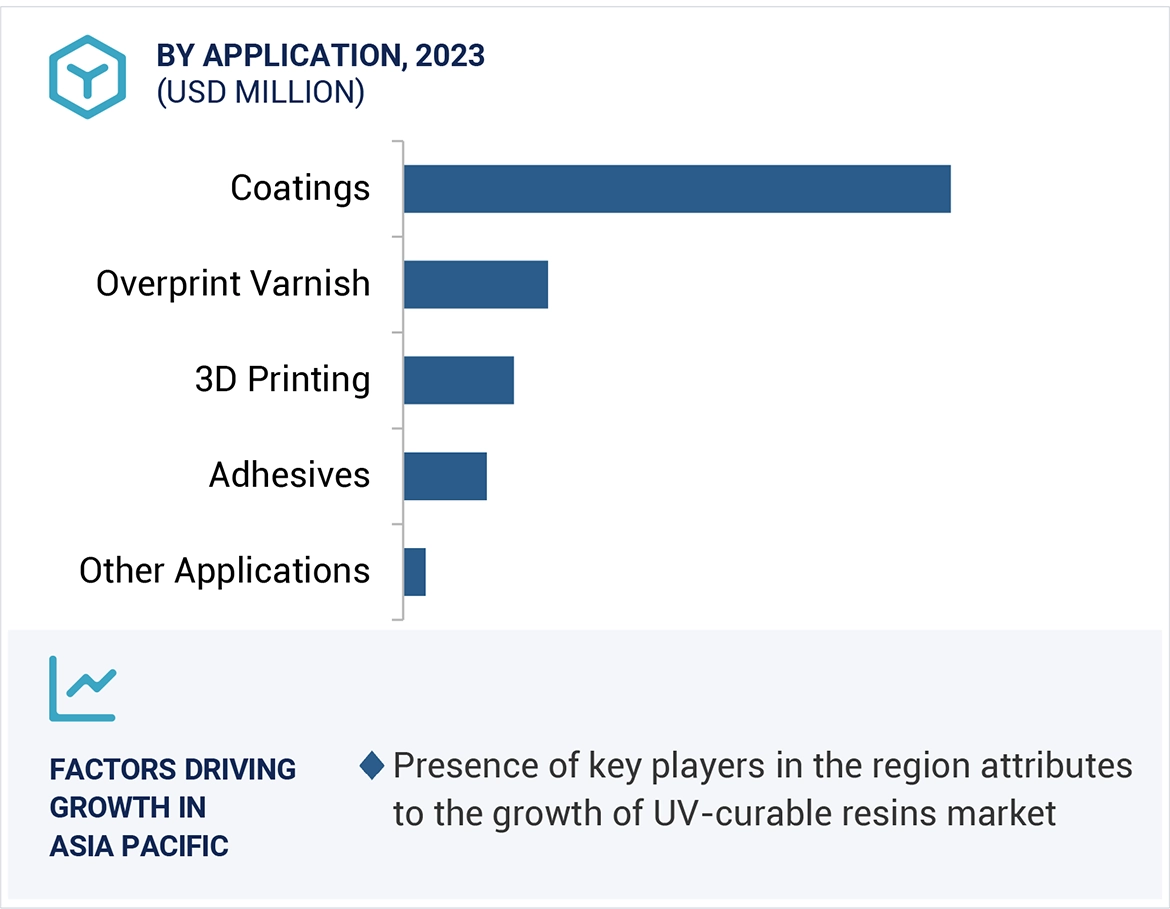


Growth opportunities and latent adjacency in UV-Curable Resins Market