Wire and Cable Compound Market by Type (Halogenated, Non-halogenated), Application (Building Wires, Power Cables, Submarine Cables, Communication Cables, Automotive Wiring), End-use Industry (Construction, Power, Communication, Automotive), and Region - Global Forecast to 2030

icon1
USD 22.22 BN
MARKET SIZE, 2030
icon2
CAGR 7.8%
(2025-2030)
icon3
250
REPORT PAGES
icon4
300
MARKET TABLES

OVERVIEW

Source: Secondary Research, Interviews with Experts, MarketsandMarkets Analysis

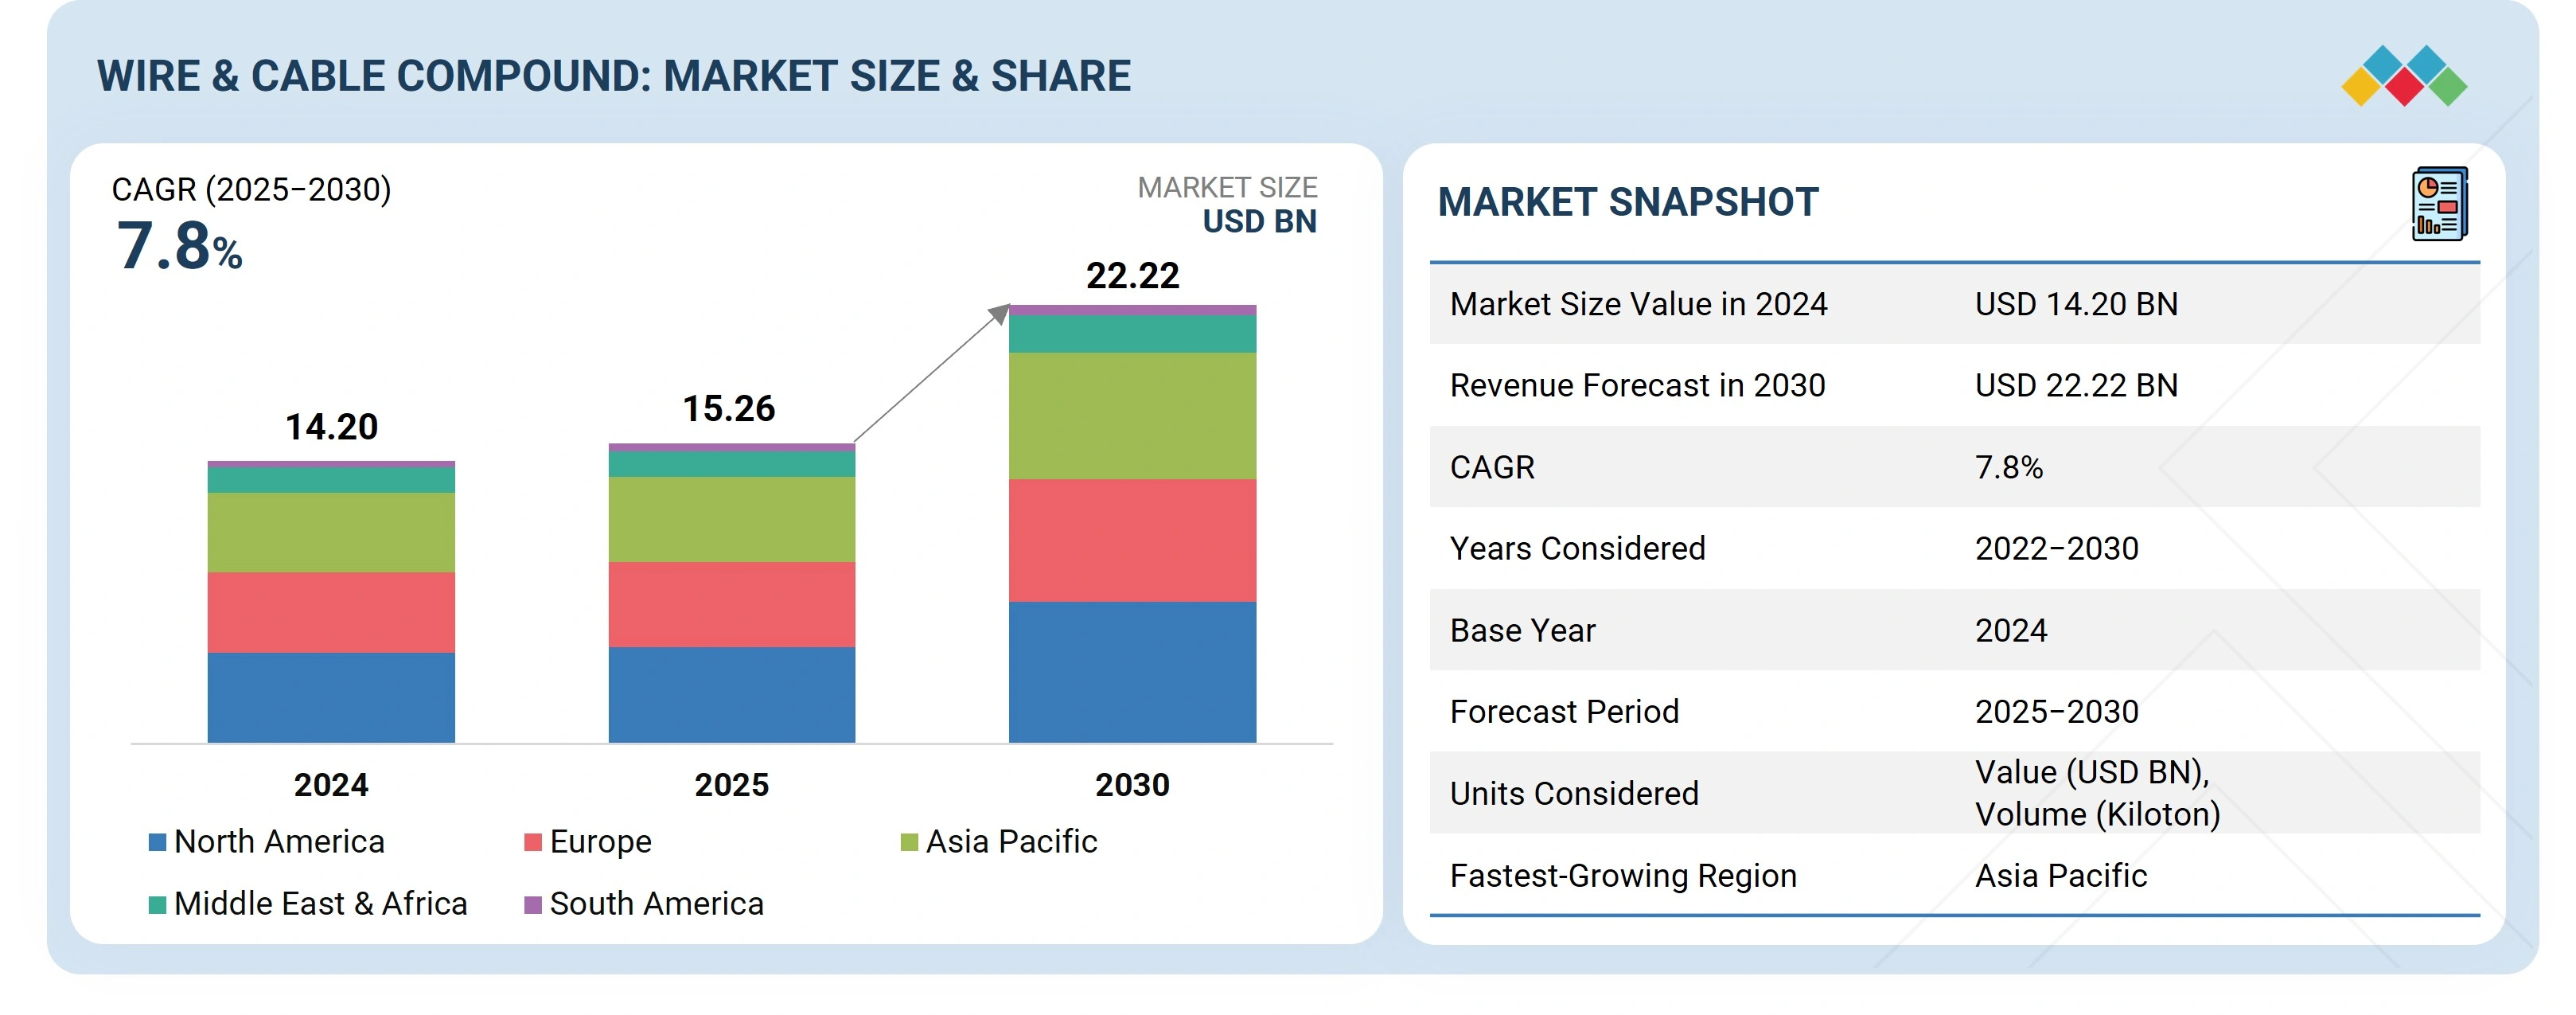
The wire & cable compound market is projected to reach USD 22.22 billion by 2030 from USD 15.26 billion in 2025, at a CAGR of 7.8% from 2025 to 2030. The wire & cable compound market is mainly driven by the growing use of wire and cable compounds in the construction, power, communication, and automotive industries. The growing need for safety, reliability, sustainability, and adaptability in electrification and connectivity is the key driver behind the surging demand for wire & cable compounds in construction, power, and automotive applications.

KEY TAKEAWAYS

  • BY PRODUCT TYPE
    The wire & cable compound market comprises halogenated and non-halogenated product types. The non-halogenated product type is expected to be the fastest-growing segment during the forecast period, driven by increasing regulatory pressure and demand for environmentally friendly products.
  • BY APPLICATION
    The applications of wire and cable compounds include building wires, power cables, submarine cables, submarine cables, automotive wiring, and other applications. The building wire segment is expected to have the highest CAGR due to rapid urbanization, rising construction activities, and increasing demand for residential and commercial infrastructure.
  • BY END-USE INDUSTRY
    Key end-use industries of wire and cable compound span across construction, power, communication, automotive, and other end-use industries. In 2024, the construction sector generated the highest demand for wire and cable compounds, especially due to the growing infrastructure developments in developing countries.
  • BY REGION
    The wire & cable compound market covers Europe, North America, Asia Pacific, South America, and the Middle East & Africa. North America is the largest market for wire and cable compounds due to its well-established power infrastructure, rapid adoption of renewable energy projects, and continuous upgrades in transmission and distribution networks. The region has strong demand from construction, automotive (particularly EVs), oil & gas, and telecommunications sectors, all of which rely heavily on advanced cable materials.
  • COMPETITIVE LANDSCAPE
    Major market players have adopted both organic and inorganic strategies, including partnerships and investments. For instance, Borealis GmbH (Austria), Syensqo (Belgium), and Evonik Industries (Germany) have entered a number of agreements and partnerships to cater to the growing demand for wire and cable compounds across innovative applications.

The growing necessity for precise high-performance components in the aerospace, healthcare, and electronic industries serves as a major factor pushing the 3D printing ceramics market forward. Ceramic 3D printing demonstrates the capability to create intricate shapes and minimize material usage while enabling personalized solutions, which drives its increasing adoption. The increasing adoption of artificial intelligence (AI) by companies enables them to boost both their operational efficiency and product quality. For instance, 3DCeram launched the CERIA Set, which uses AI technology to enhance part design while optimizing placement and scraping parameters to achieve perfect prints with minimal waste.

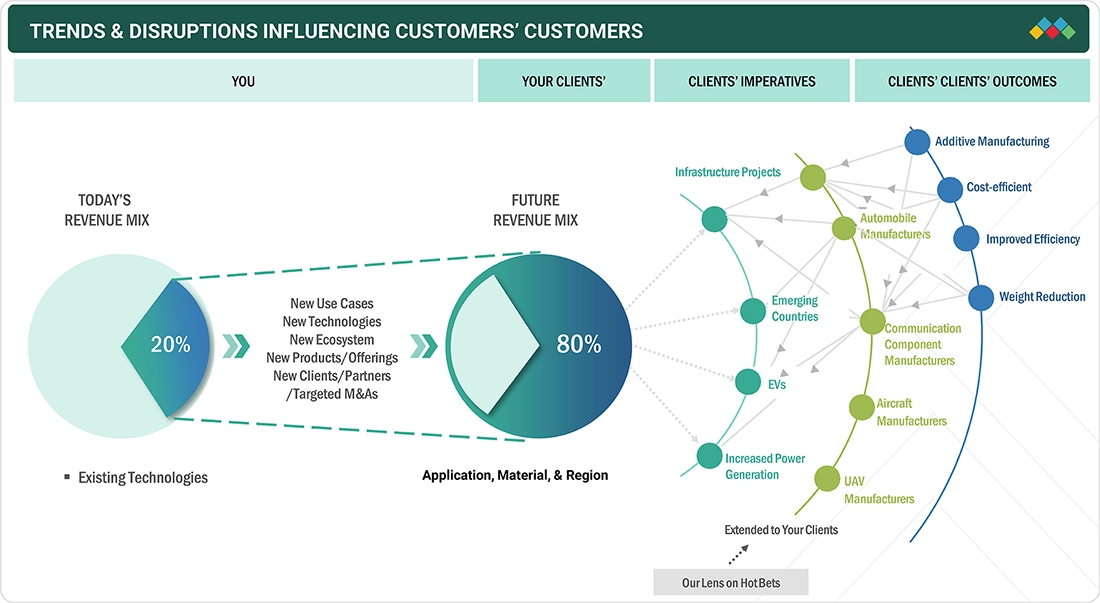
TRENDS & DISRUPTIONS IMPACTING CUSTOMERS' CUSTOMERS

The impact on consumers' business emerges from customer trends or disruptions. Hotbets are clients of wire and cable compound manufacturers, and target applications are clients of wire and cable manufacturers. Shifts, which are changing trends or disruptions, will impact the revenues of end users. The revenue impact on end users will affect the revenue of hotbets, which will further affect the revenues of wire and cable compound manufacturers.

Source: Secondary Research, Interviews with Experts, MarketsandMarkets Analysis

MARKET DYNAMICS

Drivers
Impact
Level
  • Increased government and private sector spending for development of renewable energy resources
  • Increasing demand for lightweight and fuel-efficient vehicles
RESTRAINTS
Impact
Level
  • Government regulations restricting use of halogenated polymers
  • Global trade war escalation
OPPORTUNITIES
Impact
Level
  • Growing demand for cables in EV infrastructure
  • Rising demand from emerging markets
CHALLENGES
Impact
Level
  • Increasing wireless communication technology
  • Difficulty in enhancing insulation durability

Source: Secondary Research, Interviews with Experts, MarketsandMarkets Analysis

Driver: Increased government and private sector spending for development of renewable energy resources

The renewable energy resources (e.g., solar power plants and windmill-powered plants) market is growing at a fast pace because of the high energy prices and limited energy resources. Power demand is growing at a fast rate due to growing infrastructure, industrialization, and urbanization. Recently, over 190 nations have signed the Paris Agreement, in which every nation submits reports of its own contribution toward controlling global warming. For instance, India pledged to produce 40% of its electricity from non-fossil fuels by 2030. Every nation is working toward producing energy from renewable energy sources because of the need for low maintenance and operating costs, as well as for sustainable development. The market for wires and cables used in the power sector, i.e., medium voltage (MV), high voltage (HV), and extra high voltage (EHV), is estimated to expand rapidly during the forecast period. The expansion is due to the increasing power sector globally, which is anticipated to fuel the market for wire and cable compounds. Seven nations have introduced legislation to implement net-zero emissions, and over 120 nations have vowed to do the same. The commitment by nations is anticipated to be a turning point in the market growth for renewable energy resources. It will increase the demand for lightweight, fuel-efficient mobility, leading to a surge in the requirement for next-generation and technologically advanced wire and cable compounds.

Restraint: Government regulations restricting use of halogenated polymers

The European Union’s Construction Products Regulation (CPR) is a comprehensive piece of legislation that addresses different elements of any type of building material available for sale in the European Economic Area (EEA). The CPR is designed to ensure the consistency of material performance information through the use of standards and standard test methods. These test procedures measure the performance of cables in terms of important factors like ease of ignition of the cable, rate and distance with which fire travels through the cable, amount of smoke caused by cable combustion, toxicity of cable combustion by-products, and corrosivity of cable combustion by-products. This regulation curbs the use of halogenated compounds in the wire & cable sector. The EU construction sector has been instructed to employ non-halogenated wires & cables, because of which the market for halogenated polymers is witnessing sluggish growth in the region.

Opportunity: Growing demand for cables in EV infrastructure

The growth of electric vehicle (EV) infrastructure is greatly influencing the wire & cable compound market, triggering a growing demand for specialized EV-specific cables able to fulfill the requirements of EV charging networks. With the increasing popularity of electric vehicles, the demand for efficient and durable charging networks increases accordingly. This also involves the need for high-current and high-voltage capable charging cables, which can handle these efficiently and safely. For different charging standards like Level 1, Level 2, and DC fast charging (DCFC), cables have to accommodate high amperage and voltages, in many cases up to 800 volts for DC fast chargers. These cables are constructed using high-grade thermoplastic elastomers (TPE) or cross-linked polyethylene (XLPE) insulation for durability and flexibility, supporting repeated use and exposure to the environment.

Challenge:Enhancing insulation durability under harsh conditions

The durability of insulation is a significant concern in the wire and cable sector, particularly for submarine cables. These cables are laid on the ocean floor and traverse deep, often turbulent waters, requiring insulation materials that can endure extreme pressure, high salinity, and temperature fluctuations. As time passes, such conditions will result in degradation of insulation that may cause potential failure or diminished performance. Keeping insulation intact and functional over the long life of a cable is important for maintaining operational reliability and limiting expensive repairs or replacements. This problem requires ongoing improvements in material science and engineering to create more durable insulation materials that can withstand the harsh underwater environment. Moisture ingress is a persistent threat, significantly reducing insulation resistance and potentially causing electrical failure. Impurities, coarse additives, or heavy metals in the compounds can also degrade insulating properties. Developing compounds that combine all necessary properties, thermal and chemical resistance, mechanical strength, flame retardancy, and long-term durability without excessive cost or environmental impact is technically complex and requires advanced formulations and manufacturing precision.

Wire and Cable Compound Market: COMMERCIAL USE CASES ACROSS INDUSTRIES

COMPANY USE CASE DESCRIPTION BENEFITS
Uses Low Smoke Zero Halogen (LSZH) and flame-retardant compounds in its building and telecom cables, widely used in smart city projects and data centers Enhances fire safety, reduces toxic emissions, and ensures compliance with stringent EU building and telecom regulations
Uses halogen-free and high-performance polymer compounds in rail and marine cables for metro projects (e.g., Paris Metro, shipboard wiring) Provides safety in confined transport environments, reduces smoke/toxicity in emergencies, and meets global transport safety standards
Uses flame-retardant and halogen-free compounds for telecom and data communication cables, including fiber optic systems Ensures reliability in high-speed communication networks and compliance with global telecom standards

Logos and trademarks shown above are the property of their respective owners. Their use here is for informational and illustrative purposes only.

MARKET ECOSYSTEM

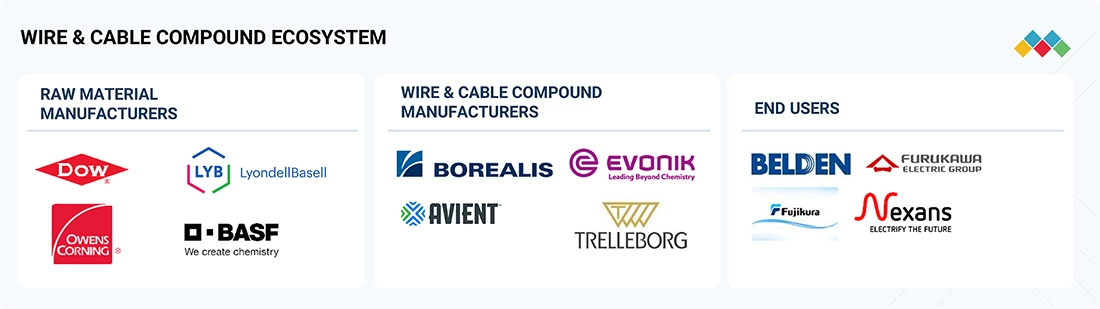
The wire & cable compound market ecosystem consists of raw material manufacturer (Dow,LyondellBasell), wire and cable compound manufacturer (Borealis, Evonik Industries), Distributors (Nexeo Plastics, Westlake Compounds), and end users (Balden, Fujikura). The raw material suppliers provide polymers to wire and cable compound manufacturers. The distributors and suppliers establish contact between the manufacturing companies and end users to streamline the supply chain, increasing operational efficiency and profitability.

Logos and trademarks shown above are the property of their respective owners. Their use here is for informational and illustrative purposes only.

MARKET SEGMENTS

Source: Secondary Research, Interviews with Experts, MarketsandMarkets Analysis

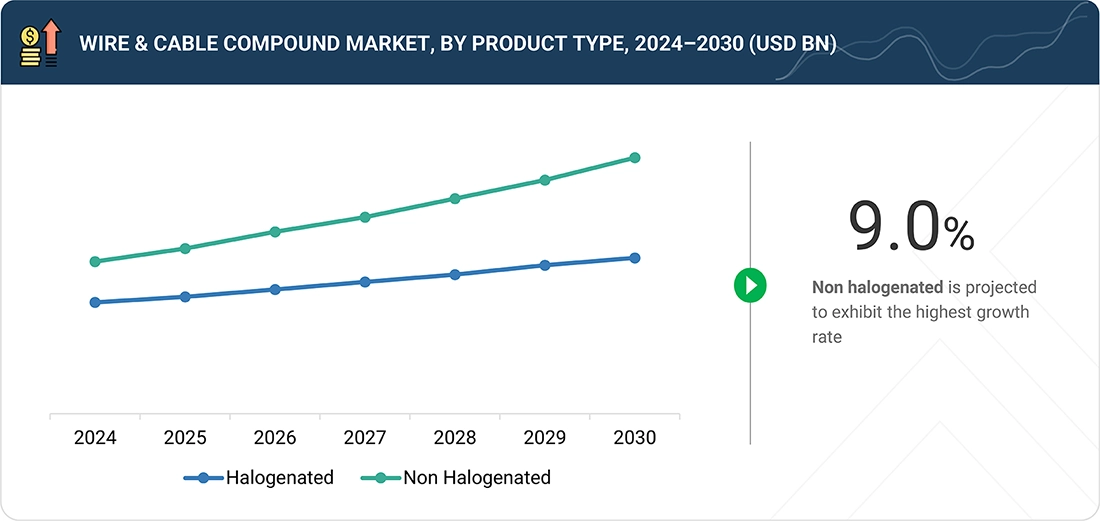
Wire and Cable Compound Market, by Product Type

The non-halogenated segment will hold the larger market share in 2030. Non-halogenated wire & cable compounds are used in the wire & cable industry mainly because of their increased safety, environmental friendliness, and high performance. Non-halogenated (halogen-free) compounds emit no toxic gases (like hydrogen chloride or dioxins) or heavy smoke when burned, like the by-products from halogenated cables. This significantly reduces health risks and allows for safer, clearer emergency escape paths. Halogen-free cables are designed to be fire resistant, retarding the rate of fire propagation. They give off much less smoke and prevent toxic acid fumes from being formed, which is particularly important in public areas with limited ventilation, business buildings, hospitals, and transport systems. With no halogens, the cables do not release corrosive products when burning.

Wire and Cable Compound Market, by Application

Construction wires held the greatest market share in the wire and cable compounds market due to the continuous and bulk demand from residential, commercial, and industrial construction activities. Construction wires are critical to electrical wiring within buildings, spanning applications such as power distribution, illumination, and control systems, making them an integral and repeating need across the globe. Their consumption is also increased by rapid urbanization, modernization of infrastructure, and housing initiatives by the government, while demand for compounds that promote fire resistance, insulation, and durability enhances their grip on the other application segments.

Wire and Cable Compound Market, by End-use Industry

The construction industry is expected to dominate the market during the forecast period. The wire & cable compound market within the construction end-use industry is growing rapidly due to the sector’s high demand for safe, reliable, and durable wiring solutions across residential, commercial, and industrial buildings. Current construction demands large quantities of electrical wiring for the distribution of power, lighting, telecommunication, security systems, and building automation. Wire and cable compounds offer the necessary insulation and protection required for these purposes, thus being essential parts in new construction as well as in renovation. Construction wiring compounds should provide mechanical strength, electrical insulation, high thermal resistance, good insulation, and low smoke and toxic combustion products emission. These properties enable compliance with aggressive building codes and fire safety standards, particularly for high-rise buildings and densely populated buildings. Urbanization, growth in commercial property investments, and the spread of smart buildings are stimulating demand for wire and cable compounds.
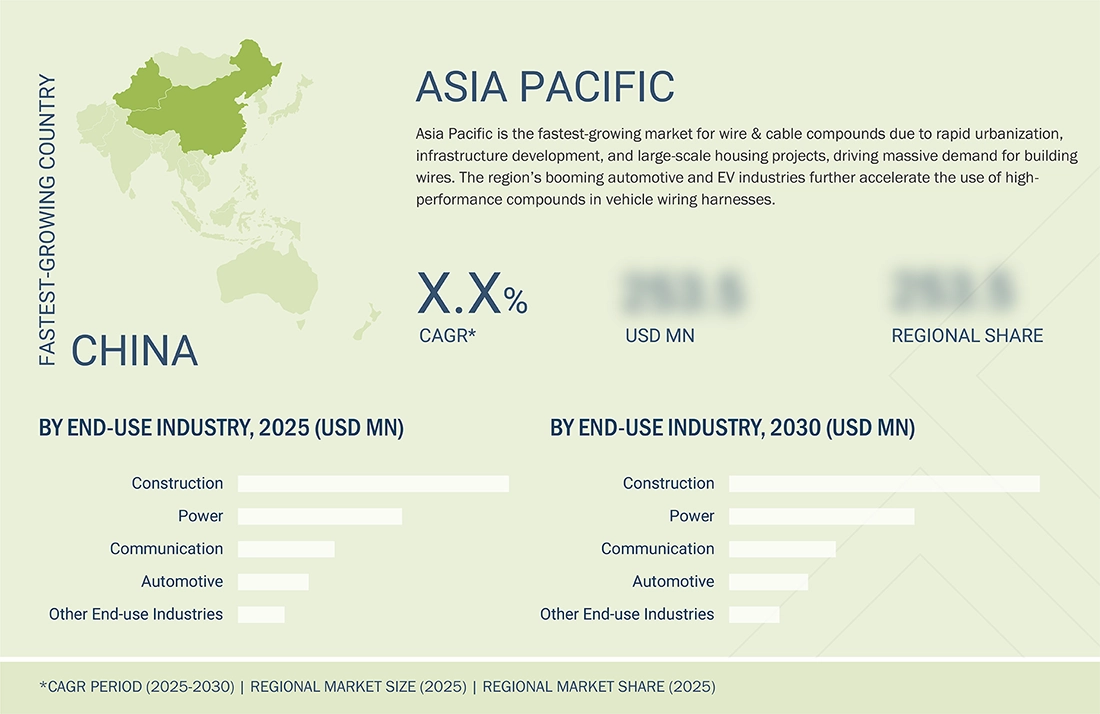
REGION

Asia Pacific to be fastest-growing region in global wire and cable compound market during forecast period

The rapidly growing construction, automotive, and electronics sectors in Asia Pacific are significant users of wire and cable compounds. For instance, China and India are the world leaders in car manufacturing and are experiencing enhanced uptake of electric cars, which need sophisticated and specialized wiring systems. The region is putting a lot of investment in power generation, smart grids, and renewable energy (solar and wind schemes). These advances require contemporary, high-performance cable materials for power transmission, dependability, and security. Massive deployment of fiber optic cable for 5G and broadband expansion is driving demand for compounds that facilitate high-speed, error-free data transmission across the region. The region’s huge and growing population, combined with rising access to electricity and digital services, increases the need for high-quality, resilient wire and cable systems in urban and rural areas.

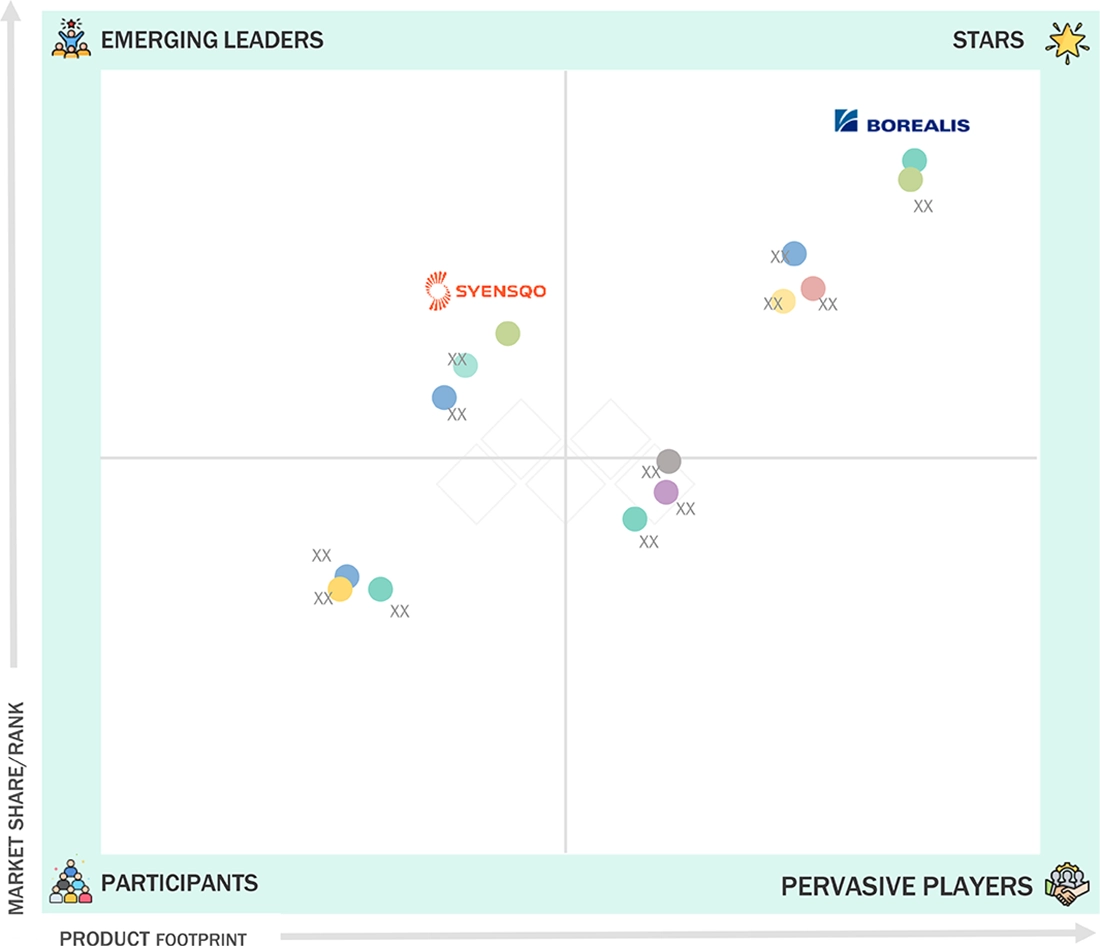
Wire and Cable Compound Market: COMPANY EVALUATION MATRIX

In the wire & cable compound market, Borealis GmbH (Star) leads with a strong market share and extensive product footprint, driven by its collaborations and partnerships with end users. Syensqo (Emerging Leader) is gaining visibilty because it is one of the newer specialty-polymers players spun off from Solvay, giving it a strong R&D base along with advanced polymer technologies for high-performance needs. While Borealis GmbH dominates through scale and a diverse portfolio,Syensqo shows significant potential to move toward the leaders’ quadrant as demand for wire and cable compound continues to rise.

Source: Secondary Research, Interviews with Experts, MarketsandMarkets Analysis

MARKET SCOPE

REPORT METRIC DETAILS
Market Size in 2024 (Value) USD 14.20 Billion
Market Forecast in 2030 (value) USD 22.22 Billion
Growth Rate CAGR of 7.8% from 2025–2030
Years Considered 2022–2030
Base Year 2024
Forecast Period 2025–2030
Units Considered Value (USD Million/Billion), Volume (Kilotons)
Report Coverage Revenue forecast, company ranking, competitive landscape, growth factors, and trends.
Segments Covered
  • By Product Type:
    • Halogenated
    • Non-Halogenated
  • By Application:
    • Building wires
    • Power cables
    • submarine cables
    • communication cables
    • automotive wiring
    • others
  • By End-use Industry:
    • Construction
    • Power
    • Communication
    • Automotive
    • and Other End-use Industries
Regions Covered North America, Asia Pacific, Europe, Latin America, Middle East & Africa

WHAT IS IN IT FOR YOU: Wire and Cable Compound Market REPORT CONTENT GUIDE

DELIVERED CUSTOMIZATIONS

We have successfully delivered the following deep-dive customizations:

CLIENT REQUEST CUSTOMIZATION DELIVERED VALUE ADDS
Raw Material Supplier
  • Competitive profiling of raw material suppliers (financials, certifications, product portfolio)
  • Benchmarking of material usage across indsutries
  • Partnership and supply chain ecosystem analysis
  • Identify qualified material partners
  • Detect gaps in current supplier base
  • Highlight opportunities for cost reduction & efficiency
wire and cable compound manufacturers
  • Global & regional production capacity benchmarking for halogenated and non-halogenated product type
  • Mapping of new capacity expansions and certifications
  • Customer profiling across OEMs and tier-1 suppliers
  • Pricing dynamics and margin benchmarking across regions
  • Competitive positioning against top global compound players
  • Refine product differentiation strategy
  • Improve cost structures
  • Expand into high-growth applications like EV and telecom wiring
wire and cable manufacturers
  • Technical & economic benefits of advanced compounds
  • Forecast of adoption of wire and cable compound for construction by 2030
  • R&D pipeline mapping for wire and cable
  • Strengthen positioning in various industries
  • Identify long-term opportunities in specific end-use industry
End -user
  • Market adoption benchmarking across power, construction, and automotive sectors
  • Switching cost analysis for OEMs between various compounds
  •  
  • Insights on growing adoption of advanced material
  • Pinpoint cross-industry substitution risks
  • Enable targeting of high-growth opportunities

RECENT DEVELOPMENTS

  • May 2025 : Syensqo and Sinopec signed a strategic partnership framework agreement to foster collaboration in advanced materials and specialty chemicals. The partnership is set to explore business development opportunities and application development in various sectors, including commercial aerospace, transportation, energy, electronics, and industrial fields. By leveraging their combined expertise, Syensqo and Sinopec aim to empower innovation and deliver sustainable solutions that meet the evolving demands of these industries.
  • February 2025 : Avient Corporation announced an expansion of its ECCOH XL Cross-Linkable Flame-Retardant Solutions with the launch of ECCOH XL 8054. Developed for low-smoke and fume wire and cable insulation, this solution can meet stringent electrical and electronic fire safety regulations in Europe.
  • June 2023 : Borealis GmbH acquired Rialti S.p.A., a leading European producer of recycled polypropylene compounds. This investment strengthened Borealis’ circular portfolio by adding 50,000 tons of recycled compounding capacity and meeting growing customer demand for sustainable solutions.


Table of Contents

Exclusive indicates content/data unique to MarketsandMarkets and not available with any competitors.

TITLE
PAGE NO
1
INTRODUCTION


29
2
RESEARCH METHODOLOGY


33
3
EXECUTIVE SUMMARY


42
4
PREMIUM INSIGHTS


46
5
MARKET OVERVIEW
Explore booming renewable investments and EV infrastructure demand amid regulatory and trade challenges.


50
 
5.1
INTRODUCTION


5.2
MARKET DYNAMICS


5.2.1
DRIVERS


5.2.1.1
INCREASED GOVERNMENT AND PRIVATE SECTOR SPENDING FOR DEVELOPMENT OF RENEWABLE ENERGY RESOURCES


5.2.1.2
HIGHER DEMAND FOR LIGHTWEIGHT AND FUEL-EFFICIENT VEHICLES


5.2.1.3
RISING DEMAND FOR ADVANCED WIRES & CABLES IN OFFSHORE, MARINE, AEROSPACE, AND OIL & GAS SECTORS


5.2.2
RESTRAINTS


5.2.2.1
GOVERNMENT REGULATIONS RESTRICTING USE OF HALOGENATED POLYMERS


5.2.2.2
GLOBAL TRADE WAR ESCALATION


5.2.3
OPPORTUNITIES


5.2.3.1
GROWING DEMAND FOR CABLES IN EV INFRASTRUCTURE


5.2.3.2
RISING DEMAND FROM EMERGING MARKETS


5.2.4
CHALLENGES


5.2.4.1
INCREASING WIRELESS COMMUNICATION TECHNOLOGY


5.2.4.2
ENHANCING INSULATION DURABILITY UNDER HARSH CONDITIONS
 
 
5.3
PORTER’S FIVE FORCES ANALYSIS


5.3.1
THREAT OF NEW ENTRANTS


5.3.2
THREAT OF SUBSTITUTES


5.3.3
BARGAINING POWER OF SUPPLIERS


5.3.4
BARGAINING POWER OF BUYERS


5.3.5
INTENSITY OF COMPETITIVE RIVALRY


5.4
KEY STAKEHOLDERS AND BUYING CRITERIA


5.4.1
KEY STAKEHOLDERS IN BUYING PROCESS


5.4.2
BUYING CRITERIA


5.5
MACROECONOMICS INDICATORS


5.5.1
INTRODUCTION


5.5.2
GDP TRENDS AND FORECAST


5.5.3
TRENDS IN CONSTRUCTION INDUSTRY


5.5.4
TRENDS IN POWER INDUSTRY


5.6
VALUE CHAIN ANALYSIS


5.7
ECOSYSTEM ANALYSIS


5.8
PRICING ANALYSIS


5.8.1
AVERAGE SELLING OF WIRE & CABLE COMPOUNDS PRICE AMONG END-USE INDUSTRIES, BY KEY PLAYER, 2024


5.8.2
AVERAGE SELLING PRICE TREND OF WIRE & CABLE COMPOUNDS, BY TYPE, 2022–2025


5.8.3
AVERAGE SELLING PRICE TREND OF WIRE & CABLE COMPOUNDS, BY APPLICATION, 2022–2025


5.8.4
AVERAGE SELLING PRICE TREND OF WIRE & CABLE COMPOUNDS, BY REGION, 2022–2025


5.9
TRADE ANALYSIS


5.9.1
IMPORT SCENARIO (HS CODE 761410)


5.9.2
EXPORT SCENARIO (HS CODE 761410)


5.10
TECHNOLOGY ANALYSIS


5.10.1
KEY TECHNOLOGIES


5.10.1.1
BANBURY MIXING/INTERNAL MIXING


5.10.1.2
TWIN-SCREW EXTRUSION (COMPOUNDING EXTRUDER)


5.10.1.3
ROLL MILLING/TWO-ROLL MILL


5.10.2
COMPLEMENTARY TECHNOLOGIES


5.10.2.1
EXTRUSION PROCESS


5.10.2.2
VULCANIZATION
 
 
5.11
IMPACT OF AI/GEN AI ON WIRE & CABLE COMPOUNDS MARKET


5.11.1
TOP USE CASES AND MARKET POTENTIAL


5.11.2
CASE STUDIES OF AI IMPLEMENTATION IN WIRE & CABLE COMPOUNDS MARKET


5.11.3
CLIENTS’ READINESS TO ADOPT GENERATIVE AI IN WIRE & CABLE COMPOUNDS MARKET


5.12
PATENT ANALYSIS


5.12.1
INTRODUCTION


5.12.2
METHODOLOGY


5.12.3
PATENT TYPE


5.12.4
INSIGHTS


5.12.5
LEGAL STATUS OF PATENTS


5.12.6
JURISDICTION ANALYSIS


5.12.7
TOP APPLICANTS


5.12.8
LIST OF PATENTS BY HITACHI METALS LTD


5.12.9
LIST OF PATENTS BY BOREALIS AG


5.12.10
LIST OF PATENTS BY AEI COMPOUNDS LTD


5.13
REGULATORY LANDSCAPE


5.13.1
REGULATORY BODIES, GOVERNMENT AGENCIES, AND OTHER ORGANIZATIONS


5.14
KEY CONFERENCES AND EVENTS, 2025–2026


5.15
CASE STUDY ANALYSIS


5.15.1
AVIENT CORPORATION LAUNCHED CROSS-LINKABLE FLAME- RETARDANT SOLUTION


5.15.2
EXXON MOBIL CORPORATION EXPANDED PRODUCTION CAPACITY


5.15.3
ALPHAGARY ACQUIRED MAJOR SHARES IN SHAKUN POLYMERS PRIVATE LIMITED


5.16
TRENDS AND DISRUPTIONS IMPACTING CUSTOMER BUSINESS


5.17
INVESTMENT AND FUNDING SCENARIO


5.18
IMPACT OF 2025 US TARIFF – WIRE & CABLE COMPOUNDS MARKET


5.18.1
INTRODUCTION


5.18.2
KEY TARIFF RATES


5.18.3
PRICE IMPACT ANALYSIS


5.18.4
IMPACT ON COUNTRY/REGION


5.18.4.1
US


5.18.4.2
EUROPE


5.18.4.3
ASIA PACIFIC


5.18.5
END-USE INDUSTRY-LEVEL IMPACT
 
 
6
WIRE & CABLE COMPOUNDS MARKET, BY TYPE
Market Size & Growth Rate Forecast Analysis to 2030 in USD Million and Kilotons | 12 Data Tables


94
 
6.1
INTRODUCTION


6.2
HALOGENATED POLYMERS


6.2.1
COST-EFFECTIVENESS, GOOD FLAME-RETARDANT PROPERTIES, AND MECHANICAL DURABILITY TO DRIVE MARKET


6.2.2
POLYVINYL CHLORIDE (PVC)


6.2.3
CHLORINATED POLYETHYLENE (CPE)


6.3
NON-HALOGENATED POLYMERS


6.3.1
STRICT GOVERNMENT AND FIRE SAFETY REGULATIONS TO DRIVE MARKET


6.3.2
CROSS-LINKED POLYETHYLENE (XLPE)


6.3.3
THERMOPLASTIC ELASTOMERS (TPE)


6.3.4
THERMOPLASTIC OLEFINS (TPO)


6.3.5
THERMOPLASTIC POLYURETHANE (TPU)


6.3.6
THERMOPLASTIC VULCANATES (TPV)
 
 
7
WIRE & CABLE COMPOUNDS MARKET, BY APPLICATION
Market Size & Growth Rate Forecast Analysis to 2030 in USD Million and Kilotons | 28 Data Tables


102
 
7.1
INTRODUCTION


7.2
BUILDING WIRES


7.2.1
SMART BUILDING INTEGRATION AND MODULAR CONSTRUCTION TO DRIVE INNOVATION


7.3
POWER CABLES


7.3.1
GLOBAL SHIFT TO RENEWABLE ENERGY AND GRID MODERNIZATION TO DRIVE MARKET


7.4
SUBMARINE CABLES


7.4.1
SUBSEA CONNECTIVITY BOOM TO DRIVE COMPOUND INNOVATION


7.5
COMMUNICATION CABLES


7.5.1
FIBER EXPANSION FUELS WIRE & CABLE COMPOUNDS DEMAND


7.6
AUTOMOTIVE WIRING


7.6.1
GROWING DEMAND FOR ELECTRIC VEHICLES TO DRIVE MARKET


7.7
OTHER APPLICATIONS


8
WIRE & CABLE COMPOUNDS MARKET, BY END-USE INDUSTRY
Market Size & Growth Rate Forecast Analysis to 2030 in USD Million and Kilotons | 24 Data Tables


116
 
8.1
INTRODUCTION


8.2
CONSTRUCTION


8.2.1
RISING GOVERNMENT SPENDING ON INFRASTRUCTURE DEVELOPMENT


8.2.2
COMMERCIAL


8.2.3
RESIDENTIAL


8.2.4
INDUSTRIAL


8.3
POWER


8.3.1
GROWING ADOPTION OF CLEAN AND GREEN ENERGY TO DRIVE DEMAND


8.3.2
NUCLEAR POWER PLANTS


8.3.3
WINDMILL-POWERED PLANTS


8.4
COMMUNICATION


8.4.1
INTRODUCTION OF TECHNOLOGIES SUCH AS 4G AND 5G TO DRIVE DEMAND


8.4.2
MEDIUM/HIGH VOLTAGE INSULATION CABLES


8.4.3
LOW VOLTAGE POWER CABLE INSULATION


8.4.4
DIELECTRIC INSULATION


8.5
AUTOMOTIVE


8.5.1
GROWING DEMAND FOR ELECTRIC VEHICLES TO DRIVE MARKET


8.5.2
CABLES FOR BATTERIES


8.5.3
ELECTRIC OR HYBRID VEHICLES


8.6
OTHER END-USE INDUSTRIES


9
WIRE & CABLE COMPOUNDS MARKET, BY REGION
Comprehensive coverage of 8 Regions with country-level deep-dive of 17 Countries | 152 Data Tables.


129
 
9.1
INTRODUCTION


9.2
NORTH AMERICA


9.2.1
NORTH AMERICA: WIRE & CABLE COMPOUNDS MARKET, BY TYPE


9.2.2
NORTH AMERICA: WIRE & CABLE COMPOUNDS MARKET, BY END-USE INDUSTRY


9.2.3
NORTH AMERICA: WIRE & CABLE COMPOUNDS MARKET, BY COUNTRY


9.2.3.1
US


9.2.3.2
CANADA


9.2.3.3
MEXICO
 
 
9.3
EUROPE


9.3.1
EUROPE: WIRE & CABLE COMPOUNDS MARKET, BY TYPE


9.3.2
EUROPE: WIRE & CABLE COMPOUNDS MARKET, BY END-USE INDUSTRY


9.3.3
EUROPE: WIRE & CABLE COMPOUNDS MARKET, BY COUNTRY


9.3.3.1
GERMANY


9.3.3.2
FRANCE


9.3.3.3
UK


9.3.3.4
ITALY


9.3.3.5
RUSSIA


9.3.3.6
REST OF EUROPE
 
 
9.4
ASIA PACIFIC


9.4.1
ASIA PACIFIC: WIRE & CABLE COMPOUNDS MARKET, BY TYPE


9.4.2
ASIA PACIFIC: WIRE & CABLE COMPOUNDS MARKET, BY END-USE INDUSTRY


9.4.3
ASIA PACIFIC: WIRE & CABLE COMPOUNDS MARKET, BY COUNTRY


9.4.3.1
CHINA


9.4.3.2
JAPAN


9.4.3.3
INDIA


9.4.3.4
SOUTH KOREA


9.4.3.5
REST OF ASIA PACIFIC
 
 
9.5
MIDDLE EAST & AFRICA


9.5.1
MIDDLE EAST & AFRICA: WIRE & CABLE COMPOUNDS MARKET, BY TYPE


9.5.2
MIDDLE EAST & AFRICA: WIRE & CABLE COMPOUNDS MARKET, BY END-USE INDUSTRY


9.5.3
MIDDLE EAST & AFRICA: WIRE & CABLE COMPOUNDS MARKET, BY COUNTRY


9.5.3.1
GCC COUNTRIES


9.5.3.2
SOUTH AFRICA


9.5.3.3
REST OF MIDDLE EAST & AFRICA
 
 
9.6
SOUTH AMERICA


9.6.1
SOUTH AMERICA: WIRE & CABLE COMPOUNDS MARKET, BY TYPE


9.6.2
SOUTH AMERICA: WIRE & CABLE COMPOUNDS MARKET, BY END-USE INDUSTRY


9.6.3
SOUTH AMERICA: WIRE & CABLE COMPOUNDS MARKET, BY COUNTRY


9.6.3.1
BRAZIL


9.6.3.2
ARGENTINA


9.6.3.3
REST OF SOUTH AMERICA
 
10
COMPETITIVE LANDSCAPE
Uncover strategic dominance and market positioning of key players shaping the competitive landscape.


194
 
10.1
OVERVIEW


10.2
KEY PLAYER STRATEGIES/RIGHT TO WIN


10.3
REVENUE ANALYSIS, 2020–2024


10.4
MARKET SHARE ANALYSIS, 2024


10.5
BRAND/PRODUCT COMPARISON


10.5.1
CASICO (BOREALIS GMBH)


10.5.2
ACCUREL (EVONIK INDUSTRIES)


10.5.3
MULTIBASE (DUPONT)


10.5.4
SYNCURE (AVIENT CORPORATION)


10.6
COMPANY EVALUATION MATRIX: KEY PLAYERS, 2024


10.6.1
STARS


10.6.2
EMERGING LEADERS


10.6.3
PERVASIVE PLAYERS


10.6.4
PARTICIPANTS


10.6.5
COMPANY FOOTPRINT: KEY PLAYERS, 2024


10.6.5.1
COMPANY FOOTPRINT


10.6.5.2
REGION FOOTPRINT


10.6.5.3
TYPE FOOTPRINT


10.6.5.4
APPLICATION FOOTPRINT


10.6.5.5
END-USE INDUSTRY FOOTPRINT
 
 
10.7
COMPANY EVALUATION MATRIX: STARTUPS/SMES, 2024


10.7.1
PROGRESSIVE COMPANIES


10.7.2
RESPONSIVE COMPANIES


10.7.3
DYNAMIC COMPANIES


10.7.4
STARTING BLOCKS


10.7.5
COMPETITIVE BENCHMARKING: STARTUPS/SMES, 2024


10.7.5.1
DETAILED LIST OF KEY STARTUPS/SMES


10.7.5.2
COMPETITIVE BENCHMARKING OF KEY STARTUPS/SMES
 
 
10.8
COMPANY VALUATION AND FINANCIAL METRICS


10.9
COMPETITIVE SCENARIO


10.9.1
PRODUCT LAUNCHES


10.9.2
DEALS


10.9.3
EXPANSIONS
 
 
11
COMPANY PROFILES
In-depth Company Profiles of Leading Market Players with detailed Business Overview, Product and Service Portfolio, Recent Developments, and Unique Analyst Perspective (MnM View)


216
 
11.1
KEY PLAYERS


11.1.1
BOREALIS GMBH


11.1.1.1
BUSINESS OVERVIEW


11.1.1.2
PRODUCTS OFFERED


11.1.1.3
RECENT DEVELOPMENTS


11.1.1.4
MNM VIEW


11.1.2
SYENSQO


11.1.3
EVONIK INDUSTRIES AG


11.1.4
DUPONT


11.1.5
AVIENT CORPORATION


11.1.6
EASTMAN CHEMICAL COMPANY


11.1.7
EXXON MOBIL CORPORATION


11.1.8
HANWHA SOLUTIONS CORPORATION


11.1.9
SCG


11.1.10
TRELLEBORG AB


11.1.11
ELECTRIC CABLE COMPOUNDS, INC.


11.1.12
ORBIA


11.1.13
RIKEN TECHNOS CORP


11.1.14
MELOS GMBH


11.1.15
ENEOS NUC CORPORATION


11.2
OTHER PLAYERS


11.2.1
VITAHCO


11.2.2
HEBEI SUNUA ADVANCED MATERIAL CO., LTD.


11.2.3
OTECH CORPORATION


11.2.4
GUANGDONG ADVANCED THERMOPLASTIC POLYMER TECHNOLOGY CO., LTD.


11.2.5
SACO AEI POLYMERS


11.2.6
SILON


11.2.7
CONDOR COMPOUNDS GMBH


11.2.8
INPVC


11.2.9
PREMIX GROUP


11.2.10
CABLE COMPOUNDS GROUP
 
 
12
APPENDIX


270
 
12.1
DISCUSSION GUIDE


12.2
KNOWLEDGESTORE: MARKETSANDMARKETS’ SUBSCRIPTION PORTAL


12.3
CUSTOMIZATION OPTIONS


12.4
RELATED REPORTS


12.5
AUTHOR DETAILS


LIST OF TABLES


TABLE 1
ZERO-EMISSION TARGETS FOR MAJOR ECONOMIES, BY YEAR


TABLE 2
NUMBER OF NEW COMMERCIAL AIRPLANE DELIVERIES, BY REGION (2020–2039)


TABLE 3
DELIVERIES OF SMALL, MEDIUM-SIZED, AND LARGE AIRCRAFT, BY REGION, 2019–2038


TABLE 4
WIRE & CABLE COMPOUNDS MARKET: PORTER’S FIVE FORCES ANALYSIS


TABLE 5
INFLUENCE OF STAKEHOLDERS ON BUYING PROCESS, BY END-USE INDUSTRY


TABLE 6
KEY BUYING CRITERIA, BY END-USE INDUSTRY


TABLE 7
GDP PERCENTAGE CHANGE, BY KEY COUNTRY, 2021–2029


TABLE 8
WIRE & CABLE COMPOUNDS MARKET: ROLES OF COMPANIES IN ECOSYSTEM


TABLE 9
AVERAGE SELLING PRICE OF WIRE & CABLE COMPOUNDS AMONG END-USE INDUSTRIES, BY KEY PLAYER, 2024 (USD/KG)


TABLE 10
AVERAGE SELLING PRICE OF WIRE & CABLE COMPOUNDS, BY TYPE, 2022–2025 (USD/KG)


TABLE 11
AVERAGE SELLING PRICE OF WIRE & CABLE COMPOUNDS, BY APPLICATION, 2022–2025 (USD/KG)


TABLE 12
AVERAGE SELLING PRICE OF WIRE & CABLE COMPOUNDS, BY REGION, 2022–2025 (USD/KG)


TABLE 13
IMPORT DATA RELATED TO HS CODE 761410, BY KEY COUNTRY, 2020–2024 (USD MILLION)


TABLE 14
EXPORT DATA RELATED TO HS CODE 761410, BY COUNTRY, 2020–2024 (USD MILLION)


TABLE 15
TOP USE CASES AND MARKET POTENTIAL


TABLE 16
WIRE & CABLE COMPOUNDS MARKET: CASE STUDIES RELATED TO GEN AI IMPLEMENTATION


TABLE 17
WIRE & CABLE COMPOUNDS MARKET: TOTAL NUMBER OF PATENTS, JANUARY 2015–JUNE 2025


TABLE 18
LIST OF PATENTS BY HITACHI METALS LTD


TABLE 19
LIST OF PATENTS BY BOREALIS AG


TABLE 20
LIST OF PATENTS BY AEI COMPOUNDS LTD


TABLE 21
NORTH AMERICA: REGULATORY BODIES, GOVERNMENT AGENCIES, AND OTHER ORGANIZATIONS


TABLE 22
EUROPE: REGULATORY BODIES, GOVERNMENT AGENCIES, AND OTHER ORGANIZATIONS


TABLE 23
ASIA PACIFIC: REGULATORY BODIES, GOVERNMENT AGENCIES, AND OTHER ORGANIZATIONS


TABLE 24
REST OF THE WORLD: REGULATORY BODIES, GOVERNMENT AGENCIES, AND OTHER ORGANIZATIONS


TABLE 25
WIRE & CABLE COMPOUNDS MARKET: LIST OF KEY CONFERENCES AND EVENTS, 2025–2026


TABLE 26
US-ADJUSTED RECIPROCAL TARIFF RATES (USD BILLION)


TABLE 27
KEY PRODUCT-RELATED TARIFF EFFECTIVE FOR WIRE & CABLE COMPOUNDS


TABLE 28
EXPECTED CHANGE IN PRICES AND LIKELY IMPACT ON END-USE MARKET DUE TO US TARIFF


TABLE 29
WIRE & CABLE COMPOUNDS MARKET, BY TYPE, 2022–2024 (USD MILLION)


TABLE 30
WIRE & CABLE COMPOUNDS MARKET, BY TYPE, 2022–2024 (KILOTON)


TABLE 31
WIRE & CABLE COMPOUNDS MARKET, BY TYPE, 2025–2030 (USD MILLION)


TABLE 32
WIRE & CABLE COMPOUNDS MARKET, BY TYPE, 2025–2030 (KILOTON)


TABLE 33
HALOGENATED POLYMERS: WIRE & CABLE COMPOUNDS MARKET, BY REGION, 2022–2024 (USD MILLION)


TABLE 34
HALOGENATED POLYMERS: WIRE & CABLE COMPOUNDS MARKET, BY REGION, 2022–2024 (KILOTON)


TABLE 35
HALOGENATED POLYMERS: WIRE & CABLE COMPOUNDS MARKET, BY REGION, 2025–2030 (USD MILLION)


TABLE 36
HALOGENATED POLYMERS: WIRE & CABLE COMPOUNDS MARKET, BY REGION, 2025–2030 (KILOTON)


TABLE 37
NON-HALOGENATED POLYMERS MARKET, BY REGION, 2022–2024 (USD MILLION)


TABLE 38
NON-HALOGENATED POLYMERS MARKET, BY REGION, 2022–2024 (KILOTON)


TABLE 39
NON-HALOGENATED POLYMERS MARKET, BY REGION, 2025–2030 (USD MILLION)


TABLE 40
NON-HALOGENATED POLYMERS MARKET, BY REGION, 2025–2030 (KILOTON)


TABLE 41
WIRE & CABLE COMPOUNDS MARKET, BY APPLICATION, 2022–2024 (USD MILLION)


TABLE 42
WIRE & CABLE COMPOUNDS MARKET, BY APPLICATION, 2022–2024 (KILOTON)


TABLE 43
WIRE & CABLE COMPOUNDS MARKET, BY APPLICATION, 2025–2030 (USD MILLION)


TABLE 44
WIRE & CABLE COMPOUNDS MARKET, BY APPLICATION, 2025–2030 (KILOTON)


TABLE 45
BUILDING WIRES: WIRE & CABLE COMPOUNDS MARKET, BY REGION, 2022–2024 (USD MILLION)


TABLE 46
BUILDING WIRES: WIRE & CABLE COMPOUNDS MARKET, BY REGION, 2022–2024 (KILOTON)


TABLE 47
BUILDING WIRES: WIRE & CABLE COMPOUNDS MARKET, BY REGION, 2025–2030 (USD MILLION)


TABLE 48
BUILDING WIRES: WIRE & CABLE COMPOUNDS MARKET, BY REGION, 2025–2030 (KILOTON)


TABLE 49
POWER CABLES: WIRE & CABLE COMPOUNDS MARKET, BY REGION, 2022–2024 (USD MILLION)


TABLE 50
POWER CABLES: WIRE & CABLE COMPOUNDS MARKET, BY REGION, 2022–2024 (KILOTON)


TABLE 51
POWER CABLES: WIRE & CABLE COMPOUNDS MARKET, BY REGION, 2025–2030 (USD MILLION)


TABLE 52
POWER CABLES: WIRE & CABLE COMPOUNDS MARKET, BY REGION, 2025–2030 (KILOTON)


TABLE 53
SUBMARINE CABLES: WIRE & CABLE COMPOUNDS MARKET, BY REGION, 2022–2024 (USD MILLION)


TABLE 54
SUBMARINE CABLES: WIRE & CABLE COMPOUNDS MARKET, BY REGION, 2022–2024 (KILOTON)


TABLE 55
SUBMARINE CABLES: WIRE & CABLE COMPOUNDS MARKET, BY REGION, 2025–2030 (USD MILLION)


TABLE 56
SUBMARINE CABLES: WIRE & CABLE COMPOUNDS MARKET, BY REGION, 2025–2030 (KILOTON)


TABLE 57
COMMUNICATION CABLES: WIRE & CABLE COMPOUNDS MARKET, BY REGION, 2022–2024 (USD MILLION)


TABLE 58
COMMUNICATION CABLES: WIRE & CABLE COMPOUNDS MARKET, BY REGION, 2022–2024 (KILOTON)


TABLE 59
COMMUNICATION CABLES: WIRE & CABLE COMPOUNDS MARKET, BY REGION, 2025–2030 (USD MILLION)


TABLE 60
COMMUNICATION CABLES: WIRE & CABLE COMPOUNDS MARKET, BY REGION, 2025–2030 (KILOTON)


TABLE 61
AUTOMOTIVE WIRING: WIRE & CABLE COMPOUNDS MARKET, BY REGION, 2022–2024 (USD MILLION)


TABLE 62
AUTOMOTIVE WIRING: WIRE & CABLE COMPOUNDS MARKET, BY REGION, 2022–2024 (KILOTON)


TABLE 63
AUTOMOTIVE WIRING: WIRE & CABLE COMPOUNDS MARKET, BY REGION, 2025–2030 (USD MILLION)


TABLE 64
AUTOMOTIVE WIRING: WIRE & CABLE COMPOUNDS MARKET, BY REGION, 2025–2030 (KILOTON)


TABLE 65
OTHER APPLICATIONS: WIRE & CABLE COMPOUNDS MARKET, BY REGION, 2022–2024 (USD MILLION)


TABLE 66
OTHER APPLICATIONS: WIRE & CABLE COMPOUNDS MARKET, BY REGION, 2022–2024 (KILOTON)


TABLE 67
OTHER APPLICATIONS: WIRE & CABLE COMPOUNDS MARKET, BY REGION, 2025–2030 (USD MILLION)


TABLE 68
OTHER APPLICATIONS: WIRE & CABLE COMPOUNDS MARKET, BY REGION, 2025–2030 (KILOTON)


TABLE 69
WIRE & CABLE COMPOUNDS MARKET, BY END-USE INDUSTRY, 2022–2024 (USD MILLION)


TABLE 70
WIRE & CABLE COMPOUNDS MARKET, BY END-USE INDUSTRY, 2022–2024 (KILOTON)


TABLE 71
WIRE & CABLE COMPOUNDS MARKET, BY END-USE INDUSTRY, 2025–2030 (USD MILLION)


TABLE 72
WIRE & CABLE COMPOUNDS MARKET, BY END-USE INDUSTRY, 2025–2030 (KILOTON)


TABLE 73
CONSTRUCTION: WIRE & CABLE COMPOUNDS MARKET, BY REGION, 2022–2024 (USD MILLION)


TABLE 74
CONSTRUCTION: WIRE & CABLE COMPOUNDS MARKET, BY REGION, 2022–2024 (KILOTON)


TABLE 75
CONSTRUCTION: WIRE & CABLE COMPOUNDS MARKET, BY REGION, 2025–2030 (USD MILLION)


TABLE 76
CONSTRUCTION: WIRE & CABLE COMPOUNDS MARKET, BY REGION, 2025–2030 (KILOTON)


TABLE 77
POWER: WIRE & CABLE COMPOUNDS MARKET, BY REGION, 2022–2024 (USD MILLION)


TABLE 78
POWER: WIRE & CABLE COMPOUNDS MARKET, BY REGION, 2022–2024 (KILOTON)


TABLE 79
POWER: WIRE & CABLE COMPOUNDS MARKET, BY REGION, 2025–2030 (USD MILLION)


TABLE 80
POWER: WIRE & CABLE COMPOUNDS MARKET, BY REGION, 2025–2030 (KILOTON)


TABLE 81
COMMUNICATION: WIRE & CABLE COMPOUNDS MARKET, BY REGION, 2022–2024 (USD MILLION)


TABLE 82
COMMUNICATION: WIRE & CABLE COMPOUNDS MARKET, BY REGION, 2022–2024 (KILOTON)


TABLE 83
COMMUNICATION: WIRE & CABLE COMPOUNDS MARKET, BY REGION, 2025–2030 (USD MILLION)


TABLE 84
COMMUNICATION: WIRE & CABLE COMPOUNDS MARKET, BY REGION, 2025–2030 (KILOTON)


TABLE 85
AUTOMOTIVE: WIRE & CABLE COMPOUNDS MARKET, BY REGION, 2022–2024 (USD MILLION)


TABLE 86
AUTOMOTIVE: WIRE & CABLE COMPOUNDS MARKET, BY REGION, 2022–2024 (KILOTON)


TABLE 87
AUTOMOTIVE: WIRE & CABLE COMPOUNDS MARKET, BY REGION, 2025–2030 (USD MILLION)


TABLE 88
AUTOMOTIVE: WIRE & CABLE COMPOUNDS MARKET, BY REGION, 2025–2030 (KILOTON)


TABLE 89
OTHER END-USE INDUSTRIES: WIRE & CABLE COMPOUNDS MARKET, BY REGION, 2022–2024 (USD MILLION)


TABLE 90
OTHER END-USE INDUSTRIES: WIRE & CABLE COMPOUNDS MARKET, BY REGION, 2022–2024 (KILOTON)


TABLE 91
OTHER END-USE INDUSTRIES: WIRE & CABLE COMPOUNDS MARKET, BY REGION, 2025–2030 (USD MILLION)


TABLE 92
OTHER END-USE INDUSTRIES: WIRE & CABLE COMPOUNDS MARKET, BY REGION, 2025–2030 (KILOTON)


TABLE 93
WIRE & CABLE COMPOUNDS MARKET, BY REGION, 2022–2024 (USD MILLION)


TABLE 94
WIRE & CABLE COMPOUNDS MARKET, BY REGION, 2022–2024 (KILOTON)


TABLE 95
WIRE & CABLE COMPOUNDS MARKET, BY REGION, 2025–2030 (USD MILLION)


TABLE 96
WIRE & CABLE COMPOUNDS MARKET, BY REGION, 2025–2030 (KILOTON)


TABLE 97
NORTH AMERICA: WIRE & CABLE COMPOUNDS MARKET, BY TYPE, 2022–2024 (USD MILLION)


TABLE 98
NORTH AMERICA: WIRE & CABLE COMPOUNDS MARKET, BY TYPE, 2022–2024 (KILOTON)


TABLE 99
NORTH AMERICA: WIRE & CABLE COMPOUNDS MARKET, BY TYPE, 2025–2030 (USD MILLION)


TABLE 100
NORTH AMERICA: WIRE & CABLE COMPOUNDS MARKET, BY TYPE, 2025–2030 (KILOTON)


TABLE 101
NORTH AMERICA: WIRE & CABLE COMPOUNDS MARKET, BY END-USE INDUSTRY, 2022–2024 (USD MILLION)


TABLE 102
NORTH AMERICA: WIRE & CABLE COMPOUNDS MARKET, BY END-USE INDUSTRY, 2022–2024 (KILOTON)


TABLE 103
NORTH AMERICA: WIRE & CABLE COMPOUNDS MARKET, BY END-USE INDUSTRY, 2025–2030 (USD MILLION)


TABLE 104
NORTH AMERICA: WIRE & CABLE COMPOUNDS MARKET, BY END-USE INDUSTRY, 2025–2030 (KILOTON)


TABLE 105
NORTH AMERICA: WIRE & CABLE COMPOUNDS MARKET, BY COUNTRY, 2022–2024 (USD MILLION)


TABLE 106
NORTH AMERICA: WIRE & CABLE COMPOUNDS MARKET, BY COUNTRY, 2022–2024 (KILOTON)


TABLE 107
NORTH AMERICA: WIRE & CABLE COMPOUNDS MARKET, BY COUNTRY, 2025–2030 (USD MILLION)


TABLE 108
NORTH AMERICA: WIRE & CABLE COMPOUNDS MARKET, BY COUNTRY, 2025–2030 (KILOTON)


TABLE 109
US: WIRE & CABLE COMPOUNDS MARKET, BY END-USE INDUSTRY, 2022–2024 (USD MILLION)


TABLE 110
US: WIRE & CABLE COMPOUNDS MARKET, BY END-USE INDUSTRY, 2022–2024 (KILOTON)


TABLE 111
US: WIRE & CABLE COMPOUNDS MARKET, BY END-USE INDUSTRY, 2025–2030 (USD MILLION)


TABLE 112
US: WIRE & CABLE COMPOUNDS MARKET, BY END-USE INDUSTRY, 2025–2030 (KILOTON)


TABLE 113
CANADA: WIRE & CABLE COMPOUNDS MARKET, BY END-USE INDUSTRY, 2022–2024 (USD MILLION)


TABLE 114
CANADA: WIRE & CABLE COMPOUNDS MARKET, BY END-USE INDUSTRY, 2022–2024 (KILOTON)


TABLE 115
CANADA: WIRE & CABLE COMPOUNDS MARKET, BY END-USE INDUSTRY, 2025–2030 (USD MILLION)


TABLE 116
CANADA: WIRE & CABLE COMPOUNDS MARKET, BY END-USE INDUSTRY, 2025–2030 (KILOTON)


TABLE 117
MEXICO: WIRE & CABLE COMPOUNDS MARKET, BY END-USE INDUSTRY, 2022–2024 (USD MILLION)


TABLE 118
MEXICO: WIRE & CABLE COMPOUNDS MARKET, BY END-USE INDUSTRY, 2022–2024 (KILOTON)


TABLE 119
MEXICO: WIRE & CABLE COMPOUNDS MARKET, BY END-USE INDUSTRY, 2025–2030 (USD MILLION)


TABLE 120
MEXICO: WIRE & CABLE COMPOUNDS MARKET, BY END-USE INDUSTRY, 2025–2030 (KILOTON)


TABLE 121
EUROPE: WIRE & CABLE COMPOUNDS MARKET, BY TYPE, 2022–2024 (USD MILLION)


TABLE 122
EUROPE: WIRE & CABLE COMPOUNDS MARKET, BY TYPE, 2022–2024 (KILOTON)


TABLE 123
EUROPE: WIRE & CABLE COMPOUNDS MARKET, BY TYPE, 2025–2030 (USD MILLION)


TABLE 124
EUROPE: WIRE & CABLE COMPOUNDS MARKET, BY TYPE, 2025–2030 (KILOTON)


TABLE 125
EUROPE: WIRE & CABLE COMPOUNDS MARKET, BY END-USE INDUSTRY, 2022–2024 (USD MILLION)


TABLE 126
EUROPE: WIRE & CABLE COMPOUNDS MARKET, BY END-USE INDUSTRY, 2022–2024 (KILOTON)


TABLE 127
EUROPE: WIRE & CABLE COMPOUNDS MARKET, BY END-USE INDUSTRY, 2025–2030 (USD MILLION)


TABLE 128
EUROPE: WIRE & CABLE COMPOUNDS MARKET, BY END-USE INDUSTRY, 2025–2030 (KILOTON)


TABLE 129
EUROPE: WIRE & CABLE COMPOUNDS MARKET, BY COUNTRY, 2022–2024 (USD MILLION)


TABLE 130
EUROPE: WIRE & CABLE COMPOUNDS MARKET, BY COUNTRY, 2022–2024 (KILOTON)


TABLE 131
EUROPE: WIRE & CABLE COMPOUNDS MARKET, BY COUNTRY, 2025–2030 (USD MILLION)


TABLE 132
EUROPE: WIRE & CABLE COMPOUNDS MARKET, BY COUNTRY, 2025–2030 (KILOTON)


TABLE 133
GERMANY: WIRE & CABLE COMPOUNDS MARKET, BY END-USE INDUSTRY, 2022–2024 (USD MILLION)


TABLE 134
GERMANY: WIRE & CABLE COMPOUNDS MARKET, BY END-USE INDUSTRY, 2022–2024 (KILOTON)


TABLE 135
GERMANY: WIRE & CABLE COMPOUNDS MARKET, BY END-USE INDUSTRY, 2025–2030 (USD MILLION)


TABLE 136
GERMANY: WIRE & CABLE COMPOUNDS MARKET, BY END-USE INDUSTRY, 2025–2030 (KILOTON)


TABLE 137
FRANCE: WIRE & CABLE COMPOUNDS MARKET, BY END-USE INDUSTRY, 2022–2024 (USD MILLION)


TABLE 138
FRANCE: WIRE & CABLE COMPOUNDS MARKET, BY END-USE INDUSTRY, 2022–2024 (KILOTON)


TABLE 139
FRANCE: WIRE & CABLE COMPOUNDS MARKET, BY END-USE INDUSTRY, 2025–2030 (USD MILLION)


TABLE 140
FRANCE: WIRE & CABLE COMPOUNDS MARKET, BY END-USE INDUSTRY, 2025–2030 (KILOTON)


TABLE 141
UK: WIRE & CABLE COMPOUNDS MARKET, BY END-USE INDUSTRY, 2022–2024 (USD MILLION)


TABLE 142
UK: WIRE & CABLE COMPOUNDS MARKET, BY END-USE INDUSTRY, 2022–2024 (KILOTON)


TABLE 143
UK: WIRE & CABLE COMPOUNDS MARKET, BY END-USE INDUSTRY, 2025–2030 (USD MILLION)


TABLE 144
UK: WIRE & CABLE COMPOUNDS MARKET, BY END-USE INDUSTRY, 2025–2030 (KILOTON)


TABLE 145
ITALY: WIRE & CABLE COMPOUNDS MARKET, BY END-USE INDUSTRY, 2022–2024 (USD MILLION)


TABLE 146
ITALY: WIRE & CABLE COMPOUNDS MARKET, BY END-USE INDUSTRY, 2022–2024 (KILOTON)


TABLE 147
ITALY: WIRE & CABLE COMPOUNDS MARKET, BY END-USE INDUSTRY, 2025–2030 (USD MILLION)


TABLE 148
ITALY: WIRE & CABLE COMPOUNDS MARKET, BY END-USE INDUSTRY, 2025–2030 (KILOTON)


TABLE 149
RUSSIA: WIRE & CABLE COMPOUNDS MARKET, BY END-USE INDUSTRY, 2022–2024 (USD MILLION)


TABLE 150
RUSSIA: WIRE & CABLE COMPOUNDS MARKET, BY END-USE INDUSTRY, 2022–2024 (KILOTON)


TABLE 151
RUSSIA: WIRE & CABLE COMPOUNDS MARKET, BY END-USE INDUSTRY, 2025–2030 (USD MILLION)


TABLE 152
RUSSIA: WIRE & CABLE COMPOUNDS MARKET, BY END-USE INDUSTRY, 2025–2030 (KILOTON)


TABLE 153
REST OF EUROPE: WIRE & CABLE COMPOUNDS MARKET, BY END-USE INDUSTRY, 2022–2024 (USD MILLION)


TABLE 154
REST OF EUROPE: WIRE & CABLE COMPOUNDS MARKET, BY END-USE INDUSTRY, 2022–2024 (KILOTON)


TABLE 155
REST OF EUROPE: WIRE & CABLE COMPOUNDS MARKET, BY END-USE INDUSTRY, 2025–2030 (USD MILLION)


TABLE 156
REST OF EUROPE: WIRE & CABLE COMPOUNDS MARKET, BY END-USE INDUSTRY, 2025–2030 (KILOTON)


TABLE 157
ASIA PACIFIC: WIRE & CABLE COMPOUNDS MARKET, BY TYPE, 2022–2024 (USD MILLION)


TABLE 158
ASIA PACIFIC: WIRE & CABLE COMPOUNDS MARKET, BY TYPE, 2022–2024 (KILOTON)


TABLE 159
ASIA PACIFIC: WIRE & CABLE COMPOUNDS MARKET, BY TYPE, 2025–2030 (USD MILLION)


TABLE 160
ASIA PACIFIC: WIRE & CABLE COMPOUNDS MARKET, BY TYPE, 2025–2030 (KILOTON)


TABLE 161
ASIA PACIFIC: WIRE & CABLE COMPOUNDS MARKET, BY END-USE INDUSTRY, 2022–2024 (USD MILLION)


TABLE 162
ASIA PACIFIC: WIRE & CABLE COMPOUNDS MARKET, BY END-USE INDUSTRY, 2022–2024 (KILOTON)


TABLE 163
ASIA PACIFIC: WIRE & CABLE COMPOUNDS MARKET, BY END-USE INDUSTRY, 2025–2030 (USD MILLION)


TABLE 164
ASIA PACIFIC: WIRE & CABLE COMPOUNDS MARKET, BY END-USE INDUSTRY, 2025–2030 (KILOTON)


TABLE 165
ASIA PACIFIC: WIRE & CABLE COMPOUNDS MARKET, BY COUNTRY, 2022–2024 (USD MILLION)


TABLE 166
ASIA PACIFIC: WIRE & CABLE COMPOUNDS MARKET, BY COUNTRY, 2022–2024 (KILOTON)


TABLE 167
ASIA PACIFIC: WIRE & CABLE COMPOUNDS MARKET, BY COUNTRY, 2025–2030 (USD MILLION)


TABLE 168
ASIA PACIFIC: WIRE & CABLE COMPOUNDS MARKET, BY COUNTRY, 2025–2030 (KILOTON)


TABLE 169
CHINA: WIRE & CABLE COMPOUNDS MARKET, BY END-USE INDUSTRY, 2022–2024 (USD MILLION)


TABLE 170
CHINA: WIRE & CABLE COMPOUNDS MARKET, BY END-USE INDUSTRY, 2022–2024 (KILOTON)


TABLE 171
CHINA: WIRE & CABLE COMPOUNDS MARKET, BY END-USE INDUSTRY, 2025–2030 (USD MILLION)


TABLE 172
CHINA: WIRE & CABLE COMPOUNDS MARKET, BY END-USE INDUSTRY, 2025–2030 (KILOTON)


TABLE 173
JAPAN: WIRE & CABLE COMPOUNDS MARKET, BY END-USE INDUSTRY, 2022–2024 (USD MILLION)


TABLE 174
JAPAN: WIRE & CABLE COMPOUNDS MARKET, BY END-USE INDUSTRY, 2022–2024 (KILOTON)


TABLE 175
JAPAN: WIRE & CABLE COMPOUNDS MARKET, BY END-USE INDUSTRY, 2025–2030 (USD MILLION)


TABLE 176
JAPAN: WIRE & CABLE COMPOUNDS MARKET, BY END-USE INDUSTRY, 2025–2030 (KILOTON)


TABLE 177
INDIA: WIRE & CABLE COMPOUNDS MARKET, BY END-USE INDUSTRY, 2022–2024 (USD MILLION)


TABLE 178
INDIA: WIRE & CABLE COMPOUNDS MARKET, BY END-USE INDUSTRY, 2022–2024 (KILOTON)


TABLE 179
INDIA: WIRE & CABLE COMPOUNDS MARKET, BY END-USE INDUSTRY, 2025–2030 (USD MILLION)


TABLE 180
TAIWAN: WIRE & CABLE COMPOUNDS MARKET, BY END-USE INDUSTRY, 2025–2030 (KILOTON)


TABLE 181
SOUTH KOREA: WIRE & CABLE COMPOUNDS MARKET, BY END-USE INDUSTRY, 2022–2024 (USD MILLION)


TABLE 182
SOUTH KOREA: WIRE & CABLE COMPOUNDS MARKET, BY END-USE INDUSTRY, 2022–2024 (KILOTON)


TABLE 183
SOUTH KOREA: WIRE & CABLE COMPOUNDS MARKET, BY END-USE INDUSTRY, 2025–2030 (USD MILLION)


TABLE 184
SOUTH KOREA: WIRE & CABLE COMPOUNDS MARKET, BY END-USE INDUSTRY, 2025–2030 (KILOTON)


TABLE 185
REST OF ASIA PACIFIC: WIRE & CABLE COMPOUNDS MARKET, BY END-USE INDUSTRY, 2022–2024 (USD MILLION)


TABLE 186
REST OF ASIA PACIFIC: WIRE & CABLE COMPOUNDS MARKET, BY END-USE INDUSTRY, 2022–2024 (KILOTON)


TABLE 187
REST OF ASIA PACIFIC: WIRE & CABLE COMPOUNDS MARKET, BY END-USE INDUSTRY, 2025–2030 (USD MILLION)


TABLE 188
REST OF ASIA PACIFIC: WIRE & CABLE COMPOUNDS MARKET, BY END-USE INDUSTRY, 2025–2030 (KILOTON)


TABLE 189
MIDDLE EAST & AFRICA: WIRE & CABLE COMPOUNDS MARKET, BY TYPE, 2022–2024 (USD MILLION)


TABLE 190
MIDDLE EAST & AFRICA: WIRE & CABLE COMPOUNDS MARKET, BY TYPE, 2022–2024 (KILOTON)


TABLE 191
MIDDLE EAST & AFRICA: WIRE & CABLE COMPOUNDS MARKET, BY TYPE, 2025–2030 (USD MILLION)


TABLE 192
MIDDLE EAST & AFRICA: WIRE & CABLE COMPOUNDS MARKET, BY TYPE, 2025–2030 (KILOTON)


TABLE 193
MIDDLE EAST & AFRICA: WIRE & CABLE COMPOUNDS MARKET, BY END-USE INDUSTRY, 2022–2024 (USD MILLION)


TABLE 194
MIDDLE EAST & AFRICA: WIRE & CABLE COMPOUNDS MARKET, BY END-USE INDUSTRY, 2022–2024 (KILOTON)


TABLE 195
MIDDLE EAST & AFRICA: WIRE & CABLE COMPOUNDS MARKET, BY END-USE INDUSTRY, 2025–2030 (USD MILLION)


TABLE 196
MIDDLE EAST & AFRICA: WIRE & CABLE COMPOUNDS MARKET, BY END-USE INDUSTRY, 2025–2030 (KILOTON)


TABLE 197
MIDDLE EAST & AFRICA: WIRE & CABLE COMPOUNDS MARKET, BY COUNTRY, 2022–2024 (USD MILLION)


TABLE 198
MIDDLE EAST & AFRICA: WIRE & CABLE COMPOUNDS MARKET, BY COUNTRY, 2022–2024 (KILOTON)


TABLE 199
MIDDLE EAST & AFRICA: WIRE & CABLE COMPOUNDS MARKET, BY COUNTRY, 2025–2030 (USD MILLION)


TABLE 200
MIDDLE EAST & AFRICA: WIRE & CABLE COMPOUNDS MARKET, BY COUNTRY 2025–2030 (KILOTON)


TABLE 201
UAE: WIRE & CABLE COMPOUNDS MARKET, BY END-USE INDUSTRY, 2022–2024 (USD MILLION)


TABLE 202
UAE: WIRE & CABLE COMPOUNDS MARKET, BY END-USE INDUSTRY, 2022–2024 (KILOTON)


TABLE 203
UAE: WIRE & CABLE COMPOUNDS MARKET, BY END-USE INDUSTRY, 2025–2030 (USD MILLION)


TABLE 204
UAE: WIRE & CABLE COMPOUNDS MARKET, BY END-USE INDUSTRY, 2025–2030 (KILOTON)


TABLE 205
SAUDI ARABIA: WIRE & CABLE COMPOUNDS MARKET, BY END-USE INDUSTRY, 2022–2024 (USD MILLION)


TABLE 206
SAUDI ARABIA: WIRE & CABLE COMPOUNDS MARKET, BY END-USE INDUSTRY, 2022–2024 (KILOTON)


TABLE 207
SAUDI ARABIA: WIRE & CABLE COMPOUNDS MARKET, BY END-USE INDUSTRY, 2025–2030 (USD MILLION)


TABLE 208
SAUDI ARABIA: WIRE & CABLE COMPOUNDS MARKET, BY END-USE INDUSTRY, 2025–2030 (KILOTON)


TABLE 209
REST OF GCC: WIRE & CABLE COMPOUNDS MARKET, BY END-USE INDUSTRY, 2022–2024 (USD MILLION)


TABLE 210
REST OF GCC: WIRE & CABLE COMPOUNDS MARKET, BY END-USE INDUSTRY, 2022–2024 (KILOTON)


TABLE 211
REST OF GCC: WIRE & CABLE COMPOUNDS MARKET, BY END-USE INDUSTRY, 2025–2030 (USD MILLION)


TABLE 212
REST OF GCC: WIRE & CABLE COMPOUNDS MARKET, BY END-USE INDUSTRY, 2025–2030 (KILOTON)


TABLE 213
SOUTH AFRICA: WIRE & CABLE COMPOUNDS MARKET, BY END-USE INDUSTRY, 2022–2024 (USD MILLION)


TABLE 214
SOUTH AFRICA: WIRE & CABLE COMPOUNDS MARKET, BY END-USE INDUSTRY, 2022–2024 (KILOTON)


TABLE 215
SOUTH AFRICA: WIRE & CABLE COMPOUNDS MARKET, BY END-USE INDUSTRY, 2025–2030 (USD MILLION)


TABLE 216
SOUTH AFRICA: WIRE & CABLE COMPOUNDS MARKET, BY END-USE INDUSTRY, 2025–2030 (KILOTON)


TABLE 217
REST OF MIDDLE EAST & AFRICA: WIRE & CABLE COMPOUNDS MARKET, BY END-USE INDUSTRY, 2022–2024 (USD MILLION)


TABLE 218
REST OF MIDDLE EAST & AFRICA: WIRE & CABLE COMPOUNDS MARKET, BY END-USE INDUSTRY, 2022–2024 (KILOTON)


TABLE 219
REST OF MIDDLE EAST & AFRICA: WIRE & CABLE COMPOUNDS MARKET, BY END-USE INDUSTRY, 2025–2030 (USD MILLION)


TABLE 220
REST OF MIDDLE EAST & AFRICA: WIRE & CABLE COMPOUNDS MARKET, BY END-USE INDUSTRY, 2025–2030 (KILOTON)


TABLE 221
SOUTH AMERICA: WIRE & CABLE COMPOUNDS MARKET, BY TYPE, 2022–2024 (USD MILLION)


TABLE 222
SOUTH AMERICA: WIRE & CABLE COMPOUNDS MARKET, BY TYPE, 2022–2024 (KILOTON)


TABLE 223
SOUTH AMERICA: WIRE & CABLE COMPOUNDS MARKET, BY TYPE, 2025–2030 (USD MILLION)


TABLE 224
SOUTH AMERICA: WIRE & CABLE COMPOUNDS MARKET, BY TYPE, 2025–2030 (KILOTON)


TABLE 225
SOUTH AMERICA: WIRE & CABLE COMPOUNDS MARKET, BY END-USE INDUSTRY, 2022–2024 (USD MILLION)


TABLE 226
SOUTH AMERICA: WIRE & CABLE COMPOUNDS MARKET, BY END-USE INDUSTRY, 2022–2024 (KILOTON)


TABLE 227
SOUTH AMERICA: WIRE & CABLE COMPOUNDS MARKET, BY END-USE INDUSTRY, 2025–2030 (USD MILLION)


TABLE 228
SOUTH AMERICA: WIRE & CABLE COMPOUNDS MARKET, BY END-USE INDUSTRY, 2025–2030 (KILOTON)


TABLE 229
SOUTH AMERICA: WIRE & CABLE COMPOUNDS MARKET, BY COUNTRY, 2022–2024 (USD MILLION)


TABLE 230
SOUTH AMERICA: WIRE & CABLE COMPOUNDS MARKET, BY COUNTRY, 2022–2024 (KILOTON)


TABLE 231
SOUTH AMERICA: WIRE & CABLE COMPOUNDS MARKET, BY COUNTRY, 2025–2030 (USD MILLION)


TABLE 232
SOUTH AMERICA: WIRE & CABLE COMPOUNDS MARKET, BY COUNTRY, 2025–2030 (KILOTON)


TABLE 233
BRAZIL: WIRE & CABLE COMPOUNDS MARKET, BY END-USE INDUSTRY, 2022–2024 (USD MILLION)


TABLE 234
BRAZIL: WIRE & CABLE COMPOUNDS MARKET, BY END-USE INDUSTRY, 2022–2024 (KILOTON)


TABLE 235
BRAZIL: WIRE & CABLE COMPOUNDS MARKET, BY END-USE INDUSTRY, 2025–2030 (USD MILLION)


TABLE 236
BRAZIL: WIRE & CABLE COMPOUNDS MARKET, BY END-USE INDUSTRY, 2025–2030 (KILOTON)


TABLE 237
ARGENTINA: WIRE & CABLE COMPOUNDS MARKET, BY END-USE INDUSTRY, 2022–2024 (USD MILLION)


TABLE 238
ARGENTINA: WIRE & CABLE COMPOUNDS MARKET, BY END-USE INDUSTRY, 2022–2024 (KILOTON)


TABLE 239
ARGENTINA: WIRE & CABLE COMPOUNDS MARKET, BY END-USE INDUSTRY, 2025–2030 (USD MILLION)


TABLE 240
ARGENTINA: WIRE & CABLE COMPOUNDS MARKET, BY END-USE INDUSTRY, 2025–2030 (KILOTON)


TABLE 241
REST OF SOUTH AMERICA: WIRE & CABLE COMPOUNDS MARKET, BY END-USE INDUSTRY, 2022–2024 (USD MILLION)


TABLE 242
REST OF SOUTH AMERICA: WIRE & CABLE COMPOUNDS MARKET, BY END-USE INDUSTRY, 2022–2024 (KILOTON)


TABLE 243
REST OF SOUTH AMERICA: WIRE & CABLE COMPOUNDS MARKET, BY END-USE INDUSTRY, 2025–2030 (USD MILLION)


TABLE 244
REST OF SOUTH AMERICA: WIRE & CABLE COMPOUNDS MARKET, BY END-USE INDUSTRY, 2025–2030 (KILOTON)


TABLE 245
WIRE & CABLE COMPOUNDS MARKET: OVERVIEW OF KEY STRATEGIES ADOPTED BY MAJOR PLAYERS, JANUARY 2020–JUNE 2025


TABLE 246
WIRE & CABLE COMPOUNDS MARKET: DEGREE OF COMPETITION, 2024


TABLE 4
WIRE & CABLE COMPOUNDS MARKET: REGION FOOTPRINT


TABLE 247
WIRE & CABLE COMPOUNDS MARKET: TYPE FOOTPRINT


TABLE 248
WIRE & CABLE COMPOUNDS MARKET: APPLICATION FOOTPRINT


TABLE 249
WIRE & CABLE COMPOUNDS MARKET: END-USE INDUSTRY FOOTPRINT


TABLE 250
WIRE & CABLE COMPOUNDS MARKET: DETAILED LIST OF KEY STARTUPS/SMES


TABLE 251
WIRE & CABLE COMPOUNDS MARKET: COMPETITIVE BENCHMARKING OF KEY STARTUPS/SMES


TABLE 252
WIRE & CABLE COMPOUNDS MARKET: PRODUCT LAUNCHES, JANUARY 2020–JUNE 2025


TABLE 253
WIRE & CABLE COMPOUNDS MARKET: DEALS, JANUARY 2020–JUNE 2025


TABLE 254
WIRE & CABLE COMPOUNDS MARKET: EXPANSIONS, JANUARY 2020–JUNE 2025


TABLE 255
BOREALIS GMBH: COMPANY OVERVIEW


TABLE 256
BOREALIS GMBH: PRODUCTS OFFERED


TABLE 257
BOREALIS GMBH: DEALS


TABLE 258
BOREALIS GMBH: EXPANSIONS


TABLE 259
SYENSQO: COMPANY OVERVIEW


TABLE 260
SYENSQO: PRODUCTS OFFERED


TABLE 261
SYENSQO: DEALS


TABLE 262
EVONIK INDUSTRIES: COMPANY OVERVIEW


TABLE 263
EVONIK INDUSTRIES: PRODUCTS OFFERED


TABLE 264
DUPONT: COMPANY OVERVIEW


TABLE 265
DUPONT: PRODUCTS OFFERED


TABLE 266
AVIENT CORPORATION: COMPANY OVERVIEW


TABLE 267
AVIENT CORPORATION: PRODUCTS OFFERED


TABLE 268
AVIENT CORPORATION: PRODUCT LAUNCHES


TABLE 269
EASTMAN CHEMICAL COMPANY: COMPANY OVERVIEW


TABLE 270
EASTMAN CHEMICAL COMPANY: PRODUCTS OFFERED


TABLE 271
EXXON MOBIL CORPORATION: COMPANY OVERVIEW


TABLE 272
EXXON MOBIL CORPORATION: PRODUCTS OFFERED


TABLE 273
EXXON MOBIL CORPORATION: EXPANSIONS


TABLE 274
HANWHA SOLUTIONS CORPORATION: COMPANY OVERVIEW


TABLE 275
HANWHA SOLUTIONS CORPORATION: PRODUCTS OFFERED


TABLE 276
SCG: COMPANY OVERVIEW


TABLE 277
SCG: PRODUCTS OFFERED


TABLE 278
TRELLEBORG AB: COMPANY OVERVIEW


TABLE 279
TRELLEBORG AB: PRODUCTS OFFERED


TABLE 280
ELECTRIC CABLE COMPOUNDS, INC.: COMPANY OVERVIEW


TABLE 281
ELECTRIC CABLE COMPOUNDS: PRODUCTS OFFERED


TABLE 282
ORBIA: COMPANY OVERVIEW


TABLE 283
ORBIA: PRODUCTS OFFERED


TABLE 284
ORBIA: DEALS


TABLE 285
RIKEN TECHNOS CORP: COMPANY OVERVIEW


TABLE 286
RIKEN TECHNOS CORP: PRODUCTS OFFERED


TABLE 287
RIKEN TECHNOS CORP: EXPANSIONS


TABLE 288
MELOS GMBH: COMPANY OVERVIEW


TABLE 289
MELOS GMBH: PRODUCTS OFFERED


TABLE 290
ENEOS NUC CORPORATION: COMPANY OVERVIEW


TABLE 291
ENEOS NUC CORPORATION: PRODUCTS OFFERED


TABLE 292
ENEOS NUC CORPORATION: EXPANSIONS


TABLE 293
VITAHCO: COMPANY OVERVIEW


TABLE 294
HEBEI SUNUA ADVANCED MATERIAL CO., LTD.: COMPANY OVERVIEW


TABLE 295
OTECH CORPORATION: COMPANY OVERVIEW


TABLE 296
GUANGDONG ADVANCED THERMOPLASTIC POLYMER TECHNOLOGY CO., LTD.: COMPANY OVERVIEW


TABLE 297
SACO AEI POLYMERS: COMPANY OVERVIEW


TABLE 298
SILON: COMPANY OVERVIEW


TABLE 299
CONDOR COMPOUNDS GMBH: COMPANY OVERVIEW


TABLE 300
INPVC: COMPANY OVERVIEW


TABLE 301
PREMIX GROUP: COMPANY OVERVIEW


TABLE 302
CABLE COMPOUNDS GROUP: COMPANY OVERVIEW


LIST OF FIGURES


FIGURE 1
WIRE & CABLE COMPOUNDS: MARKET SEGMENTATION AND REGIONAL SNAPSHOT


FIGURE 2
WIRE & CABLE COMPOUNDS MARKET: RESEARCH DESIGN


FIGURE 3
WIRE & CABLE MARKET: BOTTOM-UP APPROACH


FIGURE 4
WIRE & CABLE COMPOUNDS MARKET: TOP-DOWN APPROACH


FIGURE 5
WIRE & CABLE COMPOUNDS MARKET: DATA TRIANGULATION


FIGURE 6
NON-HALOGENATED POLYMERS TO LEAD WIRE & CABLE COMPOUNDS MARKET


FIGURE 7
BUILDING WIRES TO LEAD MARKET DURING FORECAST PERIOD


FIGURE 8
CONSTRUCTION SEGMENT TO LEAD MARKET DURING FORECAST PERIOD


FIGURE 9
ASIA PACIFIC TO REGISTER HIGHEST GROWTH DURING FORECAST PERIOD


FIGURE 10
EXPANDING POWER GRID AND RENEWABLE PROJECTS TO DRIVE MARKET BETWEEN 2025 AND 2030


FIGURE 11
CONSTRUCTION AND ASIA PACIFIC REGION LED MARKET IN 2024


FIGURE 12
NON-HALOGENATED POLYMERS TO REGISTER HIGHEST CAGR DURING FORECAST PERIOD


FIGURE 13
BUILDING WIRES TO REGISTER HIGHEST CAGR DURING FORECAST PERIOD


FIGURE 14
CONSTRUCTION TO REGISTER HIGHEST CAGR DURING FORECAST PERIOD


FIGURE 15
CHINA TO REGISTER HIGHEST CAGR DURING FORECAST PERIOD


FIGURE 16
DRIVERS, RESTRAINTS, OPPORTUNITIES, AND CHALLENGES IN WIRE & CABLE COMPOUNDS MARKET


FIGURE 17
WIRE & CABLE COMPOUNDS MARKET: PORTER’S FIVE FORCES ANALYSIS


FIGURE 18
INFLUENCE OF STAKEHOLDERS ON BUYING PROCESS, BY END-USE INDUSTRY


FIGURE 19
KEY BUYING CRITERIA, BY END-USE INDUSTRY


FIGURE 20
WIRE & CABLE COMPOUNDS MARKET: VALUE CHAIN ANALYSIS


FIGURE 21
WIRE & CABLE COMPOUNDS MARKET: KEY PLAYERS IN ECOSYSTEM


FIGURE 22
WIRE & CABLE COMPOUNDS MARKET: ECOSYSTEM ANALYSIS


FIGURE 23
AVERAGE SELLING PRICE OF WIRE & CABLE COMPOUNDS AMONG END-USE INDUSTRIES, BY KEY PLAYER, 2024 (USD/KG)


FIGURE 24
AVERAGE SELLING PRICE TREND OF WIRE & CABLE COMPOUNDS, BY TYPE, 2022–2025 (USD/KG)


FIGURE 25
AVERAGE SELLING PRICE TREND OF WIRE & CABLE COMPOUNDS, BY APPLICATION, 2022–2025 (USD/KG)


FIGURE 26
AVERAGE SELLING PRICE OF WIRE & CABLE COMPOUNDS, BY REGION, 2022–2025 (USD/KG)


FIGURE 27
IMPORT DATA RELATED TO HS CODE 761410, BY KEY COUNTRY, 2020–2024 (USD MILLION)


FIGURE 28
EXPORT DATA RELATED TO HS CODE 761410, BY KEY COUNTRY, 2020–2024 (USD MILLION)


FIGURE 29
PATENT ANALYSIS, BY DOCUMENT TYPE, JANUARY 2015–JUNE 2025


FIGURE 30
PATENT PUBLICATION TRENDS, 2015−2024


FIGURE 31
JURISDICTION OF CHINA REGISTERED HIGHEST NUMBER OF PATENTS BETWEEN JANUARY 2015 AND JULY 2025


FIGURE 32
TOP PATENT APPLICANTS, JANUARY 2015–JULY 2025


FIGURE 33
TRENDS AND DISRUPTIONS IMPACTING CUSTOMER BUSINESS


FIGURE 34
INVESTOR DEALS AND FUNDING IN WIRE & CABLE COMPOUNDS MARKET, 2020–2024 (NUMBER OF DEALS AND USD MILLION)


FIGURE 36
BUILDING WIRES SEGMENT TO LEAD WIRE & CABLE COMPOUNDS MARKET DURING FORECAST PERIOD


FIGURE 37
CONSTRUCTION INDUSTRY TO LEAD WIRE & CABLE COMPOUNDS MARKET DURING FORECAST PERIOD


FIGURE 38
CHINA TO BE FASTEST-GROWING WIRE & CABLE COMPOUNDS MARKET DURING FORECAST PERIOD


FIGURE 39
NORTH AMERICA: WIRE & CABLE COMPOUNDS MARKET SNAPSHOT


FIGURE 40
EUROPE: WIRE & CABLE COMPOUNDS MARKET SNAPSHOT


FIGURE 41
ASIA PACIFIC: WIRE & CABLE COMPOUNDS MARKET SNAPSHOT


FIGURE 42
WIRE & CABLE COMPOUNDS MARKET: REVENUE ANALYSIS OF KEY PLAYERS, 2020–2024 (USD MILLION)


FIGURE 43
WIRE & CABLE COMPOUNDS MARKET SHARE ANALYSIS, 2024


FIGURE 44
WIRE & CABLE COMPOUNDS MARKET: BRAND/PRODUCT COMPARISON


FIGURE 45
WIRE & CABLE COMPOUNDS MARKET: COMPANY EVALUATION MATRIX, KEY PLAYERS, 2024


FIGURE 46
WIRE & CABLE COMPOUNDS MARKET: COMPANY FOOTPRINT


FIGURE 47
WIRE & CABLE COMPOUNDS MARKET: COMPANY EVALUATION MATRIX, STARTUPS/SMES, 2024


FIGURE 48
WIRE & CABLE COMPOUNDS MARKET: EV/EBITDA OF KEY MANUFACTURERS


FIGURE 49
WIRE & CABLE COMPOUNDS MARKET: ENTERPRISE VALUATION OF KEY PLAYERS


FIGURE 50
YEAR-TO-DATE (YTD) PRICE TOTAL RETURN AND 5-YEAR STOCK BETA OF KEY VENDORS


FIGURE 51
SYENSQO: COMPANY SNAPSHOT


FIGURE 52
EVONIK INDUSTRIES AG: COMPANY SNAPSHOT


FIGURE 53
DUPONT: COMPANY SNAPSHOT


FIGURE 54
AVIENT CORPORATION: COMPANY SNAPSHOT


FIGURE 55
EASTMAN CHEMICAL COMPANY: COMPANY SNAPSHOT


FIGURE 56
EXXON MOBIL CORPORATION: COMPANY SNAPSHOT


FIGURE 57
HANWHA SOLUTIONS CORPORATION: COMPANY SNAPSHOT


FIGURE 58
SCG: COMPANY SNAPSHOT


FIGURE 59
TRELLEBORG AB: COMPANY SNAPSHOT


FIGURE 60
ORBIA: COMPANY SNAPSHOT


FIGURE 61
RIKEN TECHNOS CORP: COMPANY SNAPSHOT


Methodology

The study involves two major activities in estimating the current market size for the wire and cable compound market. Exhaustive secondary research was done to collect information on the market, peer market, and parent market. The next step was to validate these findings, assumptions, and sizing with industry experts across the value chain through primary research. Both top-down and bottom-up approaches were employed to estimate the complete market size. After that, market breakdown and data triangulation were used to estimate the market size of segments and subsegments.

Secondary Research

Secondary sources referred to for this research study include financial statements of companies offering wire and cable compounds and information from various trade, business, and professional associations. Secondary research has been used to obtain critical information about the industry’s value chain, the total pool of key players, market classification, and segmentation according to industry trends to the bottom-most level, and regional markets. The secondary data was collected and analyzed to arrive at the overall size of the wire and cable compound market, which was validated by primary respondents.

Primary Research

Extensive primary research was conducted after obtaining information regarding the wire and cable compound market scenario through secondary research. Several primary interviews were conducted with market experts from both the demand and supply sides across major countries of North America, Europe, Asia Pacific, the Middle East & Africa, and South America. Primary data was collected through questionnaires, emails, and telephonic interviews. The primary sources from the supply side included various industry experts, such as chief experience officers (CXOs), vice presidents (VPs), business development/marketing directors, product development/innovation teams, related key executives from the wire and cable compound industry, system integrators, component providers, distributors, and key opinion leaders.

Primary interviews were conducted to gather insights such as market statistics, data on revenue collected from the products and services, market breakdowns, market size estimations, market forecasting, and data triangulation. Primary research also helped in understanding the various trends related to product type, end-use industry, and region. Stakeholders from the demand side, such as CIOs, CTOs, CSOs, and installation teams of the customers/end users who use wire and cables, were interviewed to understand the buyer’s perspective on the suppliers, products, component providers, and their current usage of wire and cable compound and future outlook of their business which will affect the overall market.

Breakdown of Primary Research:

Wire and Cable Compound Market

To know about the assumptions considered for the study, download the pdf brochure

Market Size Estimation

The research methodology used to estimate the size of the wire and cable compound market includes the following details. The market size was determined from the demand side. The market was upsized based on the demand for wire and cable compounds in different applications at the regional level. These procurements offer insights into the demand side of the wire and cable compound industry for each end-use sector. For every end-use sector, all relevant segments of the wire and cable compound market have been integrated and mapped.

Wire and Cable Compound Market

Data Triangulation

After arriving at the overall size from the market size estimation process explained above, the total market was split into several segments and subsegments. The data triangulation and market breakdown procedures explained below were implemented, wherever applicable, to complete the overall market engineering process and arrive at the exact statistics for various market segments and subsegments. The data was triangulated by studying various factors and trends from the demand and supply sides. Along with this, the market size was validated using both the top-down and bottom-up approaches.

Market Definition

Wire and cable compounds are specialty application materials used to formulate insulation and jacketing materials for wires & cables. They are also used in manufacturing semi-conductive shields for cables. These wire & cable compounds offer enhanced quality and performance standards, which include new standards for safety, sustainability, and reliability as they provide high insulation properties. These wire & cable compounds are used in construction, power, communication, and automotive industries. Wire & cable compounds have a major role in coating wires & cables as they provide safety insulation to conducting wires.

Stakeholders

  • Wire and Cable Compound Manufacturers
  • Wire and Cable Compound Distributors and Suppliers
  • Universities, Governments, and Research Organizations
  • Associations and Industrial Bodies
  • R&D Institutes
  • Environmental Support Agencies
  • Investment Banks and Private Equity Firms
  • Research and Consulting Firms

Report Objectives

  • To define, describe, and forecast the wire and cable compound market size in terms of volume and value
  • To provide detailed information regarding the key factors, such as drivers, restraints, opportunities, and challenges influencing market growth
  • To analyze and project the global wire and cable compound market by source, application, and region
  • To forecast the market size concerning five main regions (along with country-level data), namely, North America, Europe, Asia Pacific, the Middle East & Africa, and South America, and analyze the significant region-specific trends
  • To strategically analyze micro markets with respect to individual growth trends, prospects, and contributions of the submarkets to the overall market
  • To analyze the market opportunities and the competitive landscape for stakeholders and market leaders
  • To assess recent market developments and competitive strategies, such as agreements, contracts, acquisitions, and product developments/product launches, to draw the competitive landscape
  • To strategically profile the key market players and comprehensively analyze their core competencies


Key Questions Addressed by the Report

Who are the major players in the wire and cable compound market? What key strategies have market players adopted to strengthen their market presence?

Major players include Borealis GmbH (Austria), Dow (US), Syensqo (Belgium), Evonik Industries AG (Germany), DuPont (US), Avient Corporation (US), Eastman Chemical Company (US), Exxon Mobil Corporation (US), Hanwha Solutions Corporation (South Korea), SCG (Thailand), and others.

What are the drivers and opportunities for the wire and cable compound market?

Increased public and private investment in renewable energy, and growing demand for lightweight, fuel-efficient vehicles in the automotive sector are key market drivers and opportunities.

Which region is expected to hold the largest market share?

North America is projected to hold the largest market share, driven by demand from construction, power, communication, automotive, and other end-use industries.

What is the projected growth rate of the wire and cable compound market over the next five years?

The market is expected to grow at a CAGR of 7.8% during the forecast period.

How is the wire and cable compound market aligned for future growth?

The market is growing rapidly, fueled by rising demand from a broad range of industries including energy, construction, automotive, and telecommunications.

Personalize This Research

  • Triangulate with your Own Data
  • Get Data as per your Format and Definition
  • Gain a Deeper Dive on a Specific Application, Geography, Customer or Competitor
  • Any level of Personalization
Request A Free Customisation

Let Us Help You

  • What are the Known and Unknown Adjacencies Impacting the Wire and Cable Compound Market
  • What will your New Revenue Sources be?
  • Who will be your Top Customer; what will make them switch?
  • Defend your Market Share or Win Competitors
  • Get a Scorecard for Target Partners
Customized Workshop Request

Custom Market Research Services

We Will Customise The Research For You, In Case The Report Listed Above Does Not Meet With Your Requirements

Get 10% Free Customisation

Growth opportunities and latent adjacency in Wire and Cable Compound Market

DMCA.com Protection Status