
Fluoropolymer Tubing Market

Fluoropolymer Tubing Market by Material (PTFE, FEP, PFA, ETFE, PVDF, and Others), Form Factor (Heat Shrink, Single Lumen, Co-extruded, Multi Lumen, Tapered or Bump Tubing, Braided Tubing), Application, and Region - Global Forecast to 2030


OVERVIEW
Source: Secondary Research, Interviews with Experts, MarketsandMarkets Analysis
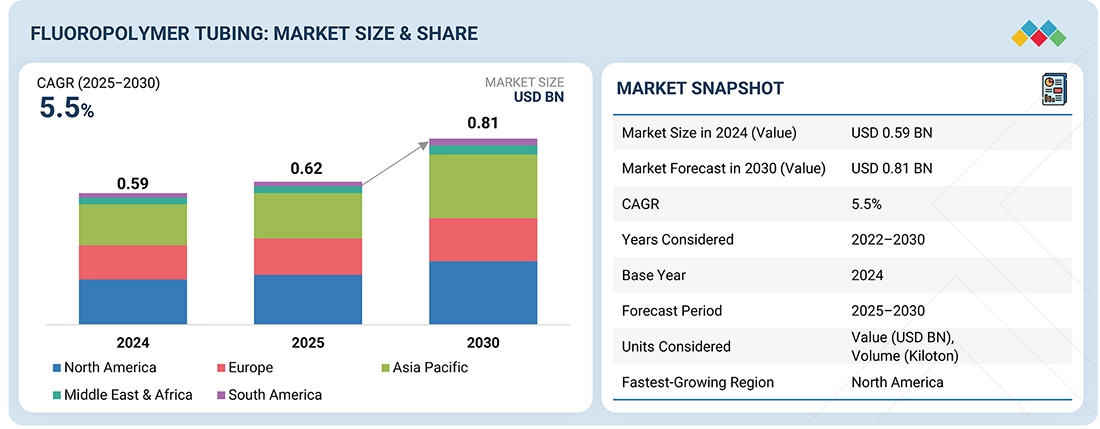
The fluoropolymer tubing market is projected to reach USD 813.5 million in 2030 from USD 622.5 million in 2025, registering a CAGR of 5.5% during the forecast period. The market is mainly driven by the superior performance of fluoropolymers over traditional materials. Fluoropolymer tubing is known for its excellent chemical resistance, ability to withstand high temperatures, low-friction, and non-stick properties.
KEY TAKEAWAYS
-
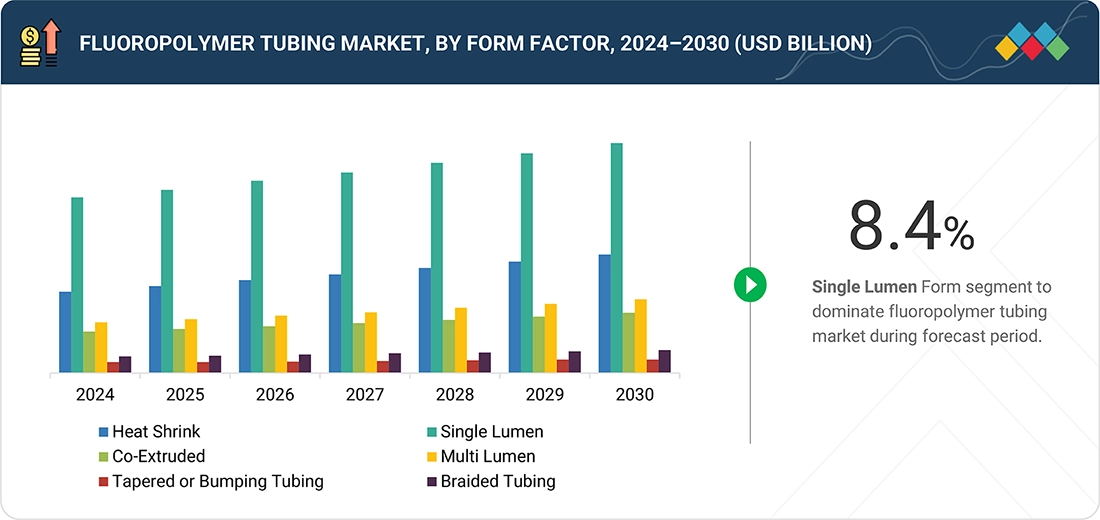
BY FORM FACTORThe fluoropolymer tubing market comprises heat-shrink, single-lumen, co-extruded, multi-lumen, tapered or bump tubing, and braided tubing. Single-lumen holds the largest market share as it is widely used for large-scale applications. Its versatility supports adoption across various industries, including automotive, aerospace, energy, and fluid management, where it is commonly used for the safe transfer of gases and liquids. Regulatory compliance is easier to achieve for single-lumen tubing, ensuring quicker approvals in both medical and industrial sectors. Combined with the durability, biocompatibility, chemical resistance, and high-temperature performance of fluoropolymers, these factors collectively position single-lumen tubing as the leading form in the fluoropolymer tubing market.
-
BY MATERIALKey fluoropolymer tubing include PTFE, FEP, PFA, ETFE, PVDF and Other materials. The FEP (fluorinated ethylene propylene) segment is projected to register the fastest growth, by material, in the fluoropolymer tubing market. FEB is an exceptionally strong performer that effectively balances performance, versatility, and a selection of potentially more cost-effective alternatives. FEP tubing offers excellent chemical resistance, good non-stick properties, and high thermal stability, making it suitable for various industries, including medical, electronics, chemical processing, and aerospace.
-
BY APPLICATIONKey applications are medical, semiconductor, energy, oil & gas, aerospace, automotive, fluid management, general industrial, and other applications. The medical application segment holds the largest share of the fluoropolymer tubing market due to the unique characteristics of fluoropolymers, which make them ideal for healthcare applications, particularly given the stringent regulatory requirements in this sector.
-
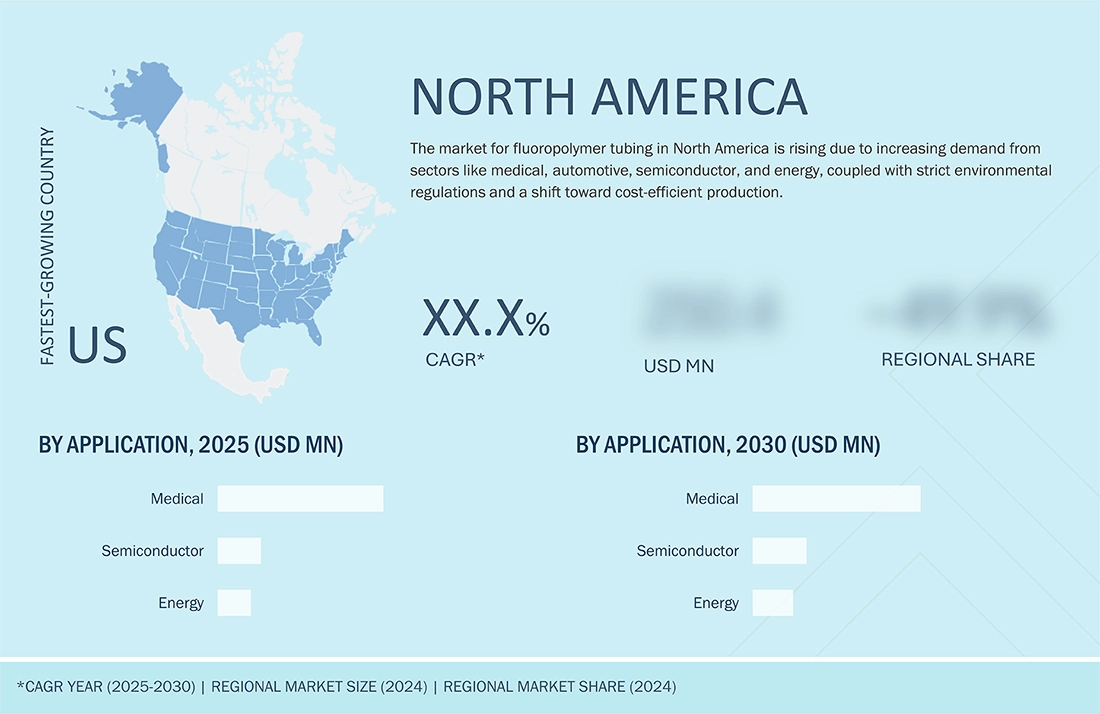
BY REGIONThe fluoropolymer tubing market covers Europe, North America, Asia Pacific, South America, the Middle East, and Africa. North America is the largest market for fluoropolymer tubing and is home to several prominent medical, semiconductor and automotive companies. These industries have made substantial investments in chip manufacturing and clean-room facilities. Furthermore, the region's focus on renewable energy and fuel cell technologies has created additional opportunities for advanced tubing systems.
-
COMPETITIVE LANDSCAPEMajor market players have adopted both organic and inorganic strategies, including partnerships and investments. For instance, Saint-Gobain (France), Zeus Company LLC (US), and Optinova (Finland) have entered into several agreements and partnerships to meet the growing demand for fluoropolymer tubing across various end-use industries.
The growing demand for minimally invasive medical procedures is leading to an increased use of fluoropolymer tubing in products such as catheters and guidewires, as well as in other healthcare applications. Additionally, the electronics and semiconductor industries are driving market growth due to their need for ultrapure and chemically inert tubing for various applications. In the automotive sector, fluoropolymer tubing is increasingly being adopted to meet the fuel handling requirements associated with emission controls, particularly for more environmentally friendly vehicles and electric vehicles.
TRENDS & DISRUPTIONS IMPACTING CUSTOMERS' CUSTOMERS
The impact on consumers' business emerges from customer trends or disruptions. Hotbets are clients of fluoropolymer tubing manufacturers, and target applications are clients of fluoropolymer tubing manufacturers. Shifts, which are changing trends or disruptions, will impact the revenues of end users. The revenue impact on end users will affect the revenue of hotbets, which will further affect the revenues of fluoropolymer tubing manufacturers.
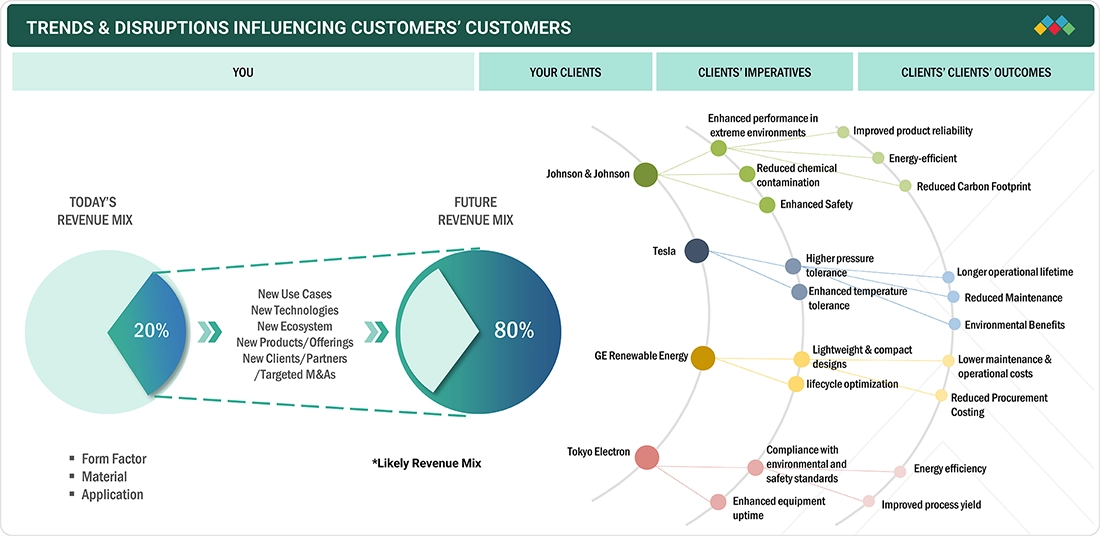
Source: Secondary Research, Interviews with Experts, MarketsandMarkets Analysis
MARKET DYNAMICS
Level
-
Growing demand for electric vehicles

-
Increasing use of fluoropolymer tubing in solar energy sector

Level
-
Higher cost of fluoropolymers than conventional materials

-
Environmental sustainability

Level
-
Increasing healthcare investments in emerging economies

-
Emerging market for melt extrusion

Level
-
Difficulty in processing high-performance fluoropolymers

-
Intense competition from low-cost suppliers in China

Source: Secondary Research, Interviews with Experts, MarketsandMarkets Analysis
Driver: Growing demand for electric vehicles
The growing demand for electric vehicles (EVs) is significantly driving the fluoropolymer tubing market. Fluoropolymer materials are essential for addressing crucial needs in thermal electronics and electrical systems, ensuring safety, efficiency, and reliability. The automotive components in EVs must meet high voltage, high temperature, and aggressive fluid exposure requirements for long-term dependability and performance. Fluoropolymer tubing excels in these areas, providing superior properties compared to other materials.
Restraint: Higher cost of fluoropolymers than conventional materials
The higher cost of fluoropolymers compared to conventional materials poses a challenge for the fluoropolymer tubing market. Fluoropolymers such as PTFE, FEP, and PFA require advanced processing methods, specialized equipment, and high-purity raw materials, all of which contribute to higher production costs. In contrast, conventional plastics like polyvinyl chloride (PVC), polyethylene, and polypropylene are significantly cheaper to produce and often suffice for many applications without the need for the superior performance characteristics of fluoropolymers.
Opportunity: Increasing healthcare investments in emerging economies
Increasing healthcare investments in emerging markets present a significant opportunity for the fluoropolymer tubing market as these regions enhance their medical infrastructure and adopt advanced technologies. Across Asia Pacific, Latin America, and the Middle East, healthcare expenditures are rising due to an expanding population, a growing burden of chronic diseases, and government mandates for improvements in medical services. This growth drives the demand for high-performance medical devices, surgical instruments, and diagnostic equipment, where fluoropolymer tubing plays a crucial role due to its biocompatibility, chemical resistance, non-stick properties, and sterilization capabilities.
Challenge: Difficulty in processing high-performance fluoropolymers
Processing high-performance fluoropolymers presents a fundamental challenge in the fluoropolymer tubing market. These materials, such as PTFE, PFA, and FEP, have unique properties that make fabrication more complex and expensive. Fluoropolymers melt at extremely high temperatures, are chemically inert, and possess very low surface energy, which means they do not stick easily to other materials. As a result, conventional methods like extrusion, molding, and joining with adhesives or welds are not feasible.
Fluoropolymer Tubing Market: COMMERCIAL USE CASES ACROSS INDUSTRIES
| COMPANY | USE CASE DESCRIPTION | BENEFITS |
|---|---|---|
 |
Fluoropolymer tubing is employed in medical devices such as catheters, endoscopes, and infusion systems. | Ensures durability and safety when exposed to various medical fluids, Reduces the risk of adverse reactions in patients |
 |
It is utilized in chemical distribution systems and wafer cleaning applications within semiconductor fabrication. | Minimizes contamination risks, ensuring quality in chip production. Protects against aggressive chemicals used in semiconductor processes |
 |
Fluoropolymer tubing is applied in power generation and distribution systems, including in transformers and circuit breakers. | Prevents short circuits and enhances safety. Withstands high temperatures, ensuring reliable performance. Resists degradation from exposure to various chemicals |
 |
It is employed in aircraft fuel systems, hydraulic lines, and environmental control systems. | Ensures longevity and safety in harsh environments. Reduces wear and tear on components, extending service life. Contributes to overall weight reduction in aircraft design |
Logos and trademarks shown above are the property of their respective owners. Their use here is for informational and illustrative purposes only.
MARKET ECOSYSTEM
The ecosystem of fluoropolymer tubing is influenced by primary suppliers, manufacturers, distributors, and end-use industries. Raw materials suppliers, which are primarily resin producers, supply materials such as PTFE, FEP, and PFA, which are processed by the tubing manufacturers into specialized modified products through the processes of extrusion and heat-shrinking. The distributors and channel partners connect with the market across product reach in various regions for industries that include medical devices, semiconductors, aerospace, automotive, and chemical processing. Regulatory bodies and the standards organizations advance the safety and compliance of the fluoropolymer tubing business primarily in the sectors of healthcare and electronics. The ecosystem of fluoropolymer tubing enhances the development and integration of superior concepts, quality, and effective replacements for existing products worldwide.
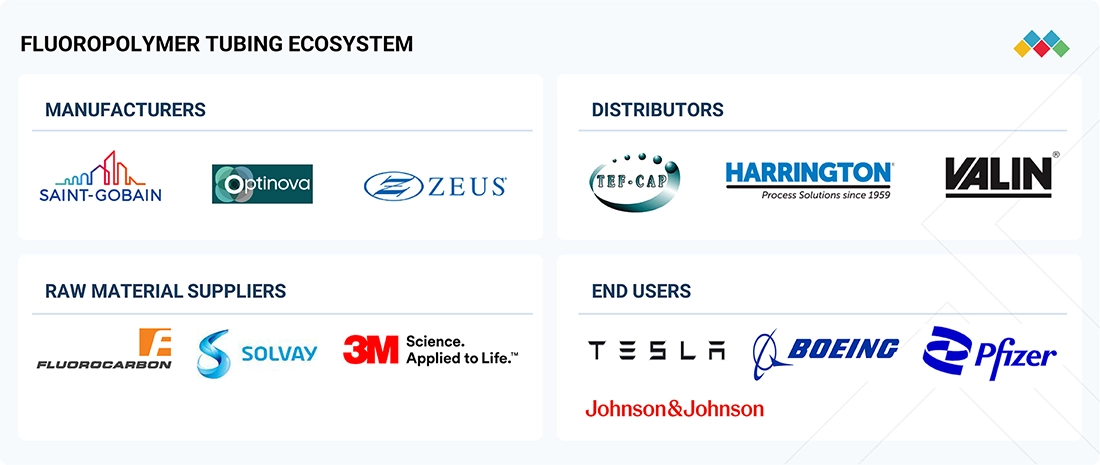
Logos and trademarks shown above are the property of their respective owners. Their use here is for informational and illustrative purposes only.
MARKET SEGMENTS
Source: Secondary Research, Interviews with Experts, MarketsandMarkets Analysis
Fluoropolymer Tubing Market, by Form Factor
The single-lumen form factor dominates the fluoropolymer tubing market primarily due to its simplicity, versatility, and cost-effectiveness. Unlike multi-lumen tubing, which requires precise extrusion and stringent quality control, single-lumen tubing has a straightforward design with just one hollow channel, making it easier and cheaper to manufacture. Its versatility allows it to serve a wide range of applications, including medical devices, semiconductor chemical delivery, and fluid management in aerospace and automotive industries, where a single channel is sufficient for most fluid or gas transport needs.
Fluoropolymer Tubing Market, by Material
The FEP (fluorinated ethylene propylene) segment is projected to register the fastest growth, by material, in the fluoropolymer tubing market. FEB is an exceptionally strong performer that effectively balances performance, versatility, and a selection of potentially more cost-effective alternatives. FEP tubing offers excellent chemical resistance, good non-stick properties, and high thermal stability, making it suitable for various industries, including medical, electronics, chemical processing, and aerospace. In medical applications, FEP is valued for its unique biocompatibility and resistance to sterilization, making it ideal for catheters, fluid management systems, surgical tools, and more extensive implantable devices.
Fluoropolymer Tubing Market, by Application
The medical application segment holds the largest share of the fluoropolymer tubing market due to the unique characteristics of fluoropolymers that make them ideal for healthcare applications, particularly given the strict regulatory requirements in this sector. Fluoropolymer tubing is biocompatible, chemically resistant, non-stick, and thermally stable, making it exceptionally well-suited for critical healthcare applications, including catheters, intravenous (IV) drug delivery systems, endoscopes, surgical tools, and diagnostic materials. The smooth inner surface of the tubing facilitates safe fluid transport within healthcare devices.
REGION
North America to be fastest-growing region in global fluoropolymer tubing market during forecast period
North America is projected to be the largest market for fluoropolymer tubing during the forecast period. The primary drivers include a strong industrial base, rapid technology adoption, and high demand in major end markets. The well-established healthcare sector in North America utilizes fluoropolymer tubing for applications such as catheters, intravenous systems, surgical instruments, and diagnostic devices. This demand is fueled by a rise in chronic diseases and an increasing preference for minimally invasive surgeries. Additionally, the aerospace and defense industries are significant consumers of fluoropolymer tubing in North America. High-tech sectors, such as semiconductors and electronics, require ultra-pure and chemically resistant tubing.
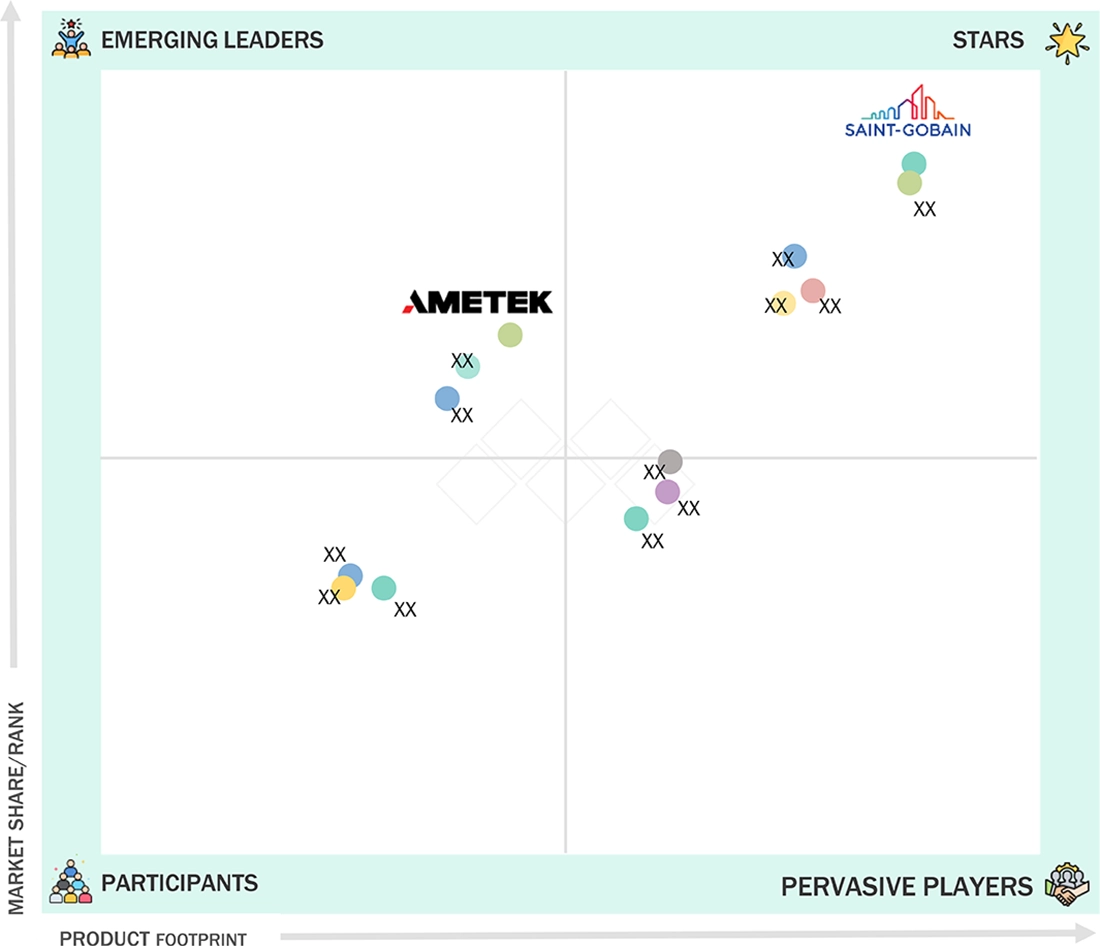
Fluoropolymer Tubing Market: COMPANY EVALUATION MATRIX
In the fluoropolymer tubing market matrix, Saint-Gobain (Star) leads with a strong market share and extensive product footprint, driven by its high-performance fluoropolymer tubes widely adopted across medical, semiconductor, and aerospace applications. AMETEK, Inc (Emerging Leader) is gaining visibility with its specialized tubing solutions and tailored offerings for critical fluid and chemical handling, strengthening its position through innovation and niche applications. While Saint-Gobain maintains dominance through scale and a broad product portfolio spanning multiple industries, AMETEK, Inc shows significant potential to move toward the leaders’ quadrant as demand for chemically resistant, high-purity, and temperature-stable tubing continues to rise.
Source: Secondary Research, Interviews with Experts, MarketsandMarkets Analysis
KEY MARKET PLAYERS
MARKET SCOPE
| REPORT METRIC | DETAILS |
|---|---|
| Market Size in 2024 (Value) | USD 0.59 Billion |
| Market Forecast in 2030 (value) | USD 0.81 Billion |
| Growth Rate | CAGR of 5.5% from 2025-2030 |
| Years Considered | 2022-2030 |
| Base Year | 2024 |
| Forecast Period | 2025-2030 |
| Units Considered | Value (USD Million), Volume (Kiloton) |
| Report Coverage | Revenue forecast, company ranking, competitive landscape, growth factors, and trends |
| Segments Covered |
|
| Regions Covered | North America, Asia Pacific, Europe, South America, Middle East & Africa |
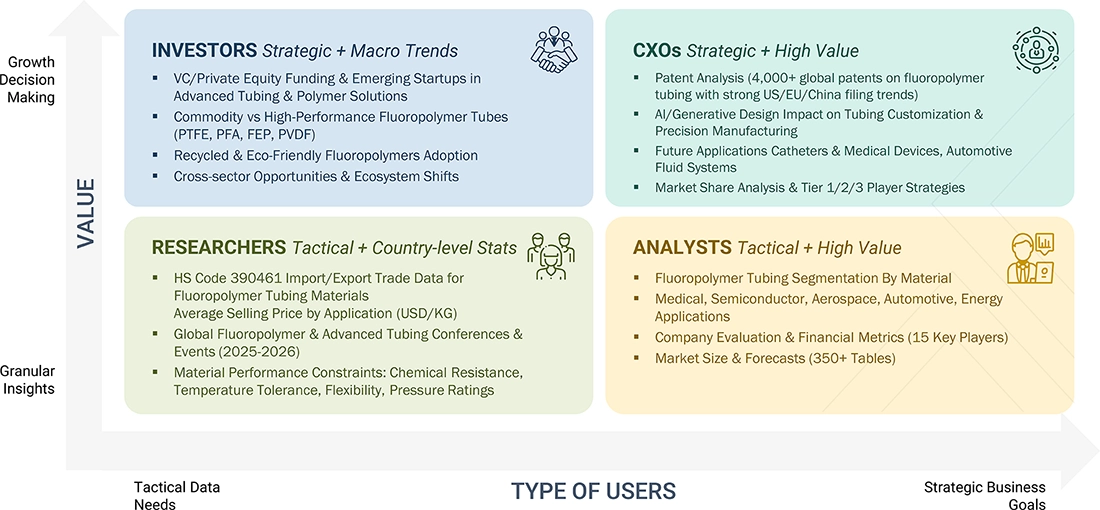
WHAT IS IN IT FOR YOU: Fluoropolymer Tubing Market REPORT CONTENT GUIDE
DELIVERED CUSTOMIZATIONS
We have successfully delivered the following deep-dive customizations:
| CLIENT REQUEST | CUSTOMIZATION DELIVERED | VALUE ADDS |
|---|---|---|
| US-based Fluoropolymer Tubing Manufacturer | Competitive profiling of PTFE, PFA, FEP, and PVDF producers (cost structures, product mix) Mapping customer landscape by medical, semiconductor, aerospace, and automotive sectors Assessment of supply chain & distribution partnerships | Identify cost advantage opportunities vs. global competitors Detect customer adoption trends across high-performance industries Highlight untapped customer clusters for fluoropolymer tubing integration |
| Medical Device Manufacturer using Fluoropolymer Tubing | Segmentation of tubing demand across catheters, infusion lines, and minimally invasive devices Benchmarking adoption vs. silicone, PVC, and conventional polymer tubing Switching barrier analysis (biocompatibility, sterilization, regulatory approval) | Insights on revenue migration from conventional to fluoropolymer tubing Pinpoint substitution risks & opportunities in cost-sensitive medical applications Enable targeting of high-margin, regulatory-compliant tubing solutions |
| Semiconductor & Electronics OEM | Technical & economic evaluation of fluoropolymer tubing in chemical delivery & gas transport Lifecycle & contamination risk modeling Forecast of tubing demand in wafer fabrication & cleanroom applications by 2035 | Support entry into high-value semiconductor supply chains Uncover long-term performance-driven revenue streams Strengthen operational reliability with chemically inert tubing solutions |
| European Fluoropolymer Raw Material Supplier |
|
|
| Automotive Tier-1 using Fluoropolymer Tubing | Global & regional capacity benchmarking of fluoropolymer extrusion facilities Pipeline of new entrants & technology innovations (multi-lumen, high-purity tubing) Customer profiling across aerospace, medical, and automotive sectors | Strengthen supply chain integration strategy Identify high-demand sectors for long-term supply contracts Assess regional supply-demand imbalances for competitive edge |
RECENT DEVELOPMENTS
- May 2025 : Optinova invested in the US medical tubing marketplace where it received its ISO 13485 certification through its Valley Forge facility in Pennsylvania. Previously, the facility produced industrial applications, and with the support of a new purpose-built Class 8 Cleanroom with multiple production lines, including medical-grade runs for the first time, it reinforced Optinova's global growth strategy while providing high-quality, ultimately localized manufacturing to customers in the US healthcare space. The expansion of the facility also extended Optinova's cleanroom medical extrusion solutions within the US and European markets, as well as Asia.
- November 2024 : Optinova expanded its global footprint with the launch of a state-of-the-art ISO Class 8 cleanroom extrusion facility in Valley Forge, Pennsylvania. This new site enables the production of advanced, high-quality medical tubing to meet rising US market demand.
- August 2024 : Adtech developed a new FEP heat shrink sleeving with a 1.6:1 shrink ratio, a specialized fluoropolymer tubing product designed to meet growing demand for larger expanded IDs and varied wall thicknesses. This innovation, achieved through advanced processing techniques and in-house tooling, enabled the company to provide cost-effective bespoke solutions tailored to customer needs. The product proved highly suitable for medical devices, offering purity, traceability, and compliance, as well as for industrial applications, delivering chemical resistance and insulation.
- May 2024 : Optinova opened its second production hall in Thailand, dedicated exclusively to medical extrusions such as PTFE liners, FEP Heat Shrink, and FEP IV tubing for catheters. The facility featured a 2,000-square-meter state-of-the-art cleanroom, reflecting Optinova’s commitment to delivering high-quality medical tubing solutions. This strategic expansion addressed rising global demand and strengthened the company’s role as a trusted partner in the healthcare industry.
- April 2024 : Saint-Gobain Life Sciences Electronics launched its Furon FEP and standard-grade PFA tubing, aimed directly at semiconductor and microelectronics applications, including clean air lines, chemical drains, and heat exchangers. These high-performance products are manufactured at Saint-Gobain’s global facilities, are highly resistant to chemicals and physical forces, and are available in an expansive range of sizes. The launch boosted Saint-Gobain’s capability to support the global semiconductor market with advanced and reliable tubing solutions.
Table of Contents
 Exclusive indicates content/data unique to MarketsandMarkets and not available with any competitors.
Methodology
This study involves two major activities in estimating the current market size for the fluoropolymer tubing market. Exhaustive secondary research was conducted to collect information on the market, peer market, and parent market. The next step involved validating these findings and assumptions, and sizing with industry experts across the value chain through primary research. Both top-down and bottom-up approaches were employed to estimate the complete market size. After that, market breakdown and data triangulation were used to estimate the market size of segments and subsegments.
Secondary Research
Secondary sources referred to for this research study included financial statements of companies offering fluoropolymer tubing and information from various trade, business, and professional associations. Secondary research was used to obtain critical information about the industry’s value chain, the total pool of key players, market classification, and segmentation according to industry trends to the bottom-most level and regional markets. Secondary data was collected and analyzed to arrive at the overall size of the fluoropolymer tubing market, which was validated by primary respondents.
Primary Research
Extensive primary research was conducted after obtaining information regarding the fluoropolymer tubing market scenario through secondary research. Several primary interviews were conducted with market experts from both the demand and supply sides across major countries of North America, Europe, Asia Pacific, the Middle East & Africa, and South America. Primary data was collected through questionnaires, emails, and telephonic interviews. The primary sources from the supply side included various industry experts, such as chief X officers (CXOs), vice presidents (VPs), directors from business development, marketing, product development/innovation teams, related key executives from fluoropolymer tubing industry vendors, material providers, distributors, and key opinion leaders. Primary interviews were conducted to gather insights such as market statistics, data on revenue collected from the products and services, market breakdowns, market size estimations, market forecasting, and data triangulation. Primary research also helped in understanding the various trends related to form factor, material, application, and region. Stakeholders from the demand side, such as CIOs, CTOs, CSOs, and installation teams of the customers/end users seeking fluoropolymer tubing services, were interviewed to understand the buyer’s perspective on the suppliers, products, component providers, and their current usage of fluoropolymer tubing and future outlook of their business, which will affect the overall market.
Breakup of Primary Research:

To know about the assumptions considered for the study, download the pdf brochure
Market Size Estimation
The research methodology used to estimate the size of the fluoropolymer tubing market includes the following details. Market sizing was undertaken from the demand side. The market was upsized based on the demand for fluoropolymer tubing in different end-use industries at a regional level. Such procurements provide information on the demand aspects of the fluoropolymer tubing industry for each application. For each end use, all possible segments of the fluoropolymer tubing market were integrated and mapped.

Data Triangulation
After arriving at the overall size from the market size estimation process explained above, the total market was split into several segments and subsegments. The data triangulation and market breakdown procedures explained below were implemented, wherever applicable, to complete the overall market engineering process and arrive at the exact statistics for various market segments and subsegments. The data was triangulated by studying various factors and trends from the demand and supply sides. Along with this, the market size was validated using both top-down and bottom-up approaches.
Market Definition
The fluoropolymer tubing market refers to the industry focused on the production, distribution, and utilization of tubing made from fluoropolymer materials such as PTFE, FEP, PFA, ETFE, and others. These tubing products are characterized by their exceptional resistance to heat, chemicals, and corrosion, along with properties like low friction, high flexibility, and excellent electrical insulation. Due to these attributes, fluoropolymer tubing is widely used across industries, including medical, pharmaceuticals, semiconductors, chemicals, automotive, aerospace, and oil & gas, where reliability, purity, and durability are critical. The market encompasses various product types, materials, and applications, serving both standard and customized needs in high-performance environments. It is shaped by technological advancements, regulatory standards, and the growing demand for specialized materials capable of operating under extreme conditions.
Stakeholders
- Fluoropolymer Tubing Manufacturers
- Fluoropolymer Tubing Distributors and Suppliers
- End-use Industries
- Universities, Governments, and Research Organizations
- Associations and Industrial Bodies
- R&D Institutes
- Environmental Support Agencies
- Investment Banks and Private Equity Firms
- Research and Consulting Firms
Report Objectives
- To define, describe, and forecast the fluoropolymer tubing market size in terms of volume and value
- To provide detailed information regarding the key factors, such as drivers, restraints, opportunities, and challenges, influencing market growth
- To analyze and project the market by form factor, material, application, and region
- To forecast the market size concerning five main regions (along with country-level data), namely, North America, Europe, Asia Pacific, the Middle East & Africa, and South America, and analyze the significant region-specific trends
- To strategically analyze micromarkets with respect to individual growth trends, prospects, and contributions of the submarkets to the overall market
- To analyze the market opportunities and the competitive landscape for stakeholders and market leaders
- To assess recent market developments and competitive strategies, such as agreements, contracts, acquisitions, partnerships & collaborations, and product developments/launches, to draw the competitive landscape
- To strategically profile the key market players and comprehensively analyze their core competencies
Key Questions Addressed by the Report
What are the factors propelling the growth of the fluoropolymer tubing market?
The rise in the geriatric population, increasing use in the solar industry, growing demand for electric vehicles (EVs), high growth in end-use industries, and industrialization in Asia Pacific are key growth drivers.
What are the major challenges to the growth of the fluoropolymer tubing market?
Stringent and time-consuming regulatory policies, along with the difficulty in processing high-performance fluoropolymers, are major challenges.
What are the major opportunities in the fluoropolymer tubing market?
Increasing healthcare investments in emerging economies and growing markets for melt extrusion offer significant opportunities.
What are the major factors restraining the growth of the fluoropolymer tubing market?
Higher cost compared to conventional materials and environmental sustainability concerns are the main restraining factors.
Which are the major players in the fluoropolymer tubing market?
Major players include Saint-Gobain (France), Zeus Company LLC (US), Optinova (Finland), Parker Hannifin (US), TE Connectivity (Ireland), Adtech Polymer Engineering Ltd. (UK), AMETEK Inc. (US), Swagelok Company (US), Tef-Cap Industries (US), and Teleflex Incorporated (US).
Need a Tailored Report?
Customize this report to your needs
Get 10% FREE Customization
Customize This ReportPersonalize This Research
- Triangulate with your Own Data
- Get Data as per your Format and Definition
- Gain a Deeper Dive on a Specific Application, Geography, Customer or Competitor
- Any level of Personalization
Let Us Help You
- What are the Known and Unknown Adjacencies Impacting the Fluoropolymer Tubing Market
- What will your New Revenue Sources be?
- Who will be your Top Customer; what will make them switch?
- Defend your Market Share or Win Competitors
- Get a Scorecard for Target Partners

Custom Market Research Services
We Will Customise The Research For You, In Case The Report Listed Above Does Not Meet With Your Requirements
Get 10% Free CustomisationTESTIMONIALS

We at Nissan Chemicals Corporation have been clients of MarketsandMarkets for more than a year now. We recently consulted MarketsandMarkets for a study, the team at MarketsandMarkets was extremely professional and organized. The business insights were very detailed and aligned well with our expectations that really helped us formulate the Business Plans and device new strategies for development themes. MarketsandMarkets offers a unique combination of expertise and dedicated engagement model. Their research findings have helped us in designing our Pricing Strategy which will make it easier for us to predict the future sales and profits for the next ten years. We look forward to working with MarketsandMarkets in the future.
VP of Strategy & New Business Development
Leading Specialty Chemical Company
The MarketsandMarkets Engagement Model, composed of both the Knowledge Store and advisory custom research, has greatly helped us in understanding our markets and making strategic decisions. The Knowledge Store is a fast way to allow everyone in our organization to understand more about most any market they are interested in. The ability to then get custom research done and get answers to specific strategic questions and market insight has been spectacular. The Markets and Markets team feel more like colleagues than vendors and their services have helped us change our culture where statements of things like growth opportunities and competitive position are always backed by industry research.

Rich Gibson,
Director, Corporate Strategy
Milliken & Company,
Leading Industrial Manufacturer of specialty chemical, floor covering, performance and protective textile materials, and healthcaremilliken.com
MarketsandMarkets is a trusted resource that helps us to better understand markets that are near-adjacencies-whether its technology, value chain or geography. Their Knowledge Store platform provides a dashboard of markets and their characteristics which is easy to use and saves us time.
Adam Shaw,
Market Development and Strategy Manager
AdvanSix Inc. USA,
An American Leader in Chemicalswww.advansix.com
The Knowledge Store from MarketsandMarkets is a valuable tool which has helped my team acquire greater insight in to the end markets that our business serves. This has enabled us to help our company build stronger strategies throughout our planning process.
TOSHIO KINOSHITA
Senior Chif Consultion Research & Consulting Division
Mitsubishi Chemical Research Corporation,
Leading Manufacturer of Chemical Productswww.mitsubishichem-res.co.jp/en/

We recently engaged with MarketsandMarkets for a study, the team not only clearly understood our business objectives but was also extremely professional in the way they handled the entire project. The study was efficiently conducted in a phase-wise manner, and the engagement model furnished us with high-quality business insights that far exceeded our expectations at each phase. We were especially happy that MarketsandMarkets could provide us with both, an English as well as a Japanese version of the study. A special thanks to the Analyst Team and Client Services Team, whose fluency in Japanese enhanced our comfort level, as we could converse with them in our preferred language.
Independent entrepreneurs
Arrow Precision
We approached MarketsandMarkets for study on Proppants Market, and their work exceeded our expectations. The study conducted was comprehensive and enabled us to view the market through the various dimensions. In addition, the team was extraordinarily responsive throughout the process and resolved our queries on time. I strongly recommend MarketsandMarkets and will certainly consider them for additional market assessments we will need in the future.
Global engineering company, Japan
Deputy Manager,
Strategic Planning OfficeThe high-quality insights shared by the MarketsandMarkets team helped us understand the pharmaceutical plant designers in a specific geography. It also captured the risks that we may likely face in communicating with our potential partners. The study would enable us identify partners, which would impact our future growth.

Still Researching the
Fluoropolymer Tubing Ecosystem?
See the competitors, opportunities, and growth signals shaping it - instantly.
Generate 15+ consulting-grade strategic insights tailored to your growth question.


Growth opportunities and latent adjacency in Fluoropolymer Tubing Market