
Laser Interferometer Market Size, Share & Trends

Laser Interferometer Market by Technique (Homodyne, Heterodyne), Type (Michelson, Fabry-Perot, Fizeau, Mach-Zehnder, Sagnac, Twyman-green), Component (Laser, Photodetector, Optical), Application (Surface Topology, Biomedical) - Global Forecast to 2030


OVERVIEW
Source: Secondary Research, Interviews with Experts, MarketsandMarkets Analysis
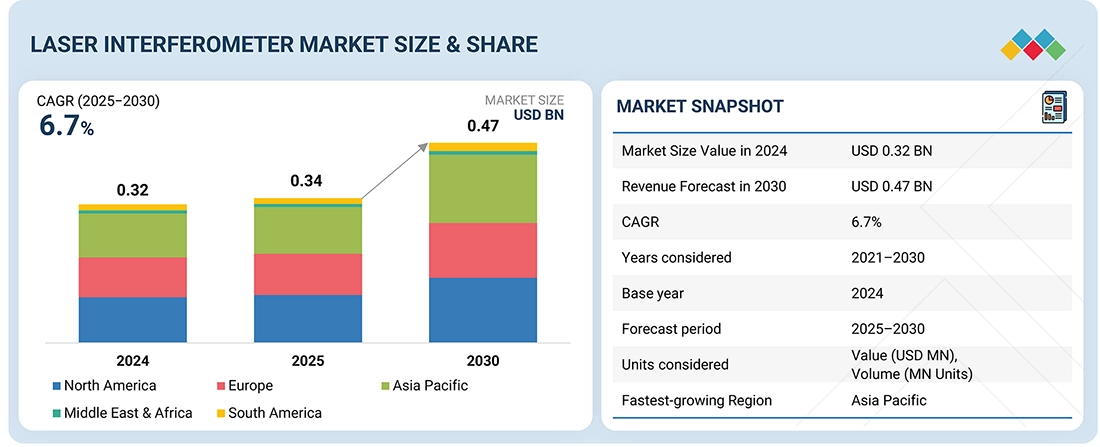
The Laser Interferometer Market is projected to grow from USD 0.34 billion in 2025 to USD 0.47 billion by 2030, at a CAGR of 6.7% from 2025 to 2030. The market is witnessing robust growth due to its increasing adoption across semiconductor, automotive, aerospace, and healthcare sectors. In the semiconductor industry, the rising demand for precision metrology tools to enable advanced lithography and nanomanufacturing is a key driver. Additionally, the automotive sector is utilizing laser interferometers for surface profiling, dimensional inspection, and calibration, while the healthcare industry is leveraging them for optical diagnostics and biomedical imaging, further fuelling market growth.
Market Size & Forecast
KEY TAKEAWAYS
-
BY INTERFEROMETER TYPEThe market includes Michelson, Fabry-Perot, Fizeau, Mach-Zehnder, Sagnac, and Twyman-Green interferometers. Michelson interferometers dominate due to their broad use in precision measurements, calibration, and optical testing. Fizeau interferometers are gaining traction in surface topology and flatness testing, while Fabry-Perot finds applications in telecommunications and spectroscopy. The increasing adoption of Mach-Zehnder and Sagnac configurations for sensing and advanced research is further boosting growth.
-
BY TYPEHomodyne and heterodyne interferometers form the core of the market. Homodyne interferometers hold a major share owing to their simplicity, cost-effectiveness, and suitability for industrial and academic applications. Meanwhile, heterodyne systems are expanding in semiconductor detection, precision engineering, and applied sciences due to their ability to provide higher resolution, phase stability, and noise reduction in complex measurements.
-
BY APPLICATIONApplications span surface topology analysis, engineering precision, applied science, biomedical imaging, and semiconductor detection. Surface topology holds the largest market share as industries increasingly rely on interferometry for surface characterization and defect analysis. Semiconductor detection is rapidly growing with the miniaturization of electronic devices, while biomedical applications are witnessing rising adoption for non-invasive diagnostics and optical imaging.
-
BY VERTICALLaser interferometers serve automotive for precision measurement and calibration, aerospace & defense for navigation systems and optics testing, industrial manufacturing for process control, healthcare for optical diagnostics, electronics & semiconductors for wafer inspection, and telecommunications for wavelength monitoring and fiber optic testing. Electronics & semiconductor is the fastest-growing vertical, driven by demand for nanotechnology and advanced fabrication techniques.
-
BY END USEEnd-uses span automotive for TPMS and engine management, medical for blood pressure and respiratory monitoring, manufacturing and utilities for process control, aviation and oil & gas for harsh-condition sensing, marine for navigation, and consumer electronics for wearables and smart devices.
-
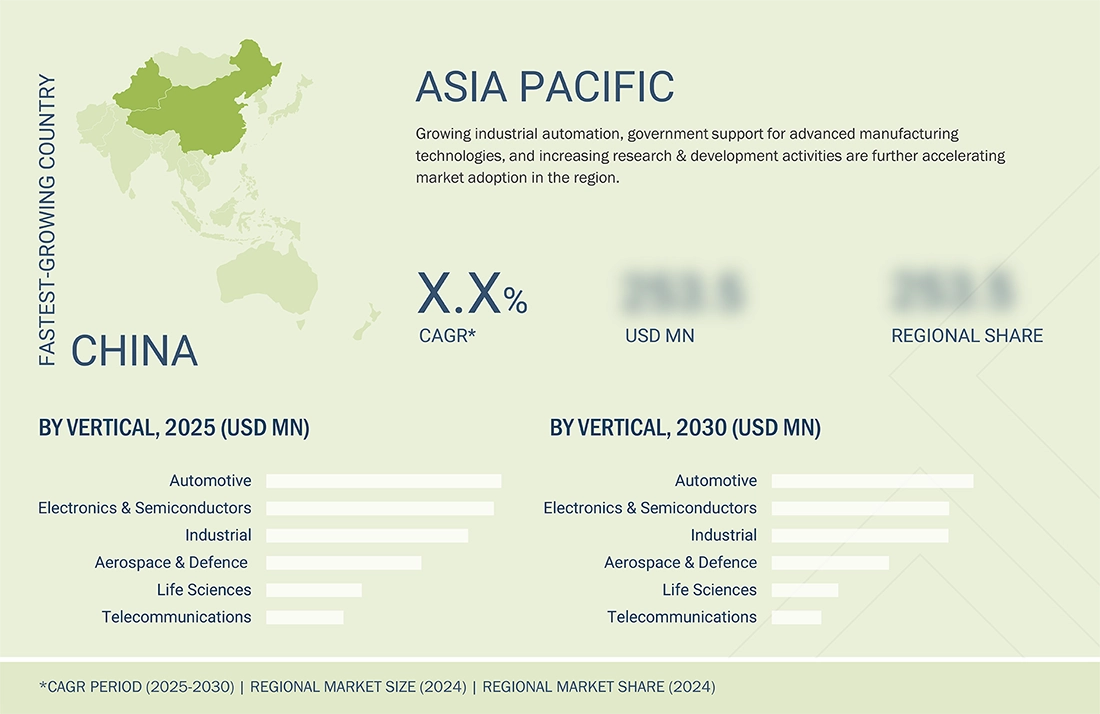
BY REGIONAsia Pacific is expected to grow fastest, with a CAGR of 7.9%, supported by semiconductor manufacturing hubs in China, Taiwan, South Korea, and Japan.
-
COMPETITIVE LANDSCAPEMarket players are focusing on product innovation, partnerships, and acquisitions to strengthen their positions. Companies like Zygo, Keysight Technologies, and Renishaw are advancing interferometer solutions with higher precision and integration with automation. Collaborations with semiconductor fabs and research institutes are driving technology adoption in next-generation applications, ensuring competitive differentiation.
The Laser Interferometer Industry is projected to grow steadily over the next decade, driven by increasing demand for ultra-precise measurement, calibration, and quality control across advanced industries. Rising adoption in semiconductor fabrication, aerospace, healthcare, and telecommunications is fuelling growth as manufacturers seek higher accuracy in nanoscale and optical applications. Laser interferometers offer unmatched precision in surface topology, alignment, and displacement measurement, utilizing configurations such as Michelson, Fabry-Perot, and Fizeau, with both homodyne and heterodyne types catering to diverse needs.
TRENDS & DISRUPTIONS IMPACTING CUSTOMERS' CUSTOMERS
Laser interferometers are extensively adopted across multiple sectors, including automotive, aerospace & defence, industrial, healthcare, electronics & semiconductors, and telecommunications. Their demand is accelerating, driven by the rising need for precise 3D measurement solutions, greater emphasis on quality assurance, and increased investments in research and development activities. These systems find critical applications in surface analysis, engineering, applied sciences, medical diagnostics, and semiconductor inspection.
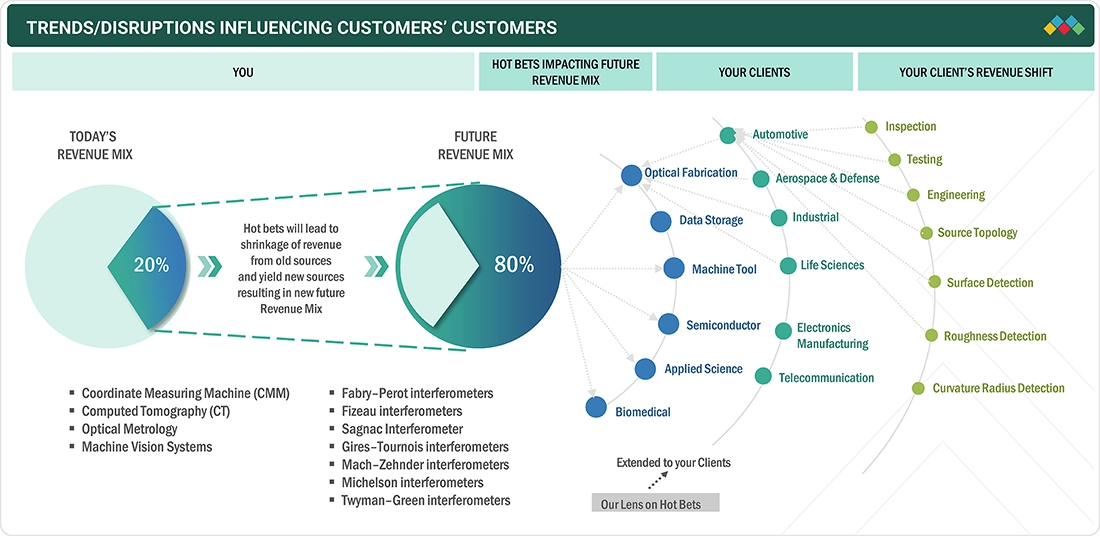
Source: Secondary Research, Interviews with Experts, MarketsandMarkets Analysis
MARKET DYNAMICS
Level
-
Growing demand for precision in manufacturing and quality control

-
Advancements in semiconductor and electronics industries

Level
-
High initial investment and maintenance costs

-
Complexity of operation requiring skilled personnel

Level
-
Expansion in emerging markets with growing industrialization

-
Integration with automation and Industry 4.0 technologies

Level
-
Maintaining accuracy in varying environmental conditions

-
Requirement for skilled personnel to handle complex operations

Source: Secondary Research, Interviews with Experts, MarketsandMarkets Analysis
Driver: Growing demand for precision in manufacturing and quality control
The increasing requirement for highly accurate measurements in sectors like aerospace, automotive, and electronics is driving adoption. Precision ensures product reliability, safety, and performance, where even minor deviations can have major operational consequences, making laser interferometry essential for quality control.
Restraint: High initial investment and maintenance costs
The advanced technology and precision engineering of laser interferometers result in high initial investments. SMEs face budgetary constraints, while additional costs for auxiliary systems, such as vibration isolation or temperature control, further challenge adoption.
Opportunity: Integration with automation and Industry 4.0 technologies
Laser interferometers can be embedded into smart manufacturing systems to enable real-time, accurate measurements. This integration reduces human error, enhances workflow efficiency, and ensures consistent product quality across automated processes.
Challenge: Requirement for skilled personnel to handle complex operations
Operating laser interferometers demands expertise in optical physics and measurement techniques. Organizations often face difficulties in training staff, leading to longer deployment times and potential inaccuracies in measurement outcomes.
Laser Interferometer Market: COMMERCIAL USE CASES ACROSS INDUSTRIES
| COMPANY | USE CASE DESCRIPTION | BENEFITS |
|---|---|---|
 |
Laser interferometers for machine tool calibration and industrial metrology applications | Improved manufacturing precision| Reduced production errors| Extended machine tool life |
 |
Interferometry solutions for electronics, semiconductor testing, and optical communication systems | High-accuracy measurements| Enhanced product reliability| Faster time-to-market |
 |
Laser interferometers for surface topology analysis in optics, automotive, and aerospace sectors | Superior component quality| Defect detection at nanometer scale| Compliance with stringent standards |
 |
Interferometric metrology for semiconductor wafer inspection and optical component testing | Sub-nanometer accuracy| Improved yield rates| Reduced defects|Enhanced performance consistency |
 |
Laser interferometry-based surface analysis systems for materials research and life sciences | Advanced surface characterization| Support for nanotechnology research| Reliable results in R&D |
Logos and trademarks shown above are the property of their respective owners. Their use here is for informational and illustrative purposes only.
MARKET ECOSYSTEM
The ecosystem of the laser interferometer market comprises three key layers: laser component providers, interferometer system providers, and end users. Component providers such as Edmund Optics, Hamamatsu, and HÜBNER Photonics supply critical optical and laser technologies. Interferometer manufacturers like Renishaw, Keysight Technologies, ZEISS, and Zygo integrate these components into advanced metrology systems. End users, including NASA, LIGO, and major research institutes, leverage these solutions for precision measurement, semiconductor manufacturing, optics, aerospace, and scientific research.
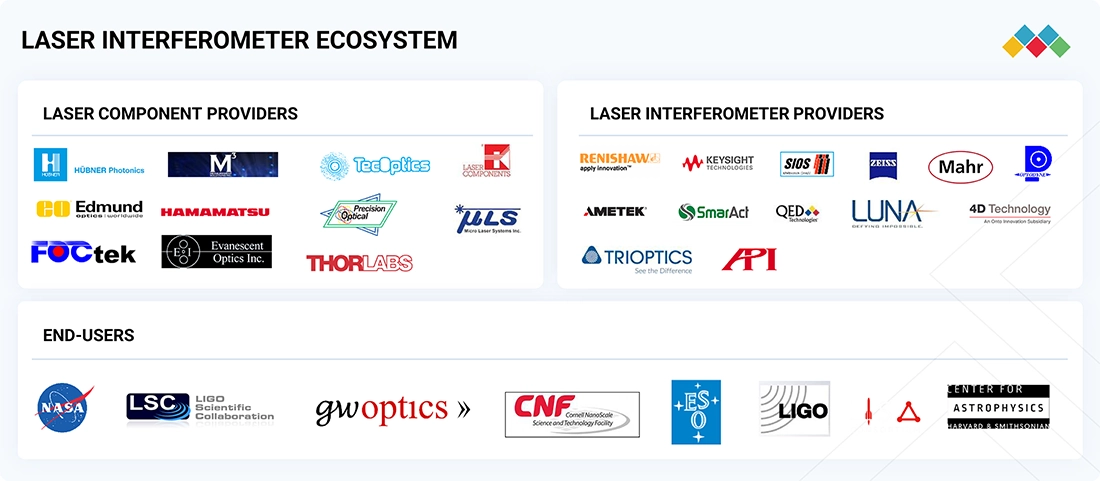
Logos and trademarks shown above are the property of their respective owners. Their use here is for informational and illustrative purposes only.
MARKET SEGMENTS
Source: Secondary Research, Interviews with Experts, MarketsandMarkets Analysis
Laser interferometer Market, Type
The Fizeau Interferometer segment is expected to register the highest CAGR in the laser interferometer market, driven by its precision in measuring surface flatness, thickness, and optical quality. Its increasing adoption across semiconductor, automotive, and aerospace sectors fuels demand, as industries require ultra-accurate, non-contact measurement solutions.
Laser interferometer Market, Technique
By 2025, the heterodyne segment is projected to hold the largest share of the laser interferometer market, driven by its superior precision, stability, and real-time measurement capabilities. Its widespread use in semiconductor inspection, machine calibration, and optical testing positions it as the preferred technique across advanced industrial and research applications.
Laser interferometer Market, Application
In 2024, the surface topology segment accounted for the largest share of the laser interferometer market, fuelled by rising demand for nanometre-level surface analysis in semiconductors, optics, and automotive manufacturing. The growing need to detect defects, ensure flatness, and enhance product reliability strengthened its dominance across critical precision-driven applications.
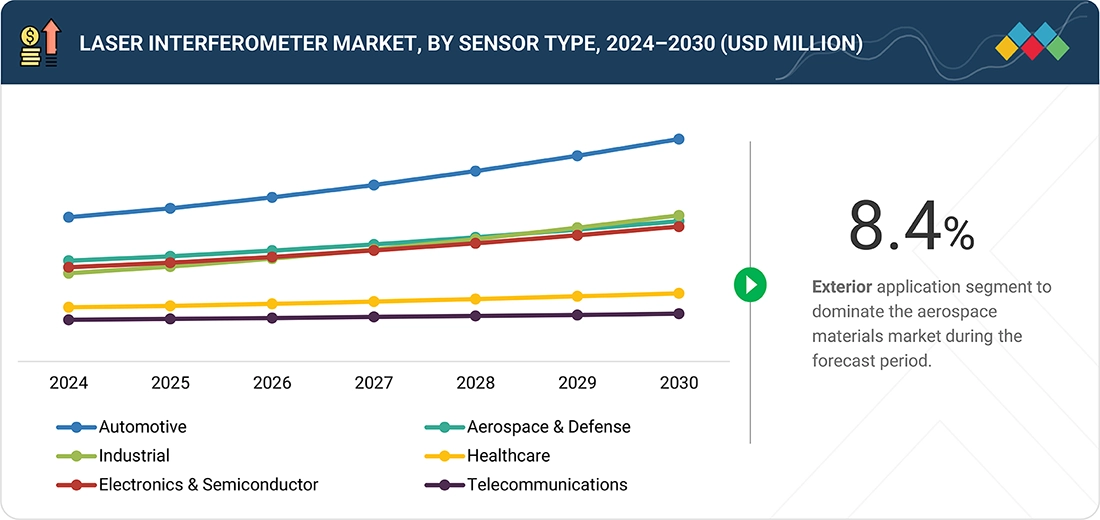
Laser interferometer Market, Vertical
During the forecast period, the automotive segment captured the highest market share in the laser interferometer market, supported by increasing demand for advanced measurement in engine components, transmissions, and braking systems. Interferometers enable manufacturers to meet stringent safety standards, enhance fuel efficiency, and ensure precision in electric vehicle and autonomous technologies.
REGION
Asia Pacific to hold the largest market share in the global laser interferometer market during the forecast period
The Asia Pacific laser interferometer market is anticipated to grow at the highest CAGR during the forecast period. Rapid industrialization, expansion of the semiconductor and electronics sectors, and increasing adoption of precision measurement technologies in automotive and aerospace industries are driving strong regional demand for laser interferometer solutions.
Laser Interferometer Market: COMPANY EVALUATION MATRIX
In the laser interferometer market matrix, Renishaw plc (Star) leads with a strong market presence and an extensive product portfolio, enabling widespread adoption across automotive, industrial, and medical sectors. QED Technologies. (Emerging Leader) is steadily gaining traction with innovative sensor solutions focused on energy efficiency and smart applications. While Renishaw plc dominates through scale and established customer base, QED Technologies demonstrates solid growth potential to advance toward the leaders’ quadrant.
Source: Secondary Research, Interviews with Experts, MarketsandMarkets Analysis
KEY MARKET PLAYERS
MARKET SCOPE
| REPORT METRIC | DETAILS |
|---|---|
| Market Size in 2024 (Value) | USD 0.32 Billion |
| Market Forecast in 2030 (Value) | USD 0.47 Billion |
| Growth Rate | CAGR of 6.7% from 2025-2030 |
| Years Considered | 2021-2024 |
| Base Year | 2024 |
| Forecast Period | 2025-2030 |
| Units Considered | Value (Million Units) and Volume (USD Million) |
| Report Coverage | Revenue forecast, company ranking, competitive landscape, growth factors, and trends |
| Segments Covered |
|
| Regional Scope | North America, Europe, Asia Pacific, and RoW |
WHAT IS IN IT FOR YOU: Laser Interferometer Market REPORT CONTENT GUIDE
DELIVERED CUSTOMIZATIONS
We have successfully delivered the following deep-dive customizations:
| CLIENT REQUEST | CUSTOMIZATION DELIVERED | VALUE ADDS |
|---|---|---|
| US-based Laser Interferometer Manufacturer |
|
|
| European-based Precision Optics Supplier |
|
|
| Semiconductor Equipment Manufacturer |
|
|
| US based Laser interferometer Raw Material Supplier |
|
|
| Aerospace & Defence Laser interferometer Customer |
|
|
RECENT DEVELOPMENTS
- January 2024 : Zygo Corporation released the Qualifire laser interferometer. It is a portable, lightweight device with smart accessory recognition, integrated phase measuring ability for stability, and user-friendly features for easy setup and precise adjustments. It also offers optional artifact reduction, autofocus, and stable zoom capabilities.
- January 2023 : Bruker launched NPFLEX-1000, a white light interferometer designed for precision machining. It offers accurate surface texture and roughness measurements, ideal for automotive, medical, and large-scale additive manufacturing applications.
- January 2023 : Bruker released ContourX-1000, a high-performance, floor-standing white light interferometer designed for fast and accurate 3D surface texture and roughness measurements.
- September 2022 : Zygo Corporation collaborated with Digital Surf to launch Mx software integrated with the Mountains Advanced Contour module. This module enhanced the geometric dimensioning and tolerancing capabilities of Zygo’s optical profilers. The integrated software allows for precise measurement and analysis of critical dimensions, supporting tighter specifications in various applications such as surface topology, industrial, and semiconductor detection.
- January 2021 : Keysight Technologies launched source/measure units (SMUs) for testing applications requiring high accuracy, high resolution, and measurement flexibility. SMUs include current-voltage (I-V) units for characterizing and testing semiconductors and other non-linear devices and materials.
Table of Contents
 Exclusive indicates content/data unique to MarketsandMarkets and not available with any competitors.
Methodology
The research process for this study included systematic gathering, recording, and analysis of data about customers and companies operating in the laser interferometer market. This process involved the extensive use of secondary sources, directories, and databases (Factiva and Oanda) to identify and collect valuable information for the comprehensive, technical, market-oriented, and commercial study of the Laser interferometer market.
In-depth interviews were conducted with primary respondents, including experts from core and related industries, as well as preferred manufacturers, to gather and verify critical qualitative and quantitative information and assess growth prospects. Key players in the laser interferometer market were identified through secondary research, and their market rankings were determined through primary and secondary research. This research involved studying the annual reports of top players and conducting interviews with key industry experts, including CEOs, directors, and marketing executives.
Secondary Research
Various sources were used in the secondary research process to identify and collect information crucial for this study. These include company annual reports, press releases, investor presentations, white papers, technology journals, certified publications, articles by recognized authors, directories, and databases. Secondary research was primarily used to gather key information about the industry’s value chain, the total pool of market players, market classification according to industry trends at the most detailed level, regional markets, and key developments from both market and technology-oriented perspectives.
Primary Research
Primary research was also conducted to identify the segmentation types, key players, competitive landscape, and key market dynamics, such as drivers, restraints, opportunities, challenges, and industry trends, along with key strategies adopted by players operating in the laser interferometer market. Extensive qualitative and quantitative analyses were performed on the complete market engineering process to list key information and insights throughout the report.
Extensive primary research has been conducted after acquiring knowledge about the laser interferometer market scenarios through secondary research. Several primary interviews have been conducted with experts from the demand and supply side across four major geographic regions: North America, Europe, Asia Pacific, and RoW. Approximately 60% and 40% of the primary interviews were conducted from the supply and demand sides. These primary data have been collected through questionnaires, emails, and telephonic interviews.

Note: The three tiers of the companies have been defined based on their total/segmental revenue as of 2024: Tier 1 = >USD 1 billion, Tier 2 = USD 1 billion–USD 500 million, and Tier 3 = USD 500 million. ‘Others’ include sales, marketing, and product managers.
To know about the assumptions considered for the study, download the pdf brochure
Market Size Estimation
In the comprehensive market engineering process, the top-down and bottom-up approaches, along with several data triangulation methods, were implemented to estimate and validate the size of the laser interferometer market and various other dependent submarkets. Key players in the market were identified through secondary research, and their market share in the respective regions was determined through primary and secondary research. This entire research methodology included the study of annual and financial reports of the top players and interviews with experts (CEOs, VPs, directors, and marketing executives) for key insights (quantitative and qualitative).
All percentage shares, splits, and breakdowns were determined using secondary sources and verified through primary sources. All the possible parameters that affect the markets covered in this research study were accounted for, viewed in detail, verified through primary research, and analyzed to obtain the final quantitative and qualitative data. This data was consolidated and supplemented with detailed inputs and analysis from MarketsandMarkets and presented in this report.
Laser Interferometer Market: Top-Down and Bottom-Up Approach

Data Triangulation
After determining the overall market size through the market size estimation process, as explained above, the total market has been divided into several segments and subsegments. To complete the overall market engineering process and obtain precise statistics for all segments and subsegments, market breakdown and data triangulation procedures have been employed, as applicable. The data have been triangulated by studying various factors and trends from the demand and supply sides. Along with this, the market has been validated using top-down and bottom-up approaches.
Market Definition
Precision measuring instruments reduce measurement-related errors or machining errors in calibration and manufacturing processes. A laser interferometer is one such precision measuring instrument that delivers precise measurements of real-life objects. In most laser interferometers, a laser from a single source is split into two beams that travel in different optical paths, which are then combined to produce interference. Laser interferometers are usually used in ultraprecision machining and manufacturing, ultraprecision positioning control, and many non-contact optical sensing technologies. Laser interferometers are extensively used in research projects and manufacturing plants for the measurement of small displacements, refractive index changes, and surface irregularities.
Key Stakeholders
- Laser material and component providers
- Laser interferometer providers, integrators, and installers
- Electronic hardware equipment manufacturers
- Optical measurement system manufacturers
- Laser interferometer software and solution providers
- Consulting companies
- Laser interferometer-related associations, organizations, forums, and alliances
- Government and corporate bodies
- Research institutes and organizations
- Venture capitalists, private equity firms, and startup companies
- Distributors and traders
- Original equipment manufacturers (OEMs)
- End users
Report Objectives
- To define, describe, and forecast the laser interferometer market, in terms of value, segmented by technique, type, application, and vertical.
- To describe and forecast the market, in terms of value, for various segments with respect to four main regions—North America, Europe, Asia Pacific, and Rest of the World (RoW)
- To forecast the market for different types of laser interferometers in terms of volume
- To provide detailed information regarding the major factors, such as drivers, restraints, opportunities, and challenges, influencing the growth of the laser interferometer market
- To strategically analyze micromarkets1 with respect to individual growth trends, prospects, and contributions to the total market
- To analyze opportunities for stakeholders by identifying high-growth segments of the laser interferometer market
- To benchmark players within the market using the proprietary Company Evaluation Matrix framework, which analyzes market players on various parameters within the broad categories of market rank and product offering
- To strategically profile the key players and comprehensively analyze their market shares and core competencies2, and provide a detailed competitive landscape for market leaders
- To analyze competitive developments, such as partnerships, collaborations, agreements, and joint ventures; mergers and acquisitions; expansions; and product launches and developments, in the laser interferometer market
Customization Options
With the given market data, MarketsandMarkets offers customizations according to the company’s specific needs. The following customization options are available for the report:
Key Questions Addressed by the Report
What is the projected market value of the laser interferometer market by 2030?
The laser interferometer market is projected to reach USD 0.47 billion by 2030, growing from USD 0.34 billion in 2025 at a CAGR of 6.7% during the forecast period.
Which region is expected to witness the fastest growth in the laser interferometer market?
Asia Pacific is expected to be the fastest-growing region due to strong semiconductor manufacturing, rapid industrialization, and increasing adoption of precision measurement technologies.
What are the key segments of the laser interferometer market?
The market is segmented by technique (homodyne and heterodyne), type (Michelson, Fabry-Perot, Fizeau, Mach-Zehnder, Sagnac, Twyman-Green), component (laser, photodetector, optical), and application such as surface topology, biomedical, and semiconductor detection.
Which segment holds a significant share in the laser interferometer market?
The homodyne segment holds a significant share due to its simplicity and cost-effectiveness, while the surface topology application segment dominates due to rising demand for high-precision surface analysis.
Who are the key players operating in the laser interferometer market?
Key players in the laser interferometer market include Renishaw plc, Keysight Technologies, ZEISS Group, Zygo Corporation, and Bruker, reflecting a competitive and innovation-driven ecosystem.
Need a Tailored Report?
Customize this report to your needs
Get 10% FREE Customization
Customize This ReportPersonalize This Research
- Triangulate with your Own Data
- Get Data as per your Format and Definition
- Gain a Deeper Dive on a Specific Application, Geography, Customer or Competitor
- Any level of Personalization
Let Us Help You
- What are the Known and Unknown Adjacencies Impacting the Laser Interferometer Market
- What will your New Revenue Sources be?
- Who will be your Top Customer; what will make them switch?
- Defend your Market Share or Win Competitors
- Get a Scorecard for Target Partners

Custom Market Research Services
We Will Customise The Research For You, In Case The Report Listed Above Does Not Meet With Your Requirements
Get 10% Free CustomisationTESTIMONIALS

Tetsuya Ohhira
Business Development Manager-Technology Business
Nikon Corporation,
Leading Japanese MNC specializing in optics and imaging productswww.nikon.com
MarketsandMarkets™ response
is quick. Their attitude is flexible and positive. Analyst Insights are globally considered and
significant. Client Services quickly respond to our inquiry and demand. Their wide range of global
surveys help us make our strategic plan.
We hope Knowledge Store will be easier to search
for a report.
VP - Marketing & Business Development
Leading Provider of Process Control Solutions
We engaged with MarketsandMarkets on a study to perform an analysis and recommend a Go-To-Market strategy for metrology and process control in the semiconductor market. The study was tailored to our targets and needs with well-defined milestones. Our overall experience with the MarketsandMarkets team was very good throughout the project in all aspects including the analysis methodologies used, the quality and depth of primary and secondary data sets, the professionalism and flexibility of the team and the ability to meet the target schedule and milestones. We want to thank MarketsandMarkets team for a job well done.

Still Researching the
Laser Interferometer Ecosystem?
See the competitors, opportunity evaluation, and growth signals shaping it - Instantly!
Generate 15+ consulting-grade strategic intelligence outputs - from competitor analysis to board-ready strategy decks, tailored to your Laser Interferometer growth question.


Growth opportunities and latent adjacency in Laser Interferometer Market