Image Sensors Market Size, Share and Trends

Image Sensor Market Size, Share & Trends by Type (CMOS, CCD), Processing (2D, 3D), Spectrum (Visible, Infrared), Array (Linear, Area), Resolution (VGA, 1.3 to 3 MP, 5 to 10 MP, 12 to 16 MP, >16 MP), End-user (Automotive, Consumer, Medical, Security) - Global Forecast to 2032




IMAGE SENSOR MARKET OVERVIEW

Source: Secondary Research, Interviews with Experts, MarketsandMarkets Analysis
The global image sensor market size is estimated at USD 23.70 billion in 2026 and is forecast to reach USD 37.02 billion by 2032, growing at a CAGR of 7.7% between 2026 and 2032. The demand for image sensors is primarily driven by the deployment of security and surveillance infrastructure. These systems require continuous visual data capture for accurate monitoring and threat detection. The integration of advanced medical diagnostic equipment is further driving component demand. Medical applications, such as endoscopes and X-ray imaging systems, require high-resolution visual processing for accurate patient diagnostics. Additionally, the development of automotive automation creates a requirement for accurate environmental perception.
KEY TAKEAWAYS
-
Image Sensor Market, by RegionBy region, Asia Pacific is expected to dominate the market, growing at a CAGR of 8.2% during the forecast period.
-
Image Sensor Market, by TypeBy type, the CMOS image sensor segment is expected to dominate the market during the forecast period.
-
Image Sensor Market, bY Processing TechniqueBy processing technique, the 3D image sensor segment is expected to exhibit the highest CAGR of 14.9% during the forecast period.
-
Image Sensor Market, by SpectrumBy spectrum, the visible image sensor segment is expected to dominate the market.
-
Image Sensor Market, by Array TypeBy array type, the area scan segment is expected to register the highest CAGR of 7.9% during the forecast period.
-
Image Sensor Market, by ResolutionBy resolution, the more than 16 MP segment is expected to dominate the market.
-
Image Sensor Market, by ApplicationBy application, the industrial segment is expected to register the highest CAGR during the forecast period.
-
COMPETITIVE LANDSCAPE - KEY PLAYERSSony Corporation (Japan), Samsung (South Korea), OMNIVISION (US), STMicroelectronics (Switzerland), and Semiconductor Components Industries, LLC (US) were identified as some of the star players in the image sensor market, given their strong market share and product footprint.
-
COMPETITIVE LANDSCAPE - STARTUPS/SMESNewsight Imaging (Israel), Terabee(France), AlpsenTek GmbH (Switzerland), QDI Systems (Netherlands), Tonbo Imaging (India), VoxelSensors (Belgium), and iC-Haus (Germany), among others, have established themselves as specialized players in the image sensor market by focusing on high-performance materials and application-specific solutions.
The growth of the image sensor market is being accelerated by the expansion of automated technologies and visual data processing across industries. This leads to an increase in camera modules per individual device. As resolution requirements increase and device architectures become compact, traditional charge-coupled device (CCD) approaches are being replaced. Manufacturers are adopting advanced technologies such as stacked complementary metal-oxide-semiconductors (CMOS), 3D depth sensors, and backside-illuminated (BSI) architectures. This technological transition expands the overall market value. Emerging applications include autonomous vehicles, artificial intelligence integration, medical diagnostics, and smart manufacturing.
TRENDS & DISRUPTIONS IMPACTING CUSTOMERS' CUSTOMERS
Image sensor is being shaped by companies replacing conventional charge-coupled devices (CCD), contact image sensors (CIS), and film sensors. Manufacturers are adopting complementary CMOS architectures. These include global shutter CMOS, back-illuminated (BSI) CMOS, stacked CMOS, and short-wave infrared (SWIR) sensors. This shift requires customized component integration for specific client operations. These clients operate across the automotive, semiconductor manufacturing, logistics, and agriculture sectors. The new sensor architectures address specific functional requirements. These requirements include safety compliance, quality testing, automated goods segregation, and crop monitoring. The adoption of these components leads to direct operational outcomes. These outcomes include the deployment of advanced driver assistance systems (ADAS), flaw detection equipment, barcode sorting systems, and digital microscopes.
The global image sensor market is characterized by a high level of concentration, with Sony Corporation maintaining a dominant position through its leadership in CMOS image sensor technology. Sony is estimated to account for approximately 45–55% of the global CMOS image sensor market, making it the clear market leader, particularly in smartphone, automotive, and premium imaging applications.
CMOS vs. CCD Market Split: CMOS image sensors account for over 95% of the global image sensor market, driven by their low power consumption, high-speed performance, cost efficiency, and widespread adoption across smartphones, automotive, industrial, healthcare, and security applications. In contrast, CCD image sensors represent less than 5% of the market and are mainly used in specialized fields such as scientific imaging, astronomy, and precision industrial inspection, where superior image quality and low noise are essential.

Source: Secondary Research, Interviews with Experts, MarketsandMarkets Analysis
MARKET DYNAMICS

Level
-
Increasing demand for multi-camera configurations in consumer electronics

-
Integration of advanced driver-assistance systems (ADAS) in automotive sector


Level
-
Complex fabrication processes required for stacked sensor architectures

-
High manufacturing costs associated with advanced sensor fabrication


Level
-
Growing adoption of 3D depth sensors in biometric and security systems

-
Expansion of machine vision applications in industrial automation


Level
-
Maintaining high image resolution while reducing component size

-
Managing power consumption during continuous visual data processing

Source: Secondary Research, Interviews with Experts, MarketsandMarkets Analysis
Driver: Increasing demand for multi-camera configurations in consumer electronics
Consumer electronics manufacturers are installing multiple cameras on single devices. Smartphones now require separate sensors for wide, ultrawide, and telephoto functions. This hardware architecture significantly increases the total volume of image sensors required per unit. This continuous volume requirement directly drives mass production and market sales.
Restraints: Complex fabrication processes required for stacked sensor architectures
Manufacturing stacked complementary metal-oxide-semiconductor (CMOS) sensors involves complex engineering. Multiple silicon layers must be precisely aligned and bonded at a microscopic level. This multi-step manufacturing process increases the risk of production defects. Lower yield rates during fabrication can disrupt supply chains and restrict rapid production scaling.
Opportunities:Growing adoption of 3D depth sensors in biometric and security systems
Security infrastructure and access control systems require precise identification methods. 3D depth sensors calculate spatial dimensions to map facial features or objects accurately. This hardware prevents spoofing attempts in biometric security. Supplying these specialized time-of-flight and structured light sensors presents a specific growth area for component manufacturers.
Challenges: Maintaining high image resolution while reducing component size
Electronic device manufacturers require smaller image sensors for compact product designs. However, reducing the physical size of individual pixels decreases their light-gathering capacity. This reduction can degrade overall image quality and introduce visual noise. Engineers must balance device miniaturization with the functional requirement for clear, high-resolution visual data capture.
IMAGE SENSORS MARKET SIZE, SHARE AND TRENDS: COMMERCIAL USE CASES ACROSS INDUSTRIES
| COMPANY | USE CASE DESCRIPTION | BENEFITS |
|---|---|---|
 |
Sony manufactures complementary metal-oxide-semiconductor (CMOS) image sensors. These components are utilized in smartphones, digital cameras, and automotive systems to capture continuous visual data. | Provides high-resolution visual input | Supports low-light data capture | Enables multi-camera device configurations | Integrates into compact electronic hardware |
 |
Samsung develops image sensors for mobile devices, automotive applications, and consumer electronics. These sensors process visual information for automated and user-controlled electronic systems. | Integrates small pixel architectures | Processes high-speed video capture | Limits operational power consumption | Supports fast autofocus mechanisms |
 |
OMNIVISION supplies digital imaging components, including advanced CMOS sensors. These are integrated into medical diagnostic equipment, automotive safety systems, and security surveillance cameras. | Delivers specific medical imaging functionality | Supports autonomous vehicle environmental mapping | Enables accurate facial recognition security | Maintains operational stability in variable lighting |
 |
STMicroelectronics produces 3D depth sensors and global shutter image sensors. These specific components are applied in industrial automation, machine robotics, and smart consumer devices. | Captures accurate spatial depth metrics | Inspects fast-moving objects without image distortion | Integrates directly into machine vision equipment | Operates efficiently in low-power electronic assemblies |
 |
Semiconductor Components Industries, LLC (onsemi) manufactures intelligent sensing hardware. These sensors function within automotive advanced driver-assistance systems (ADAS) and industrial quality inspection lines. | Captures high dynamic range (HDR) visual data | Mitigates LED flicker in automotive safety applications | Supports continuous automated production monitoring | Functions reliably across extreme temperature variations |
Logos and trademarks shown above are the property of their respective owners. Their use here is for informational and illustrative purposes only.
MARKET ECOSYSTEM
The image sensor ecosystem consists of raw material suppliers, semiconductor foundries, distributors, and end users. This structure forms a value chain supporting product manufacturing and deployment. Raw material suppliers provide essential inputs such as silicon wafers, optical filters, and chemical photoresists. Semiconductor foundries fabricate these basic materials into active complementary metal-oxide-semiconductor (CMOS) and charge-coupled device (CCD) components. Distributors manage logistics to ensure global component availability across different regions. End users then integrate these finished sensors into final products across sectors such as consumer electronics, automotive sensor manufacturing, medical diagnostics, and industrial automation.

Logos and trademarks shown above are the property of their respective owners. Their use here is for informational and illustrative purposes only.
MARKET SEGMENTS

Source: Secondary Research, Interviews with Experts, MarketsandMarkets Analysis
Image Sensor Market, By Type
Complementary metal-oxide-semiconductor (CMOS) image sensors dominate the market. This dominance results from their low power consumption and rapid data processing speeds. Modern devices such as smartphones, automotive safety systems, and industrial cameras rely heavily on this technology. CMOS sensors integrate processing circuitry directly onto the silicon chip. This hardware integration allows for compact electronic designs and cost-efficient mass production.
Image Sensor Market, By Processing Technique
The 2D processing technique segment holds the largest market share. This technique captures standard two-dimensional visual data. It is the operational standard for traditional photography, basic security surveillance, and standard machine vision systems. The high-volume manufacturing of standard camera modules sustains this segment's dominance.
Image Sensor Market, By Spectrum
The visible spectrum segment dominates the market. This segment processes light wavelengths visible to the human eye. It provides the necessary visual input for standard digital photography and video recording. High-volume applications in consumer electronics and automotive driver assistance systems create continuous demand for visible spectrum sensors.
Image Sensor Market, By Application
The consumer electronics segment dominates the image sensor market. This sector manufactures high volumes of smartphones, tablets, and wearable devices. Modern electronic devices frequently incorporate multiple camera modules per individual unit. This specific hardware configuration creates continuous mass-volume demand for image sensing components.
REGION
Asia Pacific to be fastest-growing region in global image sensor market during forecast period
Asia Pacific is expected to register the highest CAGR in the image sensor semiconductor market. This growth is due to expanding electronics manufacturing and the high-volume production of consumer electronics. Countries such as India, China, Japan, and South Korea operate as major global hubs for smartphone and automotive assembly. The region contains an established semiconductor fabrication ecosystem. Increasing investments in autonomous vehicle technology, security surveillance, and industrial machine vision drive the demand for specific image sensing components. Additionally, the presence of major original equipment manufacturers (OEMs) and scalable manufacturing capabilities accelerates overall regional market growth.

IMAGE SENSORS MARKET SIZE, SHARE AND TRENDS: COMPANY EVALUATION MATRIX
In the image sensor market matrix, Sony Corporation (Star) maintains a high market share and product footprint. The company manufactures a comprehensive portfolio of complementary metal-oxide-semiconductor (CMOS) sensors. These components process continuous visual data across the consumer electronics, smartphone, and automotive industries. Canon Inc. (Emerging Player) is expanding its market position through specific sensor technologies. It develops high-resolution and specialized imaging components. These sensors function within industrial machine vision, security surveillance, and medical diagnostic equipment. This specific operational focus contributes to its position within the global image sensor semiconductor market.

Source: Secondary Research, Interviews with Experts, MarketsandMarkets Analysis
KEY MARKET PLAYERS
- Sony Semiconductor Solutions Corporation (Japan)
- Samsung (South Korea)
- OMNIVISION (US)
- STMicroelectronics (Switzerland)
- GalaxyCore Shanghai Limited Corporation (China)
- Semiconductor Components Industries, LLC (US)
- Hamamatsu Photonics K.K. (Japan)
- Infineon Technologies AG (Germany)
- Canon Inc. (Japan)
- Teledyne Technologies Incorporated (US)
MARKET SCOPE
| REPORT METRIC | DETAILS |
|---|---|
| Market Size in 2025 (Value) | USD 22.08 Billion |
| Market Size in 2026 (Value) | USD 23.70 Billion |
| Market Forecast in 2032 (Value) | USD 37.02 Billion |
| Growth Rate | CAGR of 7.7% from 2026 to 2032 |
| Years Considered | 2022–2032 |
| Base Year | 2025 |
| Forecast Period | 2026–2032 |
| Units Considered | Value (USD BN), Volume (Million Units) |
| Report Coverage | Revenue forecast, company ranking, competitive landscape, growth factors, and trends |
| Segments Covered |
|
| Regional Scope | North America, Europe, Asia Pacific, RoW |
WHAT IS IN IT FOR YOU: IMAGE SENSORS MARKET SIZE, SHARE AND TRENDS REPORT CONTENT GUIDE

DELIVERED CUSTOMIZATIONS
We have successfully delivered the following deep-dive customizations:
| CLIENT REQUEST | CUSTOMIZATION DELIVERED | VALUE ADDS |
|---|---|---|
| Image sensor Materials Manufacturer |
|
|
| Image Sensor Component Manufacturer (CMOS, CCD, 3D Sensors) |
|
|
| Image Sensor End-User (OEM – Consumer Electronics / Automotive / Industrial) |
|
|
RECENT DEVELOPMENTS
- August 2026 : Sony and TSMC plan to invest about $6.3 billion in a joint venture to manufacture next-generation image sensors in Japan. The venture will combine Sony’s image-sensor expertise with TSMC’s advanced semiconductor manufacturing capabilities. Commercial production is targeted for as early as 2029 at a facility in Kumamoto, with Sony holding a 60% stake and TSMC 40%. The image sensors will support smartphones, automotive systems, robotics, and emerging Physical AI applications. The collaboration strengthens advanced sensor manufacturing in Japan while positioning both companies for growing demand for intelligent vision technologies.
- August 2026 : Cephia appointed Mike McAuliffe as CEO to accelerate growth of its AI-Native Image Sensors for Physical AI applications. The company’s AI-Native Image Sensor platform combines silicon metasurface optics with computational imaging to deliver RGB, polarization, 3D depth, and hyperspectral perception in ultra-compact form factors. The lens-free technology reduces camera size, weight, power consumption, and cost while expanding machine-vision capabilities. Cephia is expanding pilot programs across robotics, automotive, defense, health, satellite imaging, and drones. The leadership move supports faster product development and customer deployment as demand grows for advanced multimodal sensing in Physical AI.
- July 2026 : Huazhong University of Science and Technology developed an integrated metasurface image sensor architecture for ultra-compact optoelectronic imaging. The technology combines nanoscale metasurface optics directly with photodetectors to control light and capture multiple optical parameters in a single device. Metasurface image sensors eliminate bulky optical components, enabling thinner, lighter, and more functional imaging systems. The approach could support autonomous navigation, portable medical diagnostics, drone inspection, and high-density sensing. The innovation advances on-chip imaging toward compact, multifunctional, and next-generation optoelectronic systems.
- July 2026 : CMOS image sensors are entering a new phase driven by innovations in pixel architecture, computational imaging, and advanced semiconductor processes. New approaches are improving light capture, dynamic range, resolution, and imaging performance while reducing power and device size. Backside illumination (BSI), stacked architectures, and computational techniques are enabling greater functionality within compact sensor designs. These advances are expanding image-sensor capabilities across smartphones, automotive vision, industrial inspection, and Physical AI. The convergence of sensing, processing, and optics is positioning CMOS image sensors as a key technology for next-generation intelligent imaging systems.
- June 2026 : Sony Semiconductor Solutions Group developed the Ring Camera, a finger-worn image sensor designed to provide hands-free visual assistance. The Ring Camera captures surrounding visuals and converts them into audio feedback through a connected smartphone. The technology helps users with visual impairments read signs, identify products, navigate maps, detect obstacles, and understand traffic signals. Sony Semiconductor Solutions Group is collaborating with the National Museum of Emerging Science and Innovation to refine the prototype with user feedback. The compact Ring Camera could expand accessible wearable technology by combining imaging, AI, and hands-free interaction in a discreet form factor.
Table of Contents
 Exclusive indicates content/data unique to MarketsandMarkets and not available with any competitors.
Methodology
The research process for this study involved the systematic gathering, recording, and analysis of data on customers and companies operating in the image sensor market. This process involved the extensive use of secondary sources, directories, and databases (Factiva and Oanda) to identify and collect valuable information for the comprehensive, technical, market-oriented, and commercial study of the image sensor market. In-depth interviews were conducted with primary respondents, including experts from core and related industries, as well as preferred manufacturers, to obtain and verify critical qualitative and quantitative information and assess growth prospects. Key players in the image sensor market were identified through secondary research, and their market rankings were determined through a combination of primary and secondary research. This research involved studying the annual reports of top players and conducting interviews with key industry experts, including CEOs, directors, and marketing executives.Die-level image sensor market – counts only the CMOS/CCD sensor semiconductor (Sony, Samsung, onsemi, OmniVision, etc.).Camera module market includes the sensor plus lens, actuator (OIS/AF), IR filter, PCB, packaging, and module assembly.Imaging system market – may also include ISP, optics, software, and related components.
Secondary Research
Various sources were utilized in the secondary research process to identify and collect information relevant to this study. These include company annual reports, press releases, investor presentations, white papers, technology journals, certified publications, articles by recognized authors, directories, and databases.
Secondary research was primarily used to gather key information on the industry’s value chain, the total pool of market players, market classification by industry trends at the most detailed level, regional markets, and key developments from both market- and technology-oriented perspectives.
Primary Research
Primary research was also conducted to identify the segmentation types, key players, competitive landscape, and key market dynamics, including drivers, restraints, opportunities, challenges, and industry trends, as well as the key strategies adopted by players operating in the image sensor market. Extensive qualitative and quantitative analyses were conducted across the complete market engineering process to present key information and insights throughout the report.
Extensive primary research was conducted following the acquisition of knowledge about the image sensor market scenarios through secondary research. Several primary interviews were conducted with experts from the demand side (application and region) and the supply side (type, processing technique, spectrum, array type, and resolution) across four major geographic regions: North America, Europe, Asia Pacific, and the Rest of the World (RoW). Approximately 60% and 40% of the primary interviews were conducted from the supply and demand sides, respectively. These primary data were collected through questionnaires, emails, and telephonic interviews.
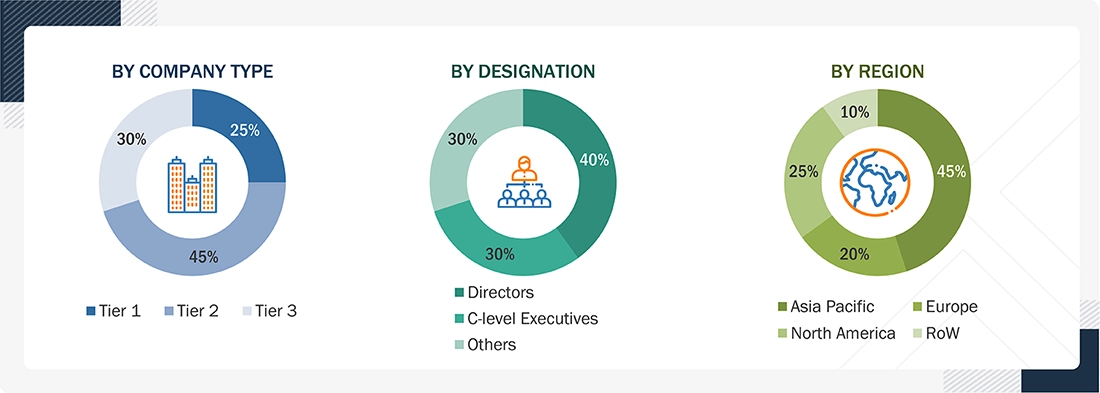
Note: The three tiers of companies have been defined based on their total/segmental revenue as of 2025: Tier 1 = > USD 1 billion, Tier 2 = USD 1 billion–USD 500 million, and Tier 3 = < USD 500 million. Other designations include sales, marketing, and product managers.
To know about the assumptions considered for the study, download the pdf brochure
Market Size Estimation
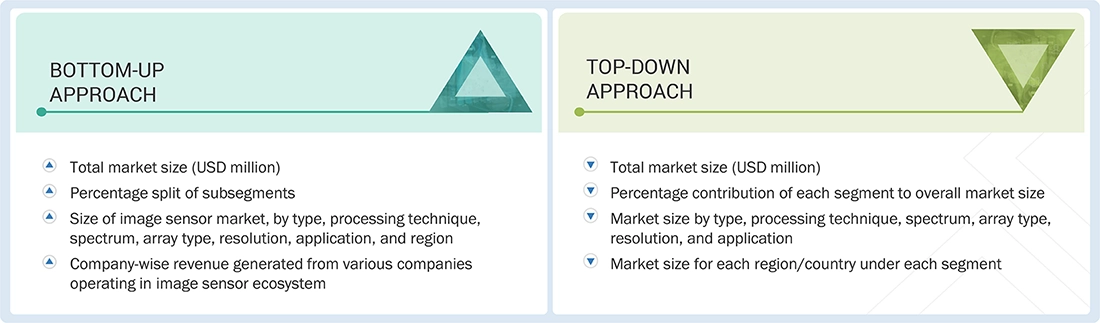
In the complete market engineering process, top-down and bottom-up approaches, along with several data triangulation methods, were used to estimate and validate the size of the image sensor market and various other dependent submarkets. Key players in the market were identified through secondary research, and their market share in each region was determined through a combination of primary and secondary research. This research methodology involved analyzing the annual and financial reports of the top players and conducting interviews with experts (including CEOs, VPs, directors, and marketing executives) to gather key insights (both quantitative and qualitative).
All percentage shares, splits, and breakdowns were determined using secondary sources and verified through primary sources. All possible parameters affecting the markets covered in this study were accounted for, examined in detail, verified through primary research, and analyzed to obtain final quantitative and qualitative data. This data was consolidated and supplemented with detailed inputs and analysis from MarketsandMarkets and presented in this report.The market size presented in this report represents the global image sensor semiconductor market and includes revenues generated from CMOS and CCD image sensor devices supplied by semiconductor manufacturers. The estimates exclude downstream camera module assembly, lenses, actuators, and other imaging system components unless explicitly stated. As a result, market values may differ from studies that measure the camera module market or broader imaging system ecosystem.
Image Sensors Market : Top-Down and Bottom-Up Approach
Data Triangulation
After determining the overall market size through the estimation process, as explained above, the total market was divided into several segments and subsegments. To complete the overall market engineering process and obtain precise statistics for all segments and subsegments, the data triangulation procedure was employed, as applicable. The data was triangulated by studying various factors and trends from the demand and supply sides. Additionally, the market was validated using both top-down and bottom-up approaches.
Market Definition
Image sensors are electronic photosensitive devices that convert optical images into electronic signals. When the light strikes the lenses of camera modules, image sensors convert that light into electric signals and transmit them to image processing units. These units convert electric signals to digital images. Image sensors comprise millions of photodiodes and act as image receivers in digital imaging equipment. They are widely used in digital cameras, camera modules, and other imaging devices.
Key Stakeholders
- Raw material suppliers
- Original equipment manufacturers (OEMs)
- Original design manufacturers (ODM) and technology solution providers
- Research institutes
- Image sensor manufactures
- Image sensor forums, alliances, and associations
- Governments and financial institutions
- Analysts and strategic business planners
Report Objectives
- Raw material suppliers
- Original equipment manufacturers (OEMs)
- Original design manufacturers (ODM) and technology solution providers
- Research institutes
- Image sensor manufactures
- Image sensor forums, alliances, and associations
- Governments and financial institutions
- Analysts and strategic business planners
Available customizations:
With the given market data, MarketsandMarkets offers customizations according to the company’s specific needs. The following customization options are available for the report:


Personalize This Research
- Triangulate with your Own Data
- Get Data as per your Format and Definition
- Gain a Deeper Dive on a Specific Application, Geography, Customer or Competitor
- Any level of Personalization
Let Us Help You
- What are the Known and Unknown Adjacencies Impacting the Image Sensor Market
- What will your New Revenue Sources be?
- Who will be your Top Customer; what will make them switch?
- Defend your Market Share or Win Competitors
- Get a Scorecard for Target Partners

Custom Market Research Services
We Will Customise The Research For You, In Case The Report Listed Above Does Not Meet With Your Requirements
Get 10% Free CustomisationTESTIMONIALS

Tetsuya Ohhira
Business Development Manager-Technology Business
Nikon Corporation,
Leading Japanese MNC specializing in optics and imaging productswww.nikon.com
MarketsandMarkets™ response
is quick. Their attitude is flexible and positive. Analyst Insights are globally considered and
significant. Client Services quickly respond to our inquiry and demand. Their wide range of global
surveys help us make our strategic plan.
We hope Knowledge Store will be easier to search
for a report.
VP - Marketing & Business Development
Leading Provider of Process Control Solutions
We engaged with MarketsandMarkets on a study to perform an analysis and recommend a Go-To-Market strategy for metrology and process control in the semiconductor market. The study was tailored to our targets and needs with well-defined milestones. Our overall experience with the MarketsandMarkets team was very good throughout the project in all aspects including the analysis methodologies used, the quality and depth of primary and secondary data sets, the professionalism and flexibility of the team and the ability to meet the target schedule and milestones. We want to thank MarketsandMarkets team for a job well done.
- Rest Of Asia Pacific Image Sensor Market
- Rest Of Middle East Image Sensor Market
- Saudi Arabia Image Sensor Market
- UAE Image Sensor Market
- Argentina Image Sensor Market
- Brazil Image Sensor Market
- Rest Of South America Image Sensor Market
- US Image Sensor Market
- Canada Image Sensor Market
- Mexico Image Sensor Market
- France Image Sensor Market
- Germany Image Sensor Market
- UK Image Sensor Market
- China Image Sensor Market
- Japan Image Sensor Market
- India Image Sensor Market
- Rest Of Europe Image Sensor Market
Growth opportunities and latent adjacency in Image Sensor Market






Lois
Aug, 2018
May I speak with the Analyst to get a better understanding for the breadth and depth of information you provide in this report?.
Lois
Aug, 2018
I would like to speak to an analyst to understand the scope and research methodology of the report and also can I get an sample for same market..
Sam
Apr, 2022
Image Sensor market will be driven by the increasing demand for high-resolution imaging in smartphones, tablets, and laptops. One of the key trends driving the market growth is the increasing adoption of CMOS image sensors..
Chrisy
Feb, 2019
We are an image sensor technology licensing company and interested to understand image sensor market in more detail. .
Vladimir
Feb, 2013
Interested to understand the global trends in the image sensor market over the next 5-10 years and the major players in this space. .
Charles
Oct, 2013
Is it possible to receive a copy of the report while waiting for the customized version? .
User
Jan, 2022
I would like to buy this report..
Mike
Apr, 2015
How supply chain shift of manufacturing companies from China to other countries will affect the market growth?.
Simon
Feb, 2015
How the adoption of embedded vision processors in semiconductors for use in automotive, smart phones, wearables, IP surveillance, robotics will impact the image sensor market ? .
Megan
Aug, 2017
I am a student and am working on a project to build a CMOS wafer fab. Part of the project is a market survey, which is why I am making this request. Let me know if there are any other documents you think might be helpful to me, that I can access..
Atharva
Jul, 2024
2D materials like graphene and MoS₂ are revolutionizing tech with their unique strength, flexibility, and conductivity. These ultra-thin materials promise advancements in electronics, energy storage, and even quantum computing, paving the way for faster, more efficient, and flexible devices.".