Top 10 Medical Devices Market by Type (In Vitro Diagnostic Devices, Cardiovascular, Imaging, Ophthalmology, Endoscopy, Orthopedic, Diabetes Care, Wound Care Devices, Kidney/Dialysis Devices, Respiratory Care) and Region - Global Forecast to 2031

Market Size
$637.42B
MARKET SIZE, 2026
Projected Market Size
$829.69B
MARKET SIZE, 2031
CAGR
5.4%
CAGR (2026-2031)
Forecast Period
2026-2031
FORECAST PERIOD

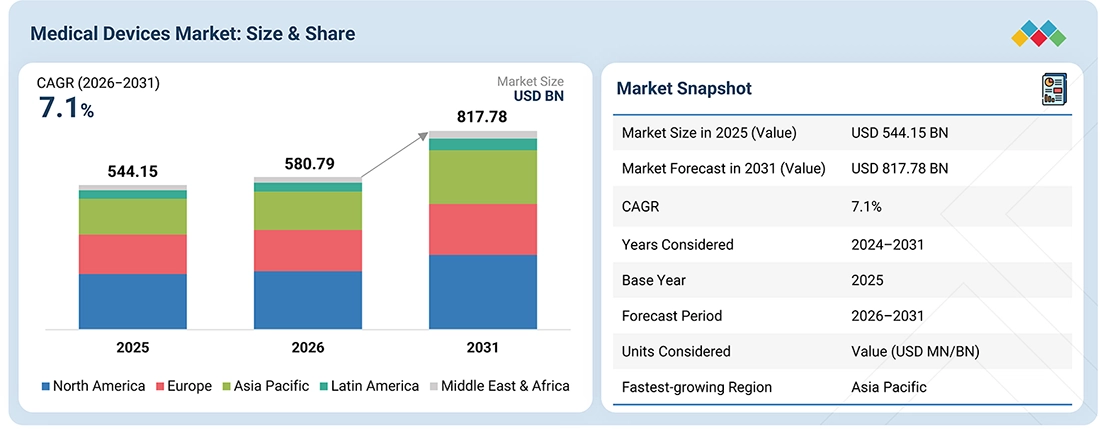
TOP 10 MEDICAL DEVICES MARKET SIZE, SHARE & GROWTH SNAPSHOT

top-10-medical-device-technologies Overview

Source: Secondary Research, Interviews with Experts, MarketsandMarkets Analysis

The global top 10 medical devices market is projected to grow from USD 637.42 billion in 2026 to USD 829.69 billion by 2031, at a CAGR of 5.4% during the forecast period. The market was valued at USD 603.50 billion in 2025. Revenue growth in the market is increasingly shifting toward advanced medical technologies and innovative healthcare solutions, driven by the rising prevalence of chronic diseases, an aging population, and increasing demand for minimally invasive procedures. Continuous technological advancements, expanding healthcare infrastructure, and growing investments in medical innovation worldwide are reshaping adoption patterns and creating new revenue opportunities across healthcare applications.

KEY TAKEAWAYS

  • MARKET SNAPSHOT:
    Base Year Market Size (2025): USD 603.50 Billion
    Current Market Size (2026): USD 637.42 Billion
    Forecast Market Size (2031): USD 829.69 Billion
    CAGR (2026–2031): 5.4%
  • SEGMENT LEADERSHIP:
    Regional Leader: North America accounted for the largest share of 38.5% of the global top 10 medical devices market in 2025.
    Type Leader: In vitro diagnostic devices segment accounted for the largest share of 18.5% of the top 10 medical devices market in 2025.
  • MARKET OUTLOOK & COMPETITIVE LANDSCAPE:
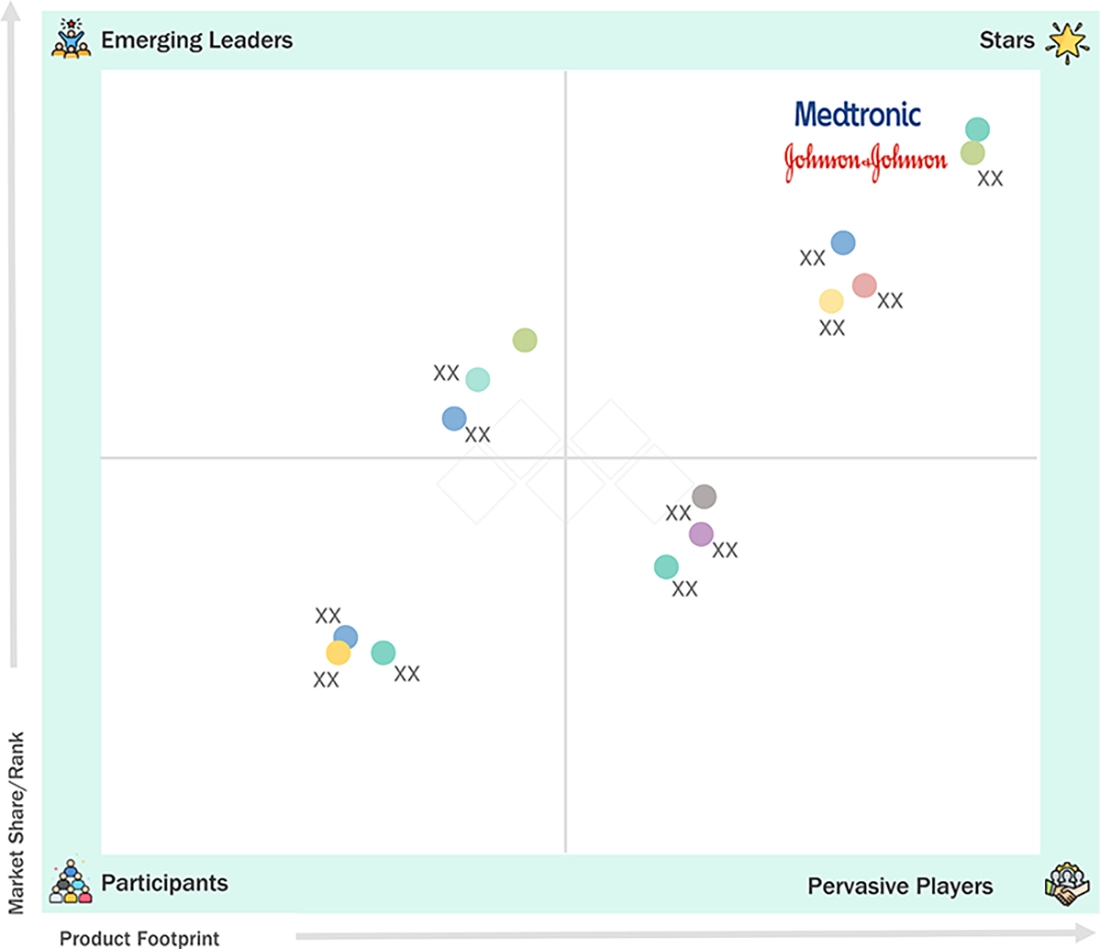
    Johnson & Johnson (US) and Medtronic (Ireland) were recognized as star players due to their established strong product portfolios and geographic presence.
    Canon Medical Systems Corporation (Japan), iVascular (Spain), and Lifetech Scientific Corporation (China) have established themselves among startups and SMEs, supported by strong product portfolios and effective business strategies.

The top 10 medical devices market is growing due to the rising prevalence of chronic diseases, an expanding aging population, and the increasing demand for minimally invasive procedures. Continuous technological advancements in AI-enabled, robotic, and connected medical devices, coupled with higher healthcare spending, expanding healthcare infrastructure, favorable reimbursement policies, and increasing investments in research and development, are further accelerating global market growth.

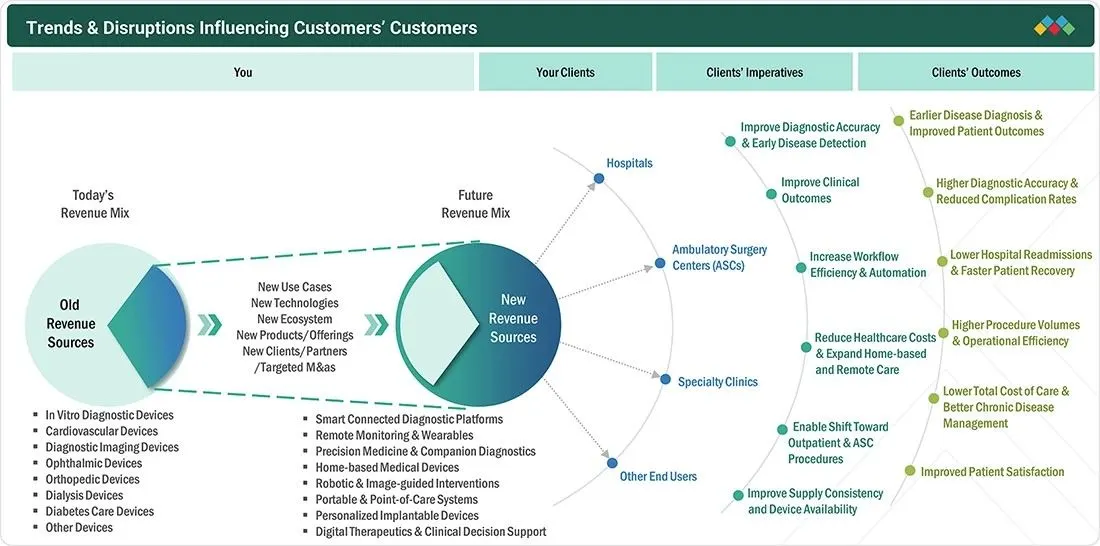
TRENDS & DISRUPTIONS IMPACTING CUSTOMERS' CUSTOMERS

Customers of the top 10 medical devices market, including hospitals, ambulatory surgery centers, clinics, diagnostic laboratories, and home healthcare providers, are experiencing significant changes, driven by digital transformation and evolving care delivery models. The increasing adoption of AI-enabled diagnostics, robotic-assisted procedures, remote patient monitoring, and connected medical devices is improving clinical efficiency and patient outcomes. At the same time, the shift toward outpatient and home-based care is increasing demand for portable and minimally invasive technologies. However, healthcare providers also face disruptions from rising cost pressures, workforce shortages, cybersecurity risks associated with connected devices, stricter regulatory requirements, supply chain vulnerabilities, and growing expectations for value-based and personalized healthcare solutions.

top-10-medical-device-technologies Disruptions

Source: Secondary Research, Interviews with Experts, MarketsandMarkets Analysis

MARKET DYNAMICS

Drivers
Impact
Level
  • Increasing prevalence of chronic diseases
  • Rising aging population
RESTRAINTS
Impact
Level
  • High cost of various medical devices
OPPORTUNITIES
Impact
Level
  • Rapidly developing healthcare sector in emerging economies
CHALLENGES
Impact
Level
  • Stringent regulatory framework
  • Shortage of skilled healthcare professionals

Source: Secondary Research, Interviews with Experts, MarketsandMarkets Analysis

Driver: Increasing prevalence of chronic diseases

The increasing burden of chronic diseases is a major driver of the top 10 medical devices market, as conditions such as cardiovascular diseases, diabetes, cancer, neurological disorders, and chronic respiratory diseases require continuous diagnosis, treatment, monitoring, and long-term disease management. The growing prevalence of these conditions has significantly increased demand for advanced diagnostic systems, minimally invasive surgical devices, implantable technologies, patient monitoring equipment, and in vitro diagnostic devices. Additionally, the expanding elderly population, which is more susceptible to chronic illnesses, further accelerates device adoption. Rising healthcare expenditure, improved access to healthcare services, and ongoing technological advancements in AI-enabled, connected, and wearable medical devices are enabling earlier diagnosis and more effective disease management, thereby supporting sustained growth of the global top 10 medical devices market.

Restraint: High cost of various medical devices

The high cost of advanced medical devices is a significant restraint to the growth of the top 10 medical devices market. Sophisticated cardiovascular devices, orthopedic implants, robotic surgical systems, diagnostic imaging equipment, and in vitro diagnostic platforms require substantial investments in research, manufacturing, regulatory compliance, and clinical validation, resulting in high purchase and maintenance costs. These expenses create financial challenges for hospitals, ambulatory surgery centers, and healthcare providers, particularly in low- and middle-income countries with limited healthcare budgets. Additionally, recurring costs associated with consumables, software upgrades, servicing, and staff training increase the total cost of ownership, limiting adoption and slowing the widespread deployment of advanced medical technologies.

Opportunity: Rapidly developing healthcare sector in emerging economies

The rapid development of healthcare infrastructure presents a significant opportunity for the growth of the top 10 medical devices market. Governments and private healthcare providers are investing heavily in new hospitals, specialty clinics, ambulatory surgery centers, diagnostic laboratories, and digital healthcare networks to improve access to quality care. These investments are increasing the demand for advanced diagnostic, surgical, cardiovascular, orthopedic, and patient monitoring devices. Emerging economies are also expanding healthcare coverage and modernizing medical facilities, creating favorable conditions for the adoption of innovative technologies. Furthermore, improvements in healthcare infrastructure support faster integration of AI-enabled, connected, and minimally invasive medical devices, enabling manufacturers to expand their market presence and drive long-term growth.

Challenge: Stringent regulatory framework

Stringent regulatory guidelines for product approval present a significant challenge to the growth of the top 10 medical devices market. Manufacturers must comply with rigorous regulatory requirements, including extensive preclinical testing, clinical evaluations, quality management standards, and post-market surveillance before obtaining approvals from regulatory authorities. These processes increase product development timelines, regulatory costs, and documentation requirements, delaying commercialization of innovative medical technologies. Regulatory standards also vary across countries, requiring manufacturers to meet multiple compliance frameworks for global market entry. Small and mid-sized companies are particularly affected due to limited financial and regulatory resources. As a result, lengthy approval processes and high compliance costs can slow product launches, reduce market accessibility, and limit the pace of innovation across the medical devices industry.

TOP 10 MEDICAL DEVICES MARKET: COMMERCIAL USE CASES ACROSS INDUSTRIES

COMPANY USE CASE DESCRIPTION BENEFITS
Provides a broad portfolio of cardiovascular, neuroscience, medical surgical, diabetes, and patient monitoring devices used across hospitals, ambulatory surgery centers, specialty clinics, and home healthcare | Integrates AI-enabled technologies, digital health platforms, and minimally invasive solutions to support complex clinical workflows globally. Improves clinical outcomes through advanced therapeutic technologies, enhances procedural efficiency, supports remote patient management, reduces hospital stay durations, and enables standardized care delivery across diverse healthcare settings worldwide.
Delivers orthopedic, cardiovascular, surgical, wound management, and vision care devices used in acute care hospitals, specialty centers, ambulatory surgery centers, and ophthalmology clinics | Combines advanced instrumentation, digital surgery technologies, and minimally invasive solutions to optimize surgical care globally. Enhances surgical precision, improves patient safety, supports faster recovery, streamlines operating room workflows, and enables consistent clinical performance across multiple healthcare specialties and care environments.
Offers infusion therapy systems, surgical instruments, dialysis equipment, vascular access devices, anesthesia products, and infection prevention solutions for hospitals, dialysis centers, intensive care units, and outpatient facilities worldwide | Designed for seamless integration into modern healthcare infrastructure. Improves patient safety through standardized therapy delivery, enhances treatment reliability, supports infection prevention initiatives, optimizes clinical workflows, and increases operational efficiency across healthcare institutions.
Provides orthopedic implants, surgical equipment, neurotechnology systems, medical beds, emergency care products, and robotic-assisted surgical platforms used across hospitals, trauma centers, orthopedic clinics, and ambulatory surgery centers globally | Integrates robotics, navigation, and smart operating room technologies. Improves procedural accuracy, enhances surgical planning and workflow efficiency, supports minimally invasive procedures, shortens recovery times, and strengthens hospital productivity through advanced digital and robotic technologies.
Supplies orthopedic reconstruction systems, sports medicine devices, advanced wound management products, ENT technologies, and robotic-assisted surgical platforms for hospitals, wound care centers, orthopedic clinics, and ambulatory surgery centers worldwide | Focuses on minimally invasive and digital surgical solutions. Accelerates wound healing, improves joint restoration outcomes, enhances surgical precision, supports faster patient rehabilitation, and increases procedural consistency through innovative technologies and integrated care solutions across healthcare networks.

Logos and trademarks shown above are the property of their respective owners. Their use here is for informational and illustrative purposes only.

MARKET ECOSYSTEM

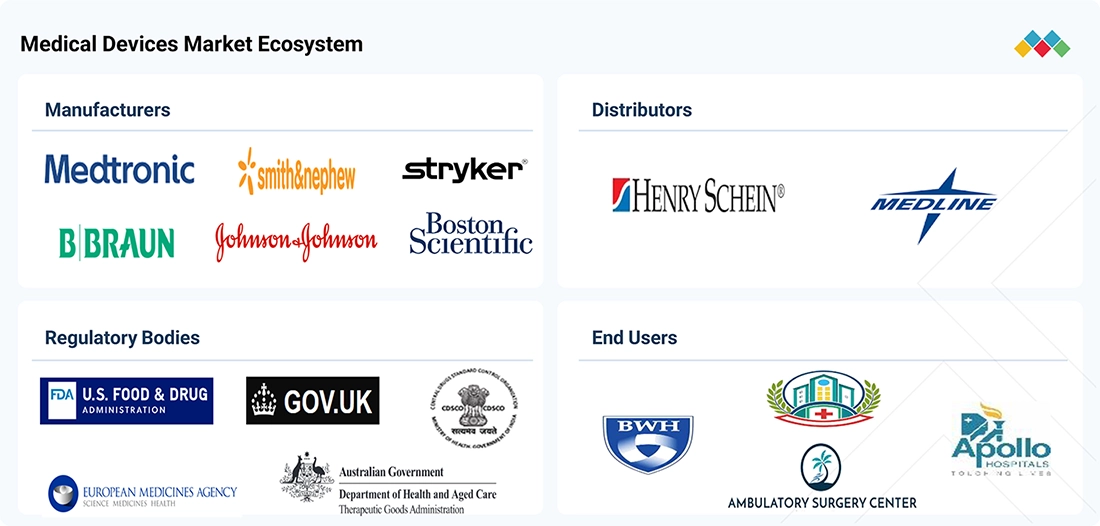
The ecosystem of the top 10 medical devices market comprises raw material suppliers, component manufacturers, contract manufacturers, medical device companies, regulatory authorities, distributors, healthcare providers, and end users. Suppliers provide electronic components, polymers, metals, sensors, and software that are integrated into medical devices by manufacturers. Regulatory agencies ensure product safety, quality, and compliance before commercialization. Distributors and logistics partners facilitate global product availability, while hospitals, ambulatory surgery centers, diagnostic laboratories, specialty clinics, and home healthcare providers drive device adoption. Collaboration among manufacturers, technology companies, research institutions, and healthcare organizations accelerates innovation, digital health integration, and the development of advanced, patient-centric medical technologies.

top-10-medical-device-technologies Ecosystem

Logos and trademarks shown above are the property of their respective owners. Their use here is for informational and illustrative purposes only.

MARKET SEGMENTS

top-10-medical-device-technologies Segments

Source: Secondary Research, Interviews with Experts, MarketsandMarkets Analysis

Top 10 Medical Devices Market, by Type

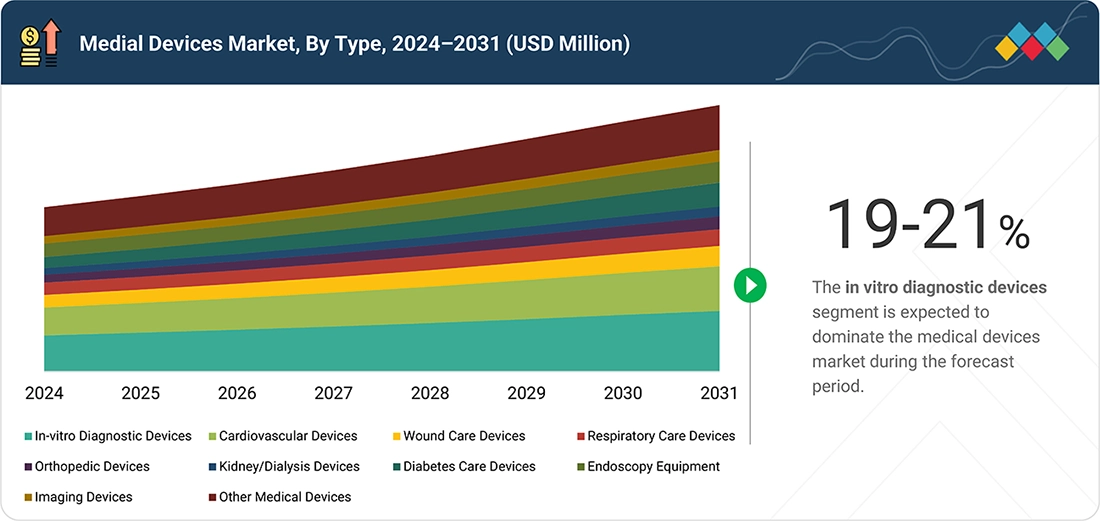
Type Leader: The in vitro diagnostic (IVD) devices segment accounted for the largest share of 18.5% of the top 10 medical devices market in 2025. The segment held the leading position due to its essential role in disease detection, diagnosis, prognosis, and treatment monitoring across virtually all healthcare settings. The rising incidence of chronic diseases, infectious diseases, and cancer has significantly increased the demand for laboratory-based and point-of-care diagnostic testing. Continuous advancements in molecular diagnostics, immunoassays, clinical chemistry, hematology, and automation have improved test accuracy, speed, and efficiency. Additionally, growing awareness of preventive healthcare, expanding diagnostic infrastructure, favorable reimbursement policies in developed countries, and increasing adoption of decentralized testing have further accelerated IVD utilization, enabling the segment to maintain its leading market position

REGION

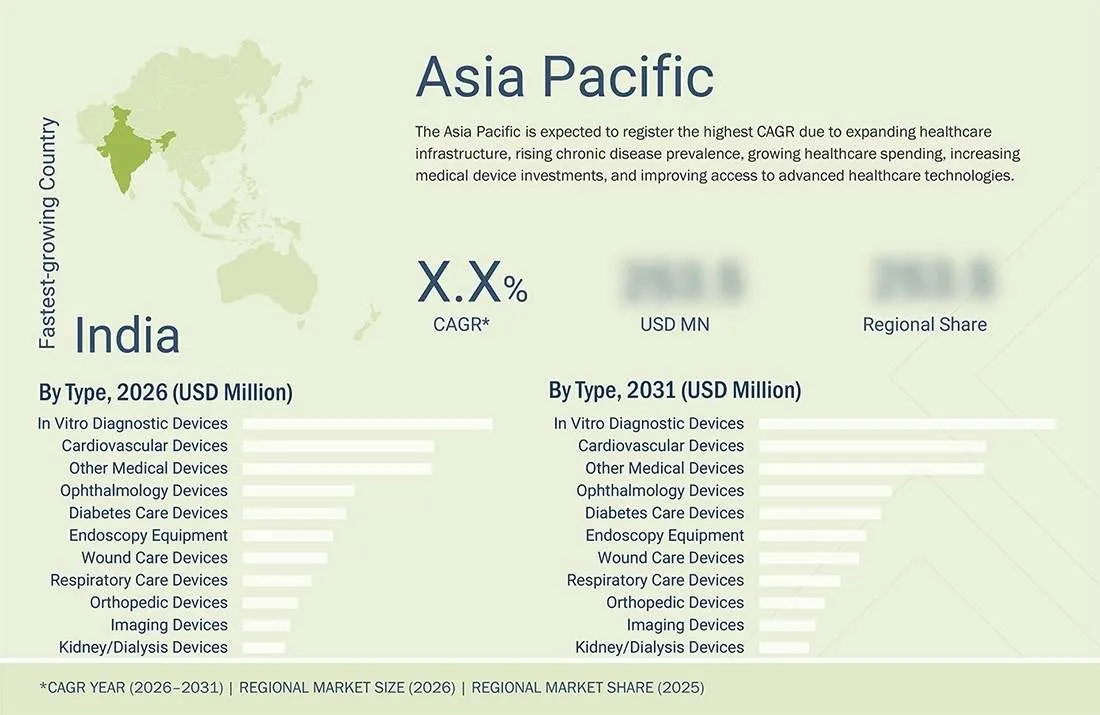
Asia Pacific to be fastest-growing regional segment in top 10 medical devices market during forecast period

The Asia Pacific region is expected to register the highest CAGR in the top 10 medical devices market during the forecast period due to its rapidly expanding healthcare infrastructure, rising healthcare expenditure, and increasing demand for advanced medical technologies. The growing prevalence of chronic diseases, a large and aging population, and improving access to healthcare services are driving demand for diagnostic, cardiovascular, orthopedic, and surgical devices. Governments across countries such as China, India, Japan, and South Korea are investing in healthcare modernization and encouraging domestic medical device manufacturing. Additionally, expanding medical tourism, increasing adoption of minimally invasive procedures, favorable regulatory reforms, and rising investments by global medical device manufacturers are further accelerating regional market growth.

North America accounted for the largest share of the top 10 medical devices market in 2025

North America accounted for the largest share of 38.5% of the global top 10 medical devices market in 2025, supported by advanced healthcare infrastructure, high healthcare expenditure, strong adoption of innovative medical technologies, and the presence of leading medical device manufacturers. The US represents the major contributor to regional growth due to increasing investments in healthcare innovation, advanced diagnostic and therapeutic technologies, favorable reimbursement policies, and strong research and development activities. Canada also contributes to regional expansion through healthcare modernization initiatives and increasing adoption of advanced medical devices.

top-10-medical-device-technologies Region

TOP 10 MEDICAL DEVICES MARKET: COMPANY EVALUATION MATRIX

In the top 10 medical devices market matrix, Medtronic (Ireland) (Star) and Johnson & Johnson (US) (Star) lead with their unmatched global presence, strong brand recognition, and comprehensive portfolios of medical devices.

top-10-medical-device-technologies Evaluation Metrics

Source: Secondary Research, Interviews with Experts, MarketsandMarkets Analysis

KEY MARKET PLAYERS

MARKET SCOPE

REPORT METRIC DETAILS
Base Year 2025
Base Year Market Size (2025) USD 603.50 Billion
Current Market Size (2026) USD 637.42 Billion
Projected Market Size (2031) USD 829.69 Billion
Growth Rate CAGR of 5.4% from 2026–2031
Forecast Period 2026–2031
Years Considered 2024–2031
Units Considered Value (USD Million/Billion), Volume (Thousand Units)
Report Coverage Revenue Forecast, Company Ranking, Competitive Landscape, Growth Factors, and Trends
Segments Covered By Type and Region
Regional Scope North America, Asia Pacific, Europe, Latin America, Middle East & Africa
Report Code MD 1007
Published 2026-07-21
Prepared By MarketsandMarkets™ Healthcare Research Team
Last Reviewed 2026-07-24

WHAT IS IN IT FOR YOU: TOP 10 MEDICAL DEVICES MARKET REPORT CONTENT GUIDE

top-10-medical-device-technologies Content Guide

DELIVERED CUSTOMIZATIONS

We have successfully delivered the following deep-dive customizations:

CLIENT REQUEST CUSTOMIZATION DELIVERED VALUE ADDS
Company Information
  • Market share analysis, by region (North America and Europe), which provides market shares of the top 3–5 key players in the top 10 medical devices market
  • Competitive leadership mapping for established players in the US
Insights on market share analysis by country
Geographic Analysis
  • Further breakdown of the Rest of Europe top 10 medical devices market into Russia, Switzerland, Denmark, Austria, and others
  • Further breakdown of the Rest of Asia Pacific top 10 medical devices market into South Korea, Taiwan, and others
  • Further breakdown of the Rest of Latin America top 10 medical devices market into Argentina, Colombia, Chile, Ecuador, and others
Country-level demand mapping for new product launches and localization strategy planning 

RECENT DEVELOPMENTS

Leading medical device companies continue to strengthen their market positions through commercial product launches, regulatory approvals, and technology innovations across cardiovascular care and diabetes management. These recent developments highlight the industry's focus on expanding access to advanced medical technologies, improving patient outcomes, and accelerating the adoption of next-generation medical devices across global healthcare markets.

  • June 2026 : Johnson & Johnson announced the commercial launch of the Dual Energy THERMOCOOL SMARTTOUCH SF (DE STSF) Platform in Europe, expanding access to a dual-energy catheter ablation solution that supports personalized treatment across diverse clinical workflows and procedural strategies while strengthening the company's cardiovascular technology portfolio.
  • February 2026 : Medtronic announced the commercial launch of the MiniMed Go Smart MDI System with the Simplera sensor in Europe. The system integrates data from the InPen smart insulin pen and the Simplera continuous glucose sensor into a single mobile application, enabling people with diabetes who use multiple daily insulin injections (MDI) to make more informed treatment decisions, improve glycemic management, and expand access to connected diabetes care solutions.
  • April 2025 : Medtronic Plc received US Food and Drug Administration (FDA) approval for the Simplera Sync sensor, enabling its integration with the MiniMed 780G system. The approval expands the company's continuous glucose monitoring (CGM) portfolio, strengthens its advanced automated insulin delivery (AID) ecosystem, and supports broader adoption of integrated diabetes management technologies.


Table of Contents

checkmarkExclusive indicates content/data unique to MarketsandMarkets and not available with any competitors.

TITLE
PAGE NO
1
INTRODUCTION


24
2
EXECUTIVE SUMMARY


28
3
PREMIUM INSIGHTS


33
4
MARKET OVERVIEW
Point-of-care testing and AI in diagnostics drive market growth despite regulatory and cost challenges.


36
 
4.1
INTRODUCTION


4.2
MARKET DYNAMICS


4.2.1
IN VITRO DIAGNOSTIC DEVICES MARKET


4.2.1.1
DRIVERS


4.2.1.1.1
GRADUAL SHIFT FROM CENTRALIZED TESTING TO POINT-OF-CARE TESTING


4.2.1.1.2
GROWING AWARENESS OF EARLY DISEASE DIAGNOSIS ACROSS EMERGING COUNTRIES


4.2.1.2
RESTRAINTS


4.2.1.2.1
REIMBURSEMENT PRESSURE AND TEST-PRICE CONTROLS


4.2.1.3
OPPORTUNITIES


4.2.1.3.1
EXPANSION OF COMPANION DIAGNOSTICS (CDX) AND ONCOLOGY TESTING


4.2.1.4
CHALLENGES


4.2.1.4.1
OPERATIONAL BARRIERS AND DATA PRIVACY AND CYBERSECURITY RISKS


4.2.2
CARDIOVASCULAR DEVICES MARKET


4.2.2.1
DRIVERS


4.2.2.1.1
RISING PREVALENCE OF CARDIOVASCULAR DISEASES


4.2.2.2
RESTRAINTS


4.2.2.2.1
STRINGENT REGULATORY GUIDELINES FOR PRODUCT APPROVAL


4.2.2.3
OPPORTUNITIES


4.2.2.3.1
GROWING HEALTHCARE NEEDS AND IMPROVING MEDICAL INFRASTRUCTURE IN EMERGING COUNTRIES


4.2.2.4
CHALLENGES


4.2.2.4.1
PRODUCT RECALLS AND DEVICE-RELATED SAFETY EVENTS


4.2.3
IMAGING DEVICES MARKET


4.2.3.1
DRIVERS


4.2.3.1.1
INCREASING FUNDS, INVESTMENTS, AND GRANTS BY PUBLIC-PRIVATE INVESTORS


4.2.3.2
RESTRAINTS


4.2.3.2.1
HIGH COST OF DIAGNOSTIC IMAGING SYSTEMS


4.2.3.3
OPPORTUNITIES


4.2.3.3.1
GROWING ADOPTION OF ARTIFICIAL INTELLIGENCE (AI) AND ADVANCED ANALYTICS


4.2.3.4
CHALLENGES


4.2.3.4.1
INCREASING ADOPTION OF REFURBISHED DIAGNOSTIC IMAGING SYSTEMS


4.2.4
ORTHOPEDIC DEVICES MARKET


4.2.4.1
DRIVERS


4.2.4.1.1
RISING PREVALENCE OF ORTHOPEDIC DISEASES


4.2.4.2
RESTRAINTS


4.2.4.2.1
RISKS AND COMPLICATIONS ASSOCIATED WITH ORTHOPEDIC SURGICAL PROCEDURES


4.2.4.2.2
HIGH COST OF ORTHOPEDIC DEVICES AND SURGICAL PROCEDURES


4.2.4.3
OPPORTUNITIES


4.2.4.3.1
INCREASING ADOPTION OF ROBOTICS AND 3D PRINTING IN ORTHOPEDICS


4.2.4.4
CHALLENGES


4.2.4.4.1
SHORTAGE OF ORTHOPEDIC SURGEONS


4.2.5
OPHTHALMOLOGY DEVICES MARKET


4.2.5.1
DRIVERS


4.2.5.1.1
RISING PREVALENCE OF EYE DISORDERS


4.2.5.2
RESTRAINTS


4.2.5.2.1
HIGH COST & POTENTIAL RISKS ASSOCIATED WITH EYE SURGERY


4.2.5.3
OPPORTUNITIES


4.2.5.3.1
GROWING ADOPTION OF MINIMALLY INVASIVE OPHTHALMIC SURGICAL PROCEDURES


4.2.5.4
CHALLENGES


4.2.5.4.1
LOW ACCESSIBILITY TO EYE CARE SERVICES IN EMERGING AND LOW-INCOME COUNTRIES


4.2.6
ENDOSCOPY DEVICES MARKET


4.2.6.1
DRIVERS


4.2.6.1.1
RISING INVESTMENTS, FUNDING, AND GRANTS FOR ENDOSCOPY PROCEDURES


4.2.6.1.2
INCREASING INCIDENCE OF INFLAMMATORY BOWEL DISEASE (IBD) AND COLORECTAL CANCER


4.2.6.2
RESTRAINTS


4.2.6.2.1
HIGH OVERHEAD COST AND PROCEDURAL RISKS ASSOCIATED WITH ENDOSCOPY


4.2.6.3
OPPORTUNITIES


4.2.6.3.1
RAPIDLY DEVELOPING HEALTHCARE SECTOR IN EMERGING ECONOMIES


4.2.6.4
CHALLENGES


4.2.6.4.1
INCREASING NUMBER OF PRODUCT RECALLS


4.2.6.5
LACK OF PROPER STERILIZATION AND REPROCESSING


4.2.7
DIABETES CARE DEVICES MARKET


4.2.7.1
DRIVERS


4.2.7.1.1
INCREASING PREVALENCE OF DIABETES


4.2.7.2
RESTRAINTS


4.2.7.2.1
HIGH COST OF ADVANCED DIABETES CARE DEVICES


4.2.7.3
OPPORTUNITIES


4.2.7.3.1
INCREASING ADOPTION OF ADVANCED IMPLANTABLE CONTINUOUS GLUCOSE MONITORING (CGM) DEVICES


4.2.7.4
CHALLENGES


4.2.7.4.1
HIGH COSTS AND SOCIOECONOMIC DISPARITIES


4.2.8
WOUND CARE DEVICES MARKET


4.2.8.1
DRIVERS


4.2.8.1.1
RISING INCIDENTS OF TRAUMATIC INJURIES AND BURN CASES


4.2.8.2
RESTRAINTS


4.2.8.2.1
RISKS ASSOCIATED WITH ADVANCED WOUND CARE


4.2.8.3
OPPORTUNITIES


4.2.8.3.1
GROWTH POTENTIAL IN EMERGING ECONOMIES


4.2.8.4
CHALLENGES


4.2.8.4.1
SHORTAGE OF TRAINED PROFESSIONALS AND LIMITED ACCESS TO WOUND CARE DEVICES


4.2.9
KIDNEY/DIALYSIS DEVICES MARKET


4.2.9.1
DRIVERS


4.2.9.1.1
RISING PREVALENCE OF CHRONIC KIDNEY DISEASE (CKD)


4.2.9.2
RESTRAINTS


4.2.9.2.1
RISKS, COMPLICATIONS, AND HIGH PROCEDURAL COSTS ASSOCIATED WITH DIALYSIS TREATMENTS


4.2.9.3
OPPORTUNITIES


4.2.9.3.1
INCREASING NUMBER OF DIALYSIS CENTERS IN EMERGING ECONOMIES


4.2.9.4
CHALLENGES


4.2.9.4.1
INCREASING NUMBER OF PRODUCT RECALLS AND GROWING PREFERENCE FOR RENAL TRANSPLANTATION


4.2.10
RESPIRATORY CARE DEVICES MARKET


4.2.10.1
DRIVERS


4.2.10.1.1
RISING PREVALENCE OF CHRONIC RESPIRATORY DISEASE


4.2.10.2
RESTRAINTS


4.2.10.2.1
UNFAVORABLE REIMBURSEMENT SCENARIO


4.2.10.3
OPPORTUNITIES


4.2.10.3.1
HIGH GROWTH IN DEVELOPING COUNTRIES ACROSS ASIA PACIFIC AND LATIN AMERICA


4.2.10.4
CHALLENGES


4.2.10.4.1
HARMFUL EFFECTS OF CERTAIN DEVICES ON NEONATES
 
 
4.3
UNMET NEEDS & WHITE SPACES


4.3.1
UNMET NEEDS IN MEDICAL DEVICES MARKET


4.3.2
WHITE SPACE OPPORTUNITIES


4.4
INTERCONNECTED MARKETS & CROSS-SECTOR OPPORTUNITIES


4.4.1
INTERCONNECTED MARKETS


4.4.2
CROSS-SECTOR OPPORTUNITIES


4.5
STRATEGIC MOVES BY TIER-1/2/3 PLAYERS


5
INDUSTRY TRENDS
Navigate shifting dynamics with insights on surgical tech trends and tariff impacts on global markets.


63
 
5.1
PORTER’S FIVE FORCES ANALYSIS


5.1.1
THREAT OF NEW ENTRANTS


5.1.2
THREAT OF SUBSTITUTES


5.1.3
BARGAINING POWER OF BUYERS


5.1.4
BARGAINING POWER OF SUPPLIERS


5.1.5
INTENSITY OF COMPETITIVE RIVALRY


5.2
MACROECONOMIC OUTLOOK


5.2.1
INTRODUCTION


5.2.2
GDP TRENDS & FORECAST


5.2.3
TRENDS IN MINIMALLY INVASIVE SURGERY (MIS) INDUSTRY


5.2.4
TRENDS IN SURGICAL ROBOTS INDUSTRY


5.3
SUPPLY CHAIN ANALYSIS


5.4
VALUE CHAIN ANALYSIS


5.5
ECOSYSTEM ANALYSIS


5.6
PRICING ANALYSIS


5.6.1
AVERAGE SELLING PRICE TREND OF MEDICAL DEVICES, BY KEY PLAYER (2023–2025)


AVERAGE SELLING PRICE TREND OF MEDICAL DEVICES, BY REGION


5.7
TRADE ANALYSIS


5.7.1
IMPORT SCENARIO (HS CODE 9018)


5.7.2
EXPORT DATA (HS CODE 9018)


5.8
KEY CONFERENCES & EVENTS, 2026–2027


5.9
TRENDS/DISRUPTIONS IMPACTING CUSTOMERS’ BUSINESSES


5.10
INVESTMENT & FUNDING SCENARIO


5.11
IMPACT OF 2025 US TARIFFS ON MEDICAL DEVICES MARKET


5.11.1
INTRODUCTION


5.11.2
KEY TARIFF RATES


5.11.3
PRICE IMPACT ANALYSIS


5.11.4
IMPACT ON COUNTRIES/REGIONS


5.11.4.1
NORTH AMERICA


5.11.4.2
EUROPE


5.11.4.3
ASIA PACIFIC


5.11.5
END-USE INDUSTRY IMPACT


6
TECHNOLOGICAL ADVANCEMENTS, AI-DRIVEN IMPACT, PATENTS, INNOVATIONS, AND FUTURE APPLICATIONS
AI and IoT innovations drive future medical device market disruption and commercialization.


81
 
6.1
KEY EMERGING TECHNOLOGIES


6.1.1
ROBOTIC-ASSISTED & COMPUTER-ASSISTED INTERVENTIONS


6.1.2
POINT-OF-CARE (POC) & MINIATURIZED DIAGNOSTICS


6.2
COMPLEMENTARY TECHNOLOGIES


6.2.1
DIGITAL INTERNET OF MEDICAL THINGS (IOMT) & CLOUD CONNECTIVITY


6.3
TECHNOLOGY/PRODUCT ROADMAP


6.3.1
SHORT TERM (2025–2027) | FOUNDATION & EARLY COMMERCIALIZATION


6.3.2
MID TERM (2027–2030) | EXPANSION & STANDARDIZATION


6.3.3
LONG TERM (2030–2035+) | MASS COMMERCIALIZATION & DISRUPTION


6.4
PATENT ANALYSIS


6.4.1
INSIGHTS: JURISDICTION & TOP APPLICANT ANALYSIS


6.5
FUTURE APPLICATIONS


6.6
IMPACT OF AI/GEN AI ON MEDICAL DEVICES MARKET


6.6.1
TOP USE CASES & MARKET POTENTIAL


6.6.2
CASE STUDIES OF AI IMPLEMENTATION IN MEDICAL DEVICES MARKET


6.6.3
INTERCONNECTED ADJACENT ECOSYSTEMS & IMPACT ON MARKET PLAYERS


CLIENTS’ READINESS TO ADOPT GENERATIVE AI IN MEDICAL


7
SUSTAINABILITY & REGULATORY LANDSCAPE
Navigate complex eco-regulations to innovate sustainable medical devices and reduce carbon footprint globally.


89
 
7.1
REGIONAL REGULATIONS & COMPLIANCE


7.1.1
REGULATORY BODIES, GOVERNMENT AGENCIES, AND OTHER ORGANIZATIONS


7.1.2
INDUSTRY STANDARDS


7.2
SUSTAINABILITY INITIATIVES


7.2.1
CARBON IMPACT & ECO-APPLICATIONS OF MEDICAL DEVICES MARKET


7.2.1.1
CARBON IMPACT REDUCTION


7.2.1.2
ECO-APPLICATIONS


7.3
SUSTAINABILITY IMPACT & REGULATORY POLICY INITIATIVES


7.4
CERTIFICATIONS, LABELING, AND ECO-STANDARDS


7.5
REIMBURSEMENT ANALYSIS


8
CUSTOMER LANDSCAPE & BUYER BEHAVIOR
Unlock revenue potential by aligning with key stakeholders and addressing unmet needs in medical devices.


96
 
8.1
DECISION-MAKING PROCESS


8.2
BUYER STAKEHOLDERS & BUYING EVALUATION CRITERIA


8.2.1
KEY STAKEHOLDERS IN BUYING PROCESS


8.2.2
KEY BUYING CRITERIA


8.3
ADOPTION BARRIERS & INTERNAL CHALLENGES


8.4
UNMET NEEDS FROM VARIOUS END-USE INDUSTRIES


8.5
MARKET PROFITABILITY


8.5.1
REVENUE POTENTIAL


8.5.2
COST DYNAMICS


8.5.3
MARGIN OPPORTUNITIES IN KEY APPLICATIONS


9
MEDICAL DEVICES MARKET, BY TYPE
Market Size & Growth Rate Forecast Analysis to 2031 in USD Billion | 12 Data Tables


100
 
9.1
INTRODUCTION


9.2
IN VITRO DIAGNOSTIC DEVICES


9.2.1
WIDESPREAD DIAGNOSTIC TESTING TO DRIVE DEMAND FOR IN VITRO DIAGNOSTIC DEVICES


9.3
CARDIOVASCULAR DEVICES


9.3.1
RISING CARDIOVASCULAR DISEASE BURDEN TO DRIVE DEMAND FOR CARDIOVASCULAR DEVICES


9.4
WOUND CARE DEVICES


9.4.1
RISING PREVALENCE OF CHRONIC WOUNDS AND ADVANCED WOUND MANAGEMENT TO DRIVE WOUND CARE DEVICE ADOPTION


9.5
RESPIRATORY CARE DEVICES


9.5.1
SHIFT TOWARD HOME-BASED RESPIRATORY MANAGEMENT AND NONINVASIVE THERAPIES TO DRIVE DEVICE ADOPTION


9.6
ORTHOPEDIC DEVICES


9.6.1
GROWING MUSCULOSKELETAL DISEASE BURDEN AND ADVANCES IN RECONSTRUCTIVE SURGERY TO SUPPORT MARKET GROWTH


9.7
KIDNEY/DIALYSIS DEVICES


9.7.1
RISING BURDEN OF CHRONIC KIDNEY DISEASE AND EXPANDING RENAL REPLACEMENT THERAPIES TO BOOST GROWTH


9.8
DIABETES CARE DEVICES


9.8.1
RISING DIABETES PREVALENCE AND ADVANCES IN CONTINUOUS GLUCOSE MONITORING TO FUEL GROWTH


9.9
ENDOSCOPY DEVICES


9.9.1
GROWING DEMAND FOR MINIMALLY INVASIVE DIAGNOSIS AND THERAPY TO CONTRIBUTE TO MARKET GROWTH


9.10
OPHTHALMOLOGY DEVICES


9.10.1
RISING GLOBAL BURDEN OF VISION IMPAIRMENT TO BOOST MARKET GROWTH


9.11
IMAGING DEVICES


9.11.1
GROWING DEMAND FOR ADVANCED DIAGNOSTIC IMAGING O FUEL GROWTH


9.12
OTHER MEDICAL DEVICES


10
MEDICAL DEVICES MARKET, BY REGION
Comprehensive coverage of 8 Regions with country-level deep-dive of 14 Countries | 30 Data Tables.


116
 
10.1
INTRODUCTION


10.2
NORTH AMERICA


10.2.1
MACROECONOMIC OUTLOOK FOR NORTH AMERICA


10.2.2
US


10.2.2.1
US TO HOLD MAJOR SHARE IN NORTH AMERICAN MEDICAL DEVICES MARKET


10.2.3
CANADA


10.2.3.1
GROWING CHRONIC DISEASE BURDEN AND AGING POPULATION TO SUPPORT CANADA’S MARKET


10.3
EUROPE


10.3.1
MACROECONOMIC OUTLOOK FOR EUROPE


10.3.2
GERMANY


10.3.2.1
GERMANY'S LEADERSHIP IN MEDTECH MANUFACTURING, HOSPITAL MODERNIZATION, AND AGING POPULATION TO SUPPORT MARKET EXPANSION


10.3.3
UK


10.3.3.1
NHS DIAGNOSTIC MODERNIZATION AND MEDTECH INNOVATION TO ACCELERATE MARKET GROWTH


10.3.4
FRANCE


10.3.4.1
FRANCE'S EMPHASIS ON EARLY DIAGNOSIS AND SPECIALIZED CARE TO DRIVE MEDICAL DEVICE DEMAND


10.3.5
ITALY


10.3.5.1
HOSPITAL TECHNOLOGY MODERNIZATION AND EXPANDING SURGICAL CARE TO DRIVE MEDICAL DEVICE DEMAND


10.3.6
SPAIN


10.3.6.1
DIGITAL TRANSFORMATION OF NATIONAL HEALTH SYSTEM TO ACCELERATE MEDICAL DEVICE ADOPTION


10.3.7
REST OF EUROPE


10.4
ASIA PACIFIC


10.4.1
MACROECONOMIC OUTLOOK FOR ASIA PACIFIC


10.4.2
CHINA


10.4.2.1
HEALTHCARE CAPACITY EXPANSION TO DRIVE MEDICAL DEVICE DEMAND IN CHINA


10.4.3
JAPAN


10.4.3.1
HEALTHY AGING POLICIES AND ADVANCED HEALTHCARE DELIVERY TO DRIVE MARKET GROWTH


10.4.4
INDIA


10.4.4.1
EXPANDING SPECIALTY HEALTHCARE ACCESS TO DRIVE MEDICAL DEVICE DEMAND


10.4.5
AUSTRALIA


10.4.5.1
EXPANDING ACCESS TO SPECIALIST HEALTHCARE SERVICES TO SUPPORT MARKET GROWTH


10.4.6
SOUTH KOREA


10.4.6.1
BIOHEALTH INNOVATION AND AI-ENABLED HEALTHCARE TO DRIVE ADOPTION


10.4.7
REST OF ASIA PACIFIC


10.5
LATIN AMERICA


10.5.1
MACROECONOMIC OUTLOOK FOR LATIN AMERICA


10.5.2
BRAZIL


10.5.2.1
STRENGTHENING DOMESTIC HEALTHCARE INNOVATION AND MEDICAL DEVICE PRODUCTION TO BOOST MARKET


10.5.3
MEXICO


10.5.3.1
MEDICAL TECHNOLOGY MANUFACTURING EXPANSION TO SUPPORT GROWTH


10.5.4
REST OF LATIN AMERICA


10.6
MIDDLE EAST & AFRICA


10.6.1
MACROECONOMIC OUTLOOK FOR MIDDLE EAST & AFRICA


10.6.2
GCC COUNTRIES


10.6.2.1
HEALTHCARE TRANSFORMATION PROGRAMS AND SMART HOSPITAL INITIATIVES TO DRIVE MEDICAL DEVICE DEMAND


10.6.3
REST OF MIDDLE EAST & AFRICA


11
COMPETITIVE LANDSCAPE
Discover how strategic maneuvers secure market dominance in medical devices by 2025.


147
 
11.1
INTRODUCTION


11.2
KEY PLAYER STRATEGIES/RIGHT TO WIN


11.2.1
OVERVIEW OF STRATEGIES ADOPTED BY KEY PLAYERS IN MEDICAL DEVICES MARKET


11.3
REVENUE ANALYSIS, 2021–2025


11.4
MARKET SHARE ANALYSIS, 2025


11.4.1
GLOBAL IN VITRO DIAGNOSTIC DEVICES MARKET SHARE ANALYSIS, 2025


11.4.2
GLOBAL CARDIOVASCULAR DEVICES MARKET SHARE ANALYSIS, 2025


11.4.3
GLOBAL ORTHOPEDIC DEVICES MARKET SHARE ANALYSIS, 2025


11.4.4
GLOBAL DIABETES CARE DEVICES MARKET SHARE ANALYSIS, 2025


11.4.5
GLOBAL ENDOSCOPY DEVICES MARKET SHARE ANALYSIS, 2025


11.5
COMPANY EVALUATION MATRIX: KEY PLAYERS, 2025


11.5.1
STARS


11.5.2
EMERGING LEADERS


11.5.3
PERVASIVE PLAYERS


11.5.4
PARTICIPANTS


11.5.5
COMPANY FOOTPRINT: KEY PLAYERS, 2025


11.5.5.1
COMPANY FOOTPRINT


11.5.5.2
REGION FOOTPRINT


11.5.5.3
TYPE FOOTPRINT


11.6
COMPANY EVALUATION MATRIX: STARTUPS/SMES, 2025


11.6.1
PROGRESSIVE COMPANIES


11.6.2
RESPONSIVE COMPANIES


11.6.3
DYNAMIC COMPANIES


11.6.4
STARTING BLOCKS


11.6.5
COMPETITIVE BENCHMARKING: STARTUPS/SMES, 2025


11.6.5.1
DETAILED LIST OF KEY STARTUPS/SMES


11.6.5.2
COMPETITIVE BENCHMARKING OF KEY STARTUPS/SMES


11.7
COMPANY VALUATION & FINANCIAL METRICS


11.7.1
FINANCIAL METRICS


11.7.2
COMPANY VALUATION


11.8
BRAND/PRODUCT COMPARISON


11.9
COMPETITIVE SCENARIO


11.9.1
PRODUCT LAUNCHES & APPROVALS


11.9.2
DEALS


11.9.3
EXPANSION


12
COMPANY PROFILES
In-depth Company Profiles of Leading Market Players with detailed Business Overview, Product and Service Portfolio, Recent Developments, and Unique Analyst Perspective (MnM View)


175
 
12.1
KEY PLAYERS


12.1.1
MEDTRONIC PLC


12.1.1.1
BUSINESS OVERVIEW


12.1.1.2
PRODUCTS OFFERED


12.1.1.3
RECENT DEVELOPMENTS


12.1.1.3.1
PRODUCT LAUNCHES & APPROVALS


12.1.1.4
MNM VIEW


12.1.1.4.1
RIGHT TO WIN


12.1.1.4.2
STRATEGIC CHOICES


12.1.1.4.3
WEAKNESSES & COMPETITIVE THREATS


12.1.2
JOHNSON & JOHNSON


12.1.3
ABBOTT


12.1.4
KONINKLIJKE PHILIPS N.V.


12.1.5
SIEMENS HEALTHINEERS AG


12.1.6
STRYKER CORPORATION


12.1.7
B. BRAUN SE


12.1.8
SMITH & NEPHEW


12.1.9
BOSTON SCIENTIFIC CORPORATION


12.1.10
F. HOFFMANN-LA ROCHE LTD.


12.2
OTHER PLAYERS


12.2.1
BECTON, DICKINSON AND COMPANY


12.2.2
BAXTER INTERNATIONAL, INC.


12.2.3
ZIMMER BIOMET HOLDINGS, INC.


12.2.4
OLYMPUS CORPORATION


12.2.5
TERUMO CORPORATION


12.2.6
FUJIFILM CORPORATION


12.2.7
DANAHER CORPORATION


12.2.8
FRESENIUS SE & CO. KGAA


12.2.9
TELEFLEX INCORPORATED


12.2.10
GE HEALTHCARE TECHNOLOGIES INC.


12.2.11
SHENZHEN MINDRAY BIO-MEDICAL ELECTRONICS CO., LTD.


12.2.12
DEXCOM, INC.


12.2.13
THERMO FISHER SCIENTIFIC INC.


12.2.14
ALCON INC.


12.2.15
NIPRO CORPORATION


13
RESEARCH METHODOLOGY


235
 
13.1
RESEARCH DATA


13.1.1
SECONDARY DATA


13.1.1.1
KEY DATA FROM SECONDARY SOURCES


13.1.2
PRIMARY DATA


13.1.2.1
KEY DATA FROM PRIMARY SOURCES


13.1.2.2
KEY INDUSTRY INSIGHTS


13.2
MARKET SIZE ESTIMATION


13.3
MARKET BREAKDOWN & DATA TRIANGULATION


13.4
MARKET RANKING ANALYSIS


13.5
STUDY ASSUMPTIONS


13.6
RESEARCH LIMITATIONS


13.6.1
METHODOLOGY-RELATED LIMITATIONS


13.6.2
SCOPE-RELATED LIMITATIONS


13.7
RISK ASSESSMENT


14
APPENDIX


248
 
14.1
DISCUSSION GUIDE


14.2
KNOWLEDGESTORE: MARKETSANDMARKETS’ SUBSCRIPTION PORTAL


14.3
CUSTOMIZATION OPTIONS


14.4
RELATED REPORTS


14.5
AUTHOR DETAILS


LIST OF TABLES


TABLE 1
MEDICAL DEVICES MARKET: INCLUSIONS & EXCLUSIONS


TABLE 2
STANDARD CURRENCY CONVERSION RATES


TABLE 3
LIST OF INVESTMENT FOR IMAGING DEVICES


TABLE 4
LIST OF RECALLS BY KEY PLAYERS


TABLE 5
MEDICAL DEVICES MARKET: PORTER’S FIVE FORCES ANALYSIS


TABLE 6
GDP PERCENTAGE CHANGE, BY KEY COUNTRY, 2021–2030


TABLE 7
AVERAGE SELLING PRICE TREND OF MEDICAL DEVICES, BY KEY PLAYER, 2023–2025 (USD)


TABLE 8
AVERAGE PRICING TREND OF MEDICAL DEVICES, BY REGION, 2023–2025 (USD)


TABLE 9
IMPORT DATA FOR MEDICAL DEVICES UNDER HS CODE 9018, BY COUNTRY, 2019–2024 (USD THOUSAND)


TABLE 10
EXPORT DATA FOR MEDICAL DEVICES UNDER HS CODE 9018, BY COUNTRY, 2019–2024 (USD THOUSAND)


TABLE 11
MEDICAL DEVICES MARKET: DETAILED LIST OF KEY CONFERENCES & EVENTS (2026–2027)


TABLE 12
US-ADJUSTED RECIPROCAL TARIFF RATES


TABLE 13
KEY PRODUCT-RELATED TARIFFS EFFECTIVE FOR MEDICAL DEVICES


TABLE 14
AI-ENABLED DIAGNOSTICS, DIGITAL HEALTH, AND PRECISION MEDICINE


TABLE 15
CONNECTED MEDICAL DEVICES, REMOTE MONITORING, AND SMART HEALTHCARE ECOSYSTEMS


TABLE 16
TOP USE CASES & MARKET POTENTIAL


TABLE 17
MEDICAL DEVICES MARKET: CASE STUDIES RELATED TO AI IMPLEMENTATION


TABLE 18
INTERCONNECTED ADJACENT ECOSYSTEMS & IMPACT ON MARKET PLAYERS


TABLE 19
NORTH AMERICA: REGULATORY BODIES, GOVERNMENT AGENCIES, AND OTHER ORGANIZATIONS


TABLE 20
EUROPE: REGULATORY BODIES, GOVERNMENT AGENCIES, AND OTHER ORGANIZATIONS


TABLE 21
ASIA PACIFIC: REGULATORY BODIES, GOVERNMENT AGENCIES, AND OTHER ORGANIZATIONS


TABLE 22
LATIN AMERICA: REGULATORY BODIES, GOVERNMENT AGENCIES, AND OTHER ORGANIZATIONS


TABLE 23
MIDDLE EAST & AFRICA AND GCC COUNTRIES: REGULATORY BODIES, GOVERNMENT AGENCIES, AND OTHER ORGANIZATIONS


TABLE 24
GLOBAL STANDARDS IN MEDICAL DEVICES MARKET


TABLE 25
CERTIFICATIONS, LABELING, AND ECO-STANDARDS IN MEDICAL DEVICES MARKET


TABLE 26
INFLUENCE OF STAKEHOLDERS ON BUYING PROCESS FOR MEDICAL DEVICES


TABLE 27
KEY BUYING CRITERIA FOR TOP THREE MEDICAL DEVICES


TABLE 28
MEDICAL DEVICES MARKET: UNMET NEEDS/END-USER EXPECTATIONS


TABLE 29
MEDICAL DEVICES MARKET, BY TYPE, 2024–2031 (USD BILLION)


TABLE 30
IN VITRO DIAGNOSTIC DEVICES MARKET, BY COUNTRY, 2024–2031 (USD BILLION)


TABLE 31
CARDIOVASCULAR DEVICES MARKET, BY COUNTRY, 2024–2031 (USD BILLION)


TABLE 32
WOUND CARE DEVICES MARKET, BY COUNTRY, 2024–2031 (USD BILLION)


TABLE 33
RESPIRATORY CARE DEVICES MARKET, BY COUNTRY, 2024–2031 (USD BILLION)


TABLE 34
ORTHOPEDIC DEVICES MARKET, BY COUNTRY, 2024–2031 (USD BILLION)


TABLE 35
KIDNEY/DIALYSIS DEVICES MARKET, BY COUNTRY, 2024–2031 (USD BILLION)


TABLE 36
DIABETES CARE DEVICES MARKET, BY COUNTRY, 2024–2031 (USD BILLION)


TABLE 37
ENDOSCOPY DEVICES MARKET, BY COUNTRY, 2024–2031 (USD BILLION)


TABLE 38
OPHTHALMOLOGY DEVICES MARKET, BY COUNTRY, 2024–2031 (USD BILLION)


TABLE 39
IMAGING DEVICES MARKET, BY COUNTRY, 2024–2031 (USD BILLION)


TABLE 40
OTHER MEDICAL DEVICES MARKET, BY COUNTRY, 2024–2031 (USD BILLION)


TABLE 41
MEDICAL DEVICES MARKET, BY REGION, 2024–2031 (USD BILLION)


TABLE 42
NORTH AMERICA: MEDICAL DEVICES MARKET, BY COUNTRY, 2024–2031 (USD BILLION)


TABLE 43
NORTH AMERICA: MEDICAL DEVICES MARKET, BY TYPE, 2024–2031 (USD BILLION)


TABLE 44
US: MEDICAL DEVICES MARKET, BY TYPE, 2024–2031 (USD BILLION)


TABLE 45
CANADA: MEDICAL DEVICES MARKET, BY TYPE, 2024–2031 (USD BILLION)


TABLE 46
EUROPE: MEDICAL DEVICES MARKET, BY COUNTRY, 2024–2031 (USD BILLION)


TABLE 47
EUROPE: MEDICAL DEVICES MARKET, BY TYPE, 2024–2031 (USD BILLION)


TABLE 48
GERMANY: MEDICAL DEVICES MARKET, BY TYPE, 2024–2031 (USD BILLION)


TABLE 49
UK: MEDICAL DEVICES MARKET, BY TYPE, 2024–2031 (USD BILLION)


TABLE 50
FRANCE: MEDICAL DEVICES MARKET, BY TYPE, 2024–2031 (USD BILLION)


TABLE 51
ITALY: MEDICAL DEVICES MARKET, BY TYPE, 2024–2031 (USD BILLION)


TABLE 52
SPAIN: MEDICAL DEVICES MARKET, BY TYPE, 2024–2031 (USD BILLION)


TABLE 53
REST OF EUROPE: MEDICAL DEVICES MARKET, BY TYPE, 2024–2031 (USD BILLION)


TABLE 54
ASIA PACIFIC: MEDICAL DEVICES MARKET, BY COUNTRY, 2024–2031 (USD BILLION)


TABLE 55
ASIA PACIFIC: MEDICAL DEVICES MARKET, BY TYPE, 2024–2031 (USD BILLION)


TABLE 56
CHINA: MEDICAL DEVICES MARKET, BY TYPE, 2024–2031 (USD BILLION)


TABLE 57
JAPAN: MEDICAL DEVICES MARKET, BY TYPE, 2024–2031 (USD BILLION)


TABLE 58
INDIA: MEDICAL DEVICES MARKET, BY TYPE, 2024–2031 (USD BILLION)


TABLE 59
AUSTRALIA: MEDICAL DEVICES MARKET, BY TYPE, 2024–2031 (USD BILLION)


TABLE 60
SOUTH KOREA: MEDICAL DEVICES MARKET, BY TYPE, 2024–2031 (USD BILLION)


TABLE 61
REST OF ASIA PACIFIC: MEDICAL DEVICES MARKET, BY TYPE, 2024–2031 (USD BILLION)


TABLE 62
LATIN AMERICA: MEDICAL DEVICES MARKET, BY COUNTRY, 2024–2031 (USD BILLION)


TABLE 63
LATIN AMERICA: MEDICAL DEVICES MARKET, BY TYPE, 2024–2031 (USD BILLION)


TABLE 64
BRAZIL: MEDICAL DEVICES MARKET, BY TYPE, 2024–2031 (USD BILLION)


TABLE 65
MEXICO: MEDICAL DEVICES MARKET, BY TYPE, 2024–2031 (USD BILLION)


TABLE 66
REST OF LATIN AMERICA: MEDICAL DEVICES MARKET, BY TYPE, 2024–2031 (USD BILLION)


TABLE 67
MIDDLE EAST & AFRICA: MEDICAL DEVICES MARKET, BY REGION, 2024–2031 (USD BILLION)


TABLE 68
MIDDLE EAST & AFRICA: MEDICAL DEVICES MARKET, BY TYPE, 2024–2031 (USD BILLION)


TABLE 69
GCC COUNTRIES: MEDICAL DEVICES MARKET, BY TYPE, 2024–2031 (USD BILLION)


TABLE 70
REST OF MIDDLE EAST & AFRICA: MEDICAL DEVICES MARKET, BY TYPE, 2024–2031 (USD BILLION)


TABLE 71
OVERVIEW OF STRATEGIES DEPLOYED BY KEY PLAYERS IN MEDICAL DEVICES MARKET


TABLE 72
MEDICAL DEVICES MARKET: REGION FOOTPRINT


TABLE 73
MEDICAL DEVICES MARKET: TYPE FOOTPRINT


TABLE 74
MEDICAL DEVICES MARKET: DETAILED LIST OF KEY STARTUPS/SMES


TABLE 75
MEDICAL DEVICES MARKET: COMPETITIVE BENCHMARKING OF KEY STARTUPS/SMES


TABLE 76
MEDICAL DEVICES MARKET: PRODUCT LAUNCHES & APPROVALS, J ANUARY 2022–JUNE 2026


TABLE 77
MEDICAL DEVICES MARKET: DEALS, JANUARY 2022–JUNE 2026


TABLE 78
MEDICAL DEVICES MARKET: EXPANSION, JANUARY 2022–JUNE 2026


TABLE 79
MEDTRONIC PLC: COMPANY OVERVIEW


TABLE 80
MEDTRONIC PLC: PRODUCTS OFFERED


TABLE 81
MEDTRONIC PLC: PRODUCT LAUNCHES & APPROVALS, JANUARY 2021–JUNE 2026


TABLE 82
JOHNSON & JOHNSON: COMPANY OVERVIEW


TABLE 83
JOHNSON & JOHNSON: PRODUCTS OFFERED


TABLE 84
JOHNSON & JOHNSON: PRODUCT LAUNCHES & APPROVALS, JANUARY 2021–JUNE 2026


TABLE 85
JOHNSON & JOHNSON: DEALS, JANUARY 2021–JUNE 2026


TABLE 86
JOHNSON & JOHNSON: EXPANSIONS, JANUARY 2021–JUNE 2026


TABLE 87
ABBOTT: COMPANY OVERVIEW


TABLE 88
ABBOTT: PRODUCTS OFFERED


TABLE 89
ABBOTT: PRODUCT LAUNCHES & APPROVALS, JANUARY 2022–JUNE 2026


TABLE 90
ABBOTT: DEALS, JANUARY 2022–JUNE 2026


TABLE 91
ABBOTT: EXPANSIONS, JANUARY 2022–JUNE 2026


TABLE 92
KONINKLIJKE PHILIPS N.V.: COMPANY OVERVIEW


TABLE 93
KONINKLIJKE PHILIPS N.V.: PRODUCTS OFFERED


TABLE 94
KONINKLIJKE PHILIPS N.V.: PRODUCT LAUNCHES, JANUARY 2022–JUNE 2026


TABLE 95
KONINKLIJKE PHILIPS N.V.: DEALS, JANUARY 2022–JUNE 2026


TABLE 96
KONINKLIJKE PHILIPS N.V.: EXPANSIONS, JANUARY 2022–JUNE 2026


TABLE 97
SIEMENS HEALTHINEERS AG: COMPANY OVERVIEW


TABLE 98
SIEMENS HEALTHINEERS AG: PRODUCTS OFFERED


TABLE 99
SIEMENS HEALTHINEERS AG: PRODUCT LAUNCHES & APPROVALS, JANUARY 2022–JUNE 2026


TABLE 100
SIEMENS HEALTHINEERS AG: DEALS, JANUARY 2021–JUNE 2026


TABLE 101
SIEMENS HEALTHINEERS AG: EXPANSIONS, JANUARY 2021–JUNE 2026


TABLE 102
STRYKER CORPORATION: COMPANY OVERVIEW


TABLE 103
STRYKER CORPORATION: PRODUCTS OFFERED


TABLE 104
STRYKER CORPORATION: DEALS, JANUARY 2021–JUNE 2026


TABLE 105
B. BRAUN SE: COMPANY OVERVIEW


TABLE 106
B. BRAUN SE: PRODUCTS OFFERED


TABLE 107
B. BRAUN SE: DEALS, JANUARY 2021–JUNE 2026


TABLE 108
B. BRAUN SE: EXPANSIONS, JANUARY 2021–JUNE 2026


TABLE 109
SMITH & NEPHEW: COMPANY OVERVIEW


TABLE 110
SMITH & NEPHEW: PRODUCTS OFFERED


TABLE 111
SMITH & NEPHEW: PRODUCT LAUNCHES, JANUARY 2021–JUNE 2026


TABLE 112
BOSTON SCIENTIFIC CORPORATION: COMPANY OVERVIEW


TABLE 113
BOSTON SCIENTIFIC CORPORATION: PRODUCTS OFFERED


TABLE 114
BOSTON SCIENTIFIC CORPORATION: PRODUCT APPROVALS, J ANUARY 2021–JUNE 2026


TABLE 115
BOSTON SCIENTIFIC CORPORATION: DEALS, JANUARY 2022–JUNE 2026


TABLE 116
F. HOFFMANN-LA ROCHE LTD.: COMPANY OVERVIEW


TABLE 117
F. HOFFMANN-LA ROCHE LTD.: PRODUCTS OFFERED


TABLE 118
F. HOFFMANN-LA ROCHE LTD.: PRODUCT LAUNCHES & APPROVALS, JANUARY 2022–JUNE 2026


TABLE 119
F. HOFFMANN-LA ROCHE LTD.: DEALS, JANUARY 2022–JUNE 2026


TABLE 120
BECTON, DICKINSON AND COMPANY: BUSINESS OVERVIEW


TABLE 121
BAXTER INTERNATIONAL, INC.: BUSINESS OVERVIEW


TABLE 122
ZIMMER BIOMET HOLDINGS, INC.: BUSINESS OVERVIEW


TABLE 123
OLYMPUS CORPORATION: BUSINESS OVERVIEW


TABLE 124
TERUMO CORPORATION: BUSINESS OVERVIEW


TABLE 125
FUJIFILM CORPORATION: BUSINESS OVERVIEW


TABLE 126
DANAHER CORPORATION: BUSINESS OVERVIEW


TABLE 127
FRESENIUS SE & CO. KGAA: BUSINESS OVERVIEW


TABLE 128
TELEFLEX INCORPORATED: BUSINESS OVERVIEW


TABLE 129
GE HEALTHCARE TECHNOLOGIES INC.: BUSINESS OVERVIEW


TABLE 130
SHENZHEN MINDRAY BIO-MEDICAL ELECTRONICS CO., LTD.: BUSINESS OVERVIEW


TABLE 131
DEXCOM, INC.: BUSINESS OVERVIEW


TABLE 132
THERMO FISHER SCIENTIFIC INC.: BUSINESS OVERVIEW


TABLE 133
ALCON INC.: BUSINESS OVERVIEW


TABLE 134
NIPRO CORPORATION: BUSINESS OVERVIEW


TABLE 135
MEDICAL DEVICES MARKET: STUDY ASSUMPTIONS


TABLE 136
MEDICAL DEVICES MARKET: RISK ASSESSMENT ANALYSIS


LIST OF FIGURES


FIGURE 1
MEDICAL DEVICES MARKET SEGMENTATION & REGIONAL SCOPE


FIGURE 2
KEY INSIGHTS & MARKET HIGHLIGHTS


FIGURE 3
MEDICAL DEVICES MARKET, 2026 – 2031


FIGURE 4
MAJOR STRATEGIES ADOPTED BY KEY PLAYERS IN MEDICAL DEVICES MARKET


FIGURE 5
DISRUPTIVE TRENDS IMPACTING GROWTH OF MEDICAL DEVICES MARKET


FIGURE 6
HIGH-GROWTH SEGMENTS & EMERGING FRONTIERS IN MEDICAL DEVICES MARKET, 2025


FIGURE 7
NORTH AMERICA TO HOLD LARGEST MARKET SHARE IN 2025


FIGURE 8
RISING PREVALENCE OF CHRONIC DISEASES TO DRIVE MARKET GROWTH


FIGURE 9
INDIA TO REGISTER HIGHEST CAGR DURING FORECAST PERIOD


FIGURE 10
EMERGING ECONOMIES TO REGISTER HIGHER GROWTH RATES DURING FORECAST PERIOD


FIGURE 11
IN VITRO DIAGNOSTIC DEVICES MARKET: DRIVERS, RESTRAINTS, OPPORTUNITIES, AND CHALLENGES


FIGURE 12
CARDIOVASCULAR DEVICES MARKET: DRIVERS, RESTRAINTS, OPPORTUNITIES, AND CHALLENGES


FIGURE 13
IMAGING DEVICES MARKET: DRIVERS, RESTRAINTS, OPPORTUNITIES, AND CHALLENGES


FIGURE 14
ORTHOPEDIC DEVICES MARKET: DRIVERS, RESTRAINTS, OPPORTUNITIES, AND CHALLENGES


FIGURE 15
OPHTHALMOLOGY DEVICES MARKET: DRIVERS, RESTRAINTS, OPPORTUNITIES, AND CHALLENGES


FIGURE 16
ENDOSCOPY DEVICES MARKET: DRIVERS, RESTRAINTS, OPPORTUNITIES, AND CHALLENGES


FIGURE 17
DIABETES CARE DEVICES MARKET: DRIVERS, RESTRAINTS, OPPORTUNITIES, AND CHALLENGES


FIGURE 18
WOUND CARE DEVICES MARKET: DRIVERS, RESTRAINTS, OPPORTUNITIES, AND CHALLENGES


FIGURE 19
KIDNEY/DIALYSIS DEVICES MARKET: DRIVERS, RESTRAINTS, OPPORTUNITIES, AND CHALLENGES


FIGURE 20
RESPIRATORY DEVICES MARKET: DRIVERS, RESTRAINTS, OPPORTUNITIES, AND CHALLENGES


FIGURE 21
MEDICAL DEVICES MARKET: PORTER’S FIVE FORCES ANALYSIS


FIGURE 22
MEDICAL DEVICES MARKET: SUPPLY CHAIN ANALYSIS


FIGURE 23
MEDICAL DEVICES MARKET: VALUE CHAIN ANALYSIS


FIGURE 24
MEDICAL DEVICES MARKET: ECOSYSTEM ANALYSIS


FIGURE 25
TRENDS/DISRUPTIONS IMPACTING CUSTOMERS’ BUSINESSES


FIGURE 26
MEDICAL DEVICES MARKET: INVESTMENT & FUNDING SCENARIO


FIGURE 27
NUMBER OF PATENTS PUBLISHED (JANUARY 2015–JUNE 2026)


FIGURE 28
TOP APPLICANT COUNTRIES/REGIONS FOR MEDICAL DEVICES (JANUARY 2015−JUNE 2026)


FIGURE 29
INFLUENCE OF STAKEHOLDERS ON BUYING PROCESS FOR MEDICAL DEVICES


FIGURE 30
KEY BUYING CRITERIA FOR MEDICAL DEVICES


FIGURE 31
MEDICAL DEVICES MARKET: GEOGRAPHIC SNAPSHOT


FIGURE 32
NORTH AMERICA: MEDICAL DEVICES MARKET SNAPSHOT


FIGURE 33
ASIA PACIFIC: MEDICAL DEVICES MARKET SNAPSHOT


FIGURE 34
REVENUE ANALYSIS OF KEY PLAYERS IN MEDICAL DEVICES MARKET (2021–2025)


FIGURE 35
MARKET SHARE ANALYSIS OF KEY PLAYERS IN IN VITRO DIAGNOSTIC DEVICES MARKET (2025)


FIGURE 36
MARKET SHARE ANALYSIS OF KEY PLAYERS IN CARDIOVASCULAR DEVICES MARKET (2025)


FIGURE 37
MARKET SHARE ANALYSIS OF KEY PLAYERS IN ORTHOPEDIC DEVICES MARKET (2025)


FIGURE 38
MARKET SHARE ANALYSIS OF KEY PLAYERS IN DIABETES CARE DEVICES MARKET (2025)


FIGURE 39
MARKET SHARE ANALYSIS OF KEY PLAYERS IN ENDOSCOPY DEVICES MARKET (2025)


FIGURE 40
MEDICAL DEVICES MARKET: COMPANY EVALUATION MATRIX (KEY PLAYERS), 2025


FIGURE 41
MEDICAL DEVICES MARKET: COMPANY FOOTPRINT


FIGURE 42
MEDICAL DEVICES MARKET: COMPANY EVALUATION MATRIX (STARTUPS/SMES), 2025


FIGURE 43
EV/EBITDA OF KEY VENDORS


FIGURE 44
YEAR-TO-DATE (YTD) PRICE TOTAL RETURN AND 5-YEAR STOCK BETA OF KEY VENDORS


FIGURE 45
MEDICAL DEVICES MARKET: BRAND/PRODUCT COMPARATIVE ANALYSIS


FIGURE 46
MEDTRONIC PLC: COMPANY SNAPSHOT (2025)


FIGURE 47
JOHNSON & JOHNSON: COMPANY SNAPSHOT (2025)


FIGURE 48
ABBOTT: COMPANY SNAPSHOT (2025)


FIGURE 49
KONINKLIJKE PHILIPS N.V.: COMPANY SNAPSHOT (2025)


FIGURE 50
SIEMENS HEALTHINEERS AG: COMPANY SNAPSHOT (2025)


FIGURE 51
STRYKER CORPORATION: COMPANY SNAPSHOT (2025)


FIGURE 52
B. BRAUN SE: COMPANY SNAPSHOT (2025)


FIGURE 53
SMITH & NEPHEW: COMPANY SNAPSHOT (2025)


FIGURE 54
BOSTON SCIENTIFIC CORPORATION: COMPANY SNAPSHOT (2025)


FIGURE 55
F. HOFFMANN-LA ROCHE LTD.: COMPANY SNAPSHOT (2025)


FIGURE 56
RESEARCH DESIGN


FIGURE 57
PRIMARY SOURCES


FIGURE 58
PRIMARY BREAKDOWN OF PRIMARY INTERVIEWS: BY COMPANY TYPE, DESIGNATION, AND REGION


FIGURE 59
MARKET SIZE APPROACH: REVENUE SHARE ANALYSIS


FIGURE 60
TOP-DOWN APPROACH


FIGURE 61
BOTTOM-UP APPROACH


FIGURE 62
IMPACT ANALYSIS OF DRIVERS, RESTRAINTS, OPPORTUNITIES, AND CHALLENGES (2026–2031)


FIGURE 63
MEDICAL DEVICES MARKET: CAGR PROJECTIONS


FIGURE 64
DATA TRIANGULATION METHODOLOGY


Methodology

The research study aimed to estimate the current size of the top 10 medical devices market through several key activities. Comprehensive secondary research was conducted to gather information on the industry. The next step involved validating these findings, assumptions, and size estimates with industry experts across the value chain through primary research. To estimate the total market size, both top-down and bottom-up approaches were utilized. Following this, market segmentation and data triangulation procedures were employed to determine the sizes of different segments and subsegments within the top 10 medical devices market.

Secondary Research

The secondary research process involved the widespread use of secondary sources, directories, databases (such as Bloomberg Businessweek, Factiva, and D&B Hoovers), white papers, annual reports, investor presentations, SEC filings of companies and publications from government sources, such as National Institutes of Health (NIH), US FDA, US Census Bureau, World Health Organization (WHO), International Trade Administration (ITA), Global Burden of Disease Study, and Centers for Medicare and Medicaid Services (CMS) were referred to in order to identify and collect information for the global top 10 medical devices market study. It was also used to obtain important information on key players, market classification & segmentation aligned with industry trends, and key developments from market and technology perspectives, down to the bottom-most level. A database of the key industry leaders was also prepared using secondary research.

Primary Research

In the primary research process, various sources from both the supply and demand sides were interviewed to obtain qualitative and quantitative information for this report. The primary sources on the supply side include industry experts, such as CEOs, vice presidents, marketing and sales directors, technology & innovation directors, and other key executives from leading companies and organizations in the top 10 medical devices market. The primary demand-side sources include ambulatory surgical centers, hospitals, clinics, and other end users. Primary research was conducted to validate the market segmentation, identify key players and gather insights into key industry trends & key market dynamics.

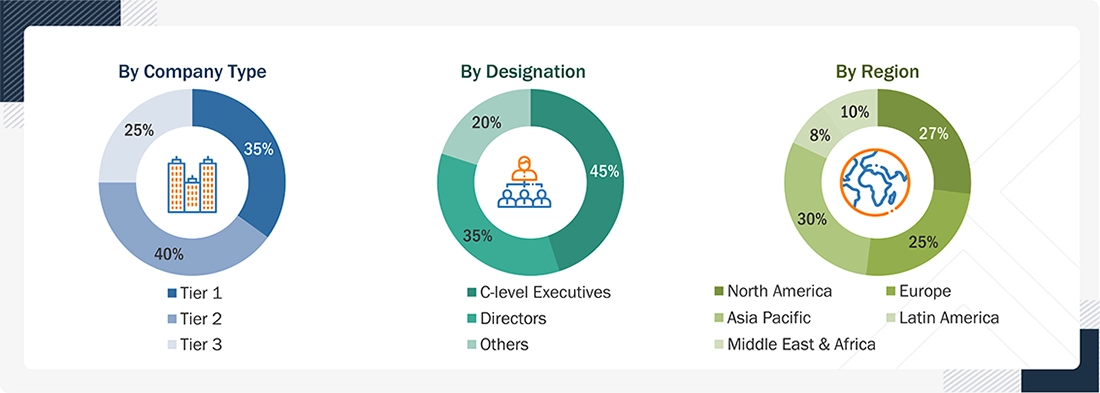
A breakdown of the primary respondents is provided below:

Top 10 Medical Devices Market Size, and Share

Note 1: C-level executives include CEOs, CFOs, COOs, and VPs.
Note 2: Others include sales managers, marketing managers, business development managers, product managers, distributors, and suppliers.
Note 3: Companies are classified into tiers based on their total revenue. The tiers are as follows:
Tier 1 = > USD 10 billion, Tier 2 = USD 1 billion to USD 10 billion, and Tier 3 = <USD 1 billion

To know about the assumptions considered for the study, download the pdf brochure

Market Size Estimation

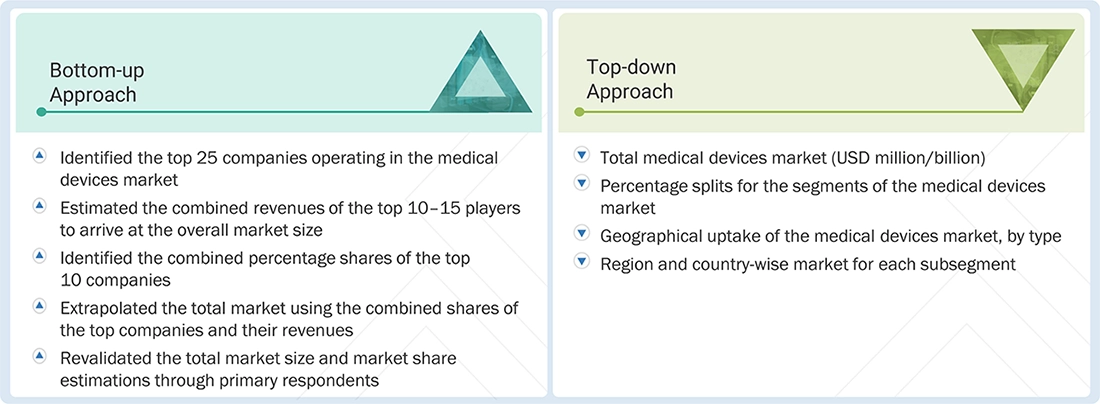
For the global market value, annual revenue figures were calculated based on the revenue mapping of major product manufacturers and OEMs active in the top 10 medical devices market. All major product manufacturers were identified at the global and/or country/regional level. Revenue mapping for respective business segments/subsegments was done for the major players. Also, the top 10 medical devices market was split into various segments and subsegments:

  • List of major players operating in the products market at the regional and/or country level
  • Product mapping of various top 10 medical device manufacturers at the regional and/or country level
  • Mapping of annual revenue generated by listed major players from the top 10 medical devices market (or the nearest reported business unit/product category)
  • Extrapolation of the revenue mapping of the listed major players to derive the global market value of the respective segments/subsegments
  • Summation of the market value of all segments/subsegments to arrive at the global top 10 medical devices market

Top 10 Medical Devices Market : Top-Down and Bottom-Up Approach

Top 10 Medical Devices Market Top Down and Bottom Up Approach

Data Triangulation

After determining the overall size of the global top 10 medical devices market using the methodology described above, the market was segmented into several segments and subsegments. The data triangulation and market breakdown procedures were employed, as applicable, to complete the overall market engineering process and obtain exact market value data for the key segments and subsegments. The extrapolated market data was triangulated by studying various macroindicators and regional trends from both demand- and supply-side participants.

Market Definition

The top 10 medical devices market comprises high-demand diagnostic and therapeutic device categories, including in vitro diagnostics, cardiovascular, imaging, orthopedic, ophthalmic, endoscopy, diabetes care, wound care, renal/dialysis, and respiratory care devices. These technologies support disease diagnosis, monitoring, treatment, and patient management across hospitals, diagnostic laboratories, ambulatory care centers, specialty clinics, and home healthcare settings.

Key Stakeholders

  • Medical device manufacturing companies
  • Component suppliers, raw material providers, and contract manufacturers
  • Distributors, dealers, and commercial service providers
  • Healthcare service providers
  • Hospitals, clinics, and integrated healthcare systems
  • Ambulatory surgery centers (ASCs) and specialty care centers
  • Diagnostic laboratories and imaging centers
  • Academic medical centers and universities
  • Contract research organizations (CROs) and clinical research organizations
  • Medical research laboratories and research institutes
  • Government agencies and regulatory authorities
  • Reimbursement agencies and insurance providers
  • Group purchasing organizations (GPOs) and healthcare procurement organizations
  • Digital health, AI, and medical software solution providers
  • Home healthcare providers and remote patient monitoring service providers
  • Dialysis centers, cardiac care centers, ophthalmology centers, and diabetes care centers
  • Market research and consulting firms
  • Investors, venture capital firms, and healthcare funding organizations
  • Professional medical associations and surgical training centers

Report Objectives

  • To define, describe, segment, and forecast the top 10 medical devices market by type and region
  • To provide detailed information about the factors influencing market growth (such as drivers, restraints, opportunities, and challenges)
  • To analyze micromarkets with respect to individual growth trends, prospects, and contributions to the overall top 10 medical devices market
  • To analyze market opportunities for stakeholders and provide details of the competitive landscape for key players
  • To forecast the size of the top 10 medical devices market in five main regions (along with their respective key countries): North America, Europe, the Asia Pacific, Latin America, and the Middle East & Africa
  • To profile the key players in the top 10 medical devices market and comprehensively analyze their core competencies and market shares
  • To track and analyze competitive developments such as acquisitions, product launches, expansions, collaborations, agreements, partnerships, and R&D activities of the leading players in the top 10 medical devices market
  • To benchmark players within the top 10 medical devices market using the Company Evaluation Matrix framework, which analyzes market players on various parameters within the broad categories of business strategy, market share, and product offerings

Available customizations:

Based on the given market data, MarketsandMarkets offers customizations tailored to your company’s specific needs. The following customization options are available for the report:

Regional Analysis

  • Further breakdown of the Rest of Europe top 10 medical devices market into Russia, Switzerland, Denmark, Austria, and others
  • Further breakdown of the Rest of Asia Pacific top 10 medical devices market into South Korea, Taiwan, and others
  • Further breakdown of the Rest of Latin America top 10 medical devices market into Argentina, Colombia, Chile, Ecuador, and others
  • Further breakdown of the Southeast Asia top 10 medical devices market into Malaysia, Singapore, Australia, New Zealand, and others
 

Key Questions Addressed by the Report

What is the projected growth outlook for the global top 10 medical devices market through 2031?

The global top 10 medical devices market is projected to grow from USD 637.42 billion in 2026 to USD 829.69 billion by 2031, registering a CAGR of 5.4% during the forecast period. The market was valued at USD 603.50 billion in 2025, highlighting continued demand for advanced medical device technologies across healthcare systems.

Which medical device segment accounted for the largest market share in 2025?

The in vitro diagnostic devices segment accounted for the largest share of the global top 10 medical devices market, capturing 18.5% of the market in 2025. Increasing adoption of diagnostic technologies for disease detection and monitoring is contributing to the segment’s leading position.

Which region dominated the global top 10 medical devices market in 2025?

North America accounted for the largest share of the global top 10 medical devices market, holding 38.5% of the market in 2025. The region’s strong presence in medical device innovation and adoption contributed to its leading market position.

What are the key medical device categories covered in the top 10 medical devices market?

The top 10 medical devices market covers major categories including in vitro diagnostic devices, cardiovascular devices, imaging devices, ophthalmology devices, endoscopy devices, orthopedic devices, diabetes care devices, wound care devices, kidney and dialysis devices, and respiratory care devices.

Which companies are recognized as leading players in the global top 10 medical devices market?

Key players profiled in the top 10 medical devices market include Medtronic, Johnson & Johnson, B. Braun SE, Stryker Corporation, Smith+Nephew, Boston Scientific, Olympus Corporation, Koninklijke Philips N.V., GE Healthcare, Abbott, and Zimmer Biomet.

Which companies are identified as star players in the top 10 medical devices market?

Johnson & Johnson (US) and Medtronic (Ireland) were recognized as star players in the top 10 medical devices market due to their established strong product portfolios and geographic presence.

Which emerging companies are gaining traction in the top 10 medical devices market?

Canon Medical Systems Corporation (Japan), iVascular (Spain), and Lifetech Scientific Corporation (China) have established themselves among startups and SMEs in the top 10 medical devices market, supported by strong product portfolios and effective business strategies.

What factors are expected to support growth opportunities in the top 10 medical devices market?

Growth opportunities in the top 10 medical devices market are supported by increasing adoption of advanced medical technologies across key categories such as diagnostic devices, cardiovascular devices, imaging systems, and other specialized medical equipment. Companies are focusing on strong product portfolios and geographic expansion strategies to strengthen their market presence.

Personalize This Research

  • Triangulate with your Own Data
  • Get Data as per your Format and Definition
  • Gain a Deeper Dive on a Specific Application, Geography, Customer or Competitor
  • Any level of Personalization
Request A Free Customisation

Let Us Help You

  • What are the Known and Unknown Adjacencies Impacting the Top 10 Medical Devices Market

  • What will your New Revenue Sources be?
  • Who will be your Top Customer; what will make them switch?
  • Defend your Market Share or Win Competitors
  • Get a Scorecard for Target Partners
Customized Workshop Request

Custom Market Research Services

We Will Customise The Research For You, In Case The Report Listed Above Does Not Meet With Your Requirements

Get 10% Free Customisation

TESTIMONIALS

Growth opportunities and latent adjacency in Top 10 Medical Devices Market

avtar

Natalia

Jun, 2022

TahatAksi is also a manufacturer and supplier of medical equipment. Is the company profiled in your study?.

DMCA.com Protection Status
popup img