
Armor Materials Market

Armor Materials Market by Type (Metals & Alloys, Composites, Ceramics), Application (Vehicle Armor, Aerospace Armor, Body Armor), and Region - Global Forecast to 2030


OVERVIEW
Source: Secondary Research, Interviews with Experts, MarketsandMarkets Analysis
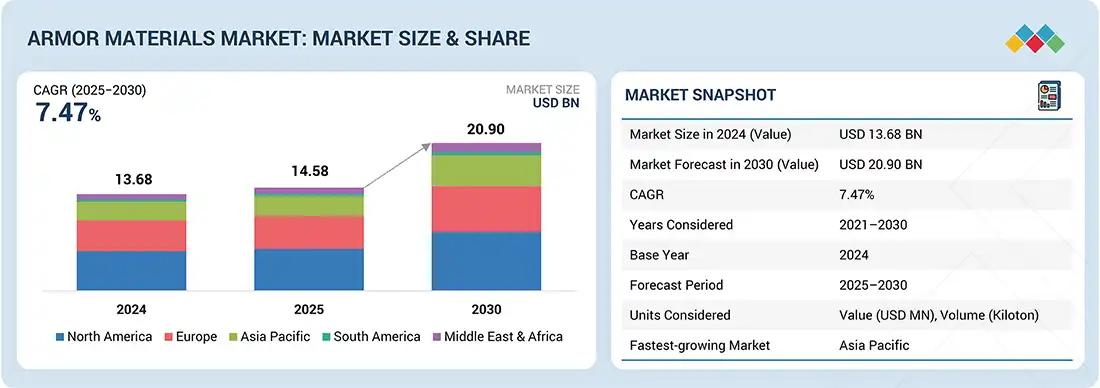
The armor materials market is projected to reach USD 20.90 billion by 2030 from USD 14.58 billion in 2025, at a CAGR of 7.47% from 2025 to 2030. Armor materials can resist penetration or damage from bullets, bombs, mines, and other ballistic or explosive threats. These materials typically have high strength, durability, and toughness, as well as special properties such as hardness, resilience, and deformation resistance. Armor is a layer or combination of protective layers on military and civilian assets, such as vehicles, individuals, building components, and other objects, to protect these from damage inflicted by weapons in a hostile environment and war situations. Armor is made of different materials, such as metals & alloys, ceramics, composites, para-aramid fiber, ultra-high-molecular-weight polyethylene (UHMWPE), and fiberglass. The global armor materials market is growing due to increasing defense modernization programs and rising demand for lightweight, high-performance protective solutions across military, aerospace, and law enforcement applications.
KEY TAKEAWAYS
-
BY MATERIAL TYPEThe para-aramid fiber segment is witnessing the fastest growth of 8.88%, driven by its exceptional strength-to-weight ratio, superior ballistic resistance, and thermal stability. These attributes make it increasingly preferred in body armor, helmets, and vehicle protection for enhanced soldier safety.
-
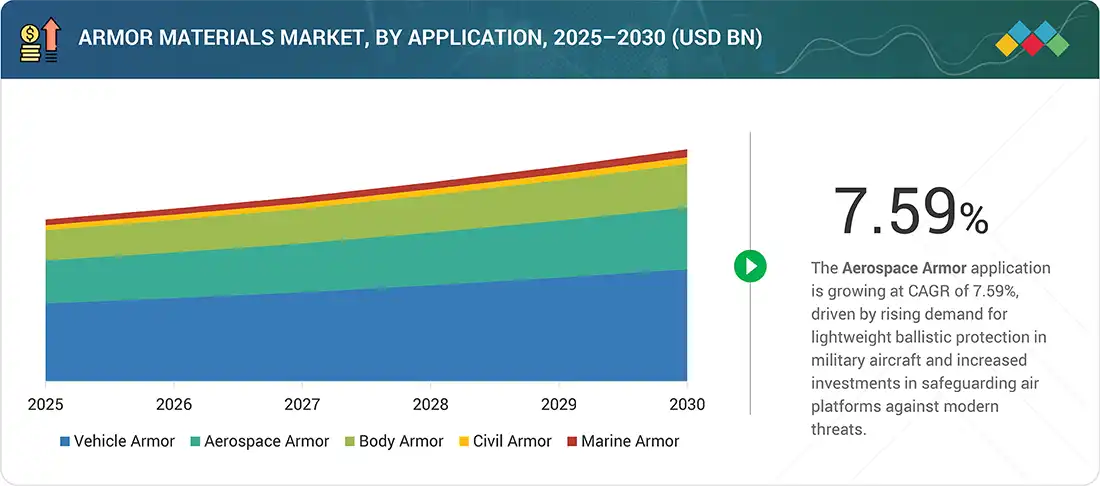
BY APPLICATIONThe aerospace armor segment is expanding at the fastest pace of 7.59%, fueled by the increasing demand for lightweight ballistic protection in military aircraft and rising investments in advanced materials to enhance the survivability and fuel efficiency of air platforms.
-
BY REGIONThe Asia Pacific region is growing at the highest pace of 8.90%, supported by rising defense budgets, rapid military modernization, and increasing adoption of advanced armor solutions to address evolving security challenges across emerging economies in the region.
-
COMPETITIVE LANDSCAPEThe major market players have adopted both organic and inorganic strategies, including expansions, acquisitions, and investments. For instance, Avient Corporation completed its acquisition of Royal DSM N.V.’s protective materials business, including the Dyneema brand. This acquisition is expected to significantly strengthen its portfolio of high-performance UHMWPE solutions for armor applications.
The market for armor materials is projected to grow significantly from 2025 to 2030. The primary driver behind this upward trend is the need to enhance the survivability of personnel and vehicles in the armed forces. While traditional steel armor is effective, it also adds considerable weight, which can impact fuel efficiency, payload capacity, and mobility. In contrast, advanced armor materials provide a superior combination of protection and performance while being lighter in weight. These materials are utilized in modular armor packages, spall liners, and structural components. They enhance the safety of the operating environment by offering multi-hit resistance and mitigating the effects of explosions.
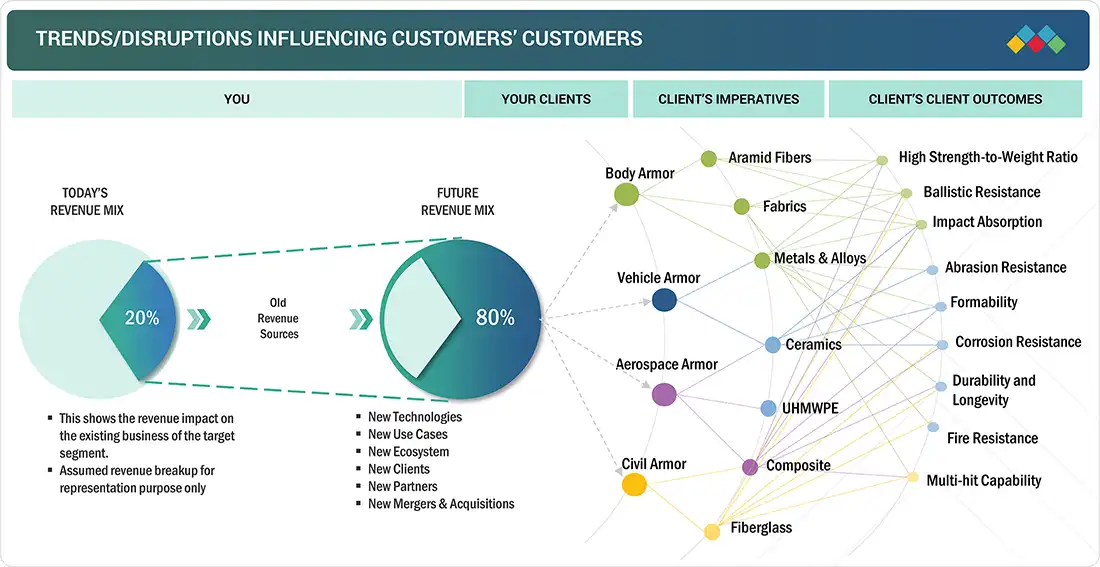
TRENDS & DISRUPTIONS IMPACTING CUSTOMERS' CUSTOMERS
The market ecosystem for armor materials is changing with the growing need for lightweight composites and ceramics in automotive and aerospace armor to strike a balance between protection and mobility. Para-aramid fibers and UHMWPE are being used in body armor to improve comfort and durability, and multipurpose solutions are being used in marine and civil applications to combat blast and ballistic threats. In response to these disruptions, end users are becoming more efficient and resilient in dynamic threat environments.
Source: Secondary Research, Interviews with Experts, MarketsandMarkets Analysis
MARKET DYNAMICS
Level
-
Increasing security concerns in developing countries

-
Growing demand for homeland security

Level
-
Government-led regulations regarding production capacity and supply chain

-
Inability to provide complete protection

Level
-
Military modernization programs

-
Need for lightweight armor

Level
-
Development of explosive reactive armor systems

-
High cost for lightweight armor materials

Source: Secondary Research, Interviews with Experts, MarketsandMarkets Analysis
Driver: Increasing security concerns in developing countries
An elevated level of threats to the developing countries, increased defense expenditure, and a trend in the use of lighter and more agile combat platforms are all contributing to a revolution in the defense industry. As the environment continues to evolve, sophisticated armor materials are becoming the preferred choice for protection. It is worth the investment for nations to attain strategic superiority and cost efficiencies over the platform's lifecycle due to their superior strength-to-weight ratio and ability to be integrated into complex systems. Advanced armor is an ideal choice for the development of next-generation combat vehicles, aircraft, naval vessels, and body armor, as it does not necessitate the same bulk as steel to provide equivalent protection. As battlefield threats become more complex, the need for armor that can withstand multiple hits and remain durable is increasing.
Restraint: Government-led regulations regarding production capacity and supply chain
The global armor materials market is considered sensitive because of its potential impact on a nation's security system. Therefore, to strengthen and protect the supply chain for armor protection systems, government agencies regulate the production and use of armor materials. These regulations cover the safety of production technology, the import of armor materials from other countries, the sale of armor materials to foreign entities or governments, and production levels.
Opportunity: Military modernization programs
Advancements in warfare tactics and increasing cost-awareness in the defense industry have prompted various countries to reorganize their armed forces and develop efficient, deployable, and powerful military forces. These changes have led to increased investment in advanced defense equipment that delivers better performance, easier operation, and lower maintenance costs. Such demands have also driven military modernization programs, resulting in upgraded armor systems. These changes are compelling governments to adopt the best soldier modernization strategies for their countries.
Challenge: High cost for lightweight armor materials
The process of manufacturing armor materials is highly dependent on the intended use of these materials. The technology used in making these materials is an essential part of the value chain. Production is overseen by various agencies and military forces due to market sensitivity. These agencies have implemented numerous measures to ensure the confidentiality and security of the technology used during production. The process must also pass through a series of control procedures to maintain security. These factors drive up the production costs of armor materials. Additionally, the overall costs increase because manufacturers invest heavily in research and development to enhance the effectiveness of armor.
Armor Materials Market: COMMERCIAL USE CASES ACROSS INDUSTRIES
| COMPANY | USE CASE DESCRIPTION | BENEFITS |
|---|---|---|
 |
Integration of advanced ceramics and composites in armored vehicles and naval vessels | Provides lightweight yet high-strength protection, improving mobility and survivability in combat zones |
 |
Supplies Kevlar aramid fibers for body armor, helmets, and vehicle armor | Delivers superior ballistic resistance with reduced weight, enhancing soldier protection and comfort |
 |
Manufactures bulletproof vests, helmets, and vehicle armor systems using UHMWPE and ceramics | Offers cost-effective and modular protection solutions, widely adopted by military and law enforcement |
 |
Uses composite armor materials in military aircraft and land systems | Enhances aircraft survivability against ballistic threats while maintaining fuel efficiency through weight reduction |
 |
Develops soft and hard body armor for police and defense personnel | Ensures high protection levels with ergonomic designs, improving mobility and comfort during field operations |
Logos and trademarks shown above are the property of their respective owners. Their use here is for informational and illustrative purposes only.
MARKET ECOSYSTEM
The armor materials market ecosystem consists of various interconnected stakeholders, including raw material suppliers, manufacturers, distributors, and end users. Raw material suppliers provide the essential materials needed by armor materials manufacturers. These manufacturers utilize advanced technologies to produce armor materials. Meanwhile, distributors play a crucial role by connecting manufacturing companies with end users. They focus on enhancing the supply chain, which in turn increases operational efficiency and profitability.
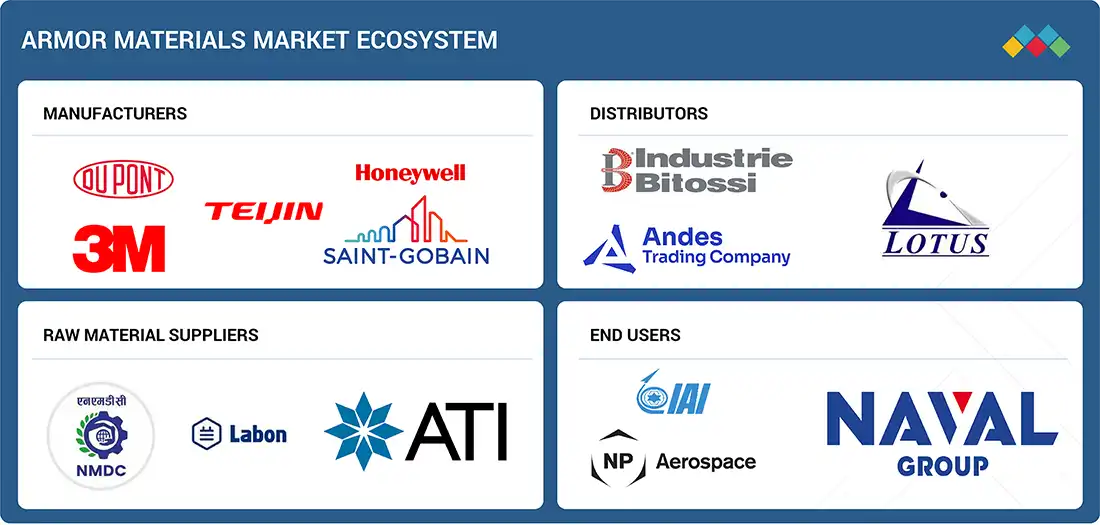
Logos and trademarks shown above are the property of their respective owners. Their use here is for informational and illustrative purposes only.
MARKET SEGMENTS
Source: Secondary Research, Interviews with Experts, MarketsandMarkets Analysis
Armor Materials Market, by Application
The aerospace armor segment held the second-largest share of the armor materials market and its relative size is expected to increase in response to the ongoing global demand for aircraft protection from combat threats. The system necessitates lightweight yet durable solutions that can withstand ballistic impacts without compromising flight characteristics. Advanced armor materials provide superior protection at a fraction of the weight of steel. Furthermore, they can be designed with specialized composite or ceramic facings for better performance against specific threats.
Armor Materials Market, by Material Type
The composites segment accounted for the second-largest share of the armor materials market. The dominance is attributed to its overall combination of high strength and low weight. Composite materials have significant applications across various defense platforms. Since armor systems with composite materials do not carry the same weight penalty, this operational process has advantages in platform mobility, fuel efficiency, and payload capacity in vehicles, aircraft, and personal protection. In addition, they can be molded into complex shapes, allowing for optimized designs that would be impossible with traditional metals.
REGION
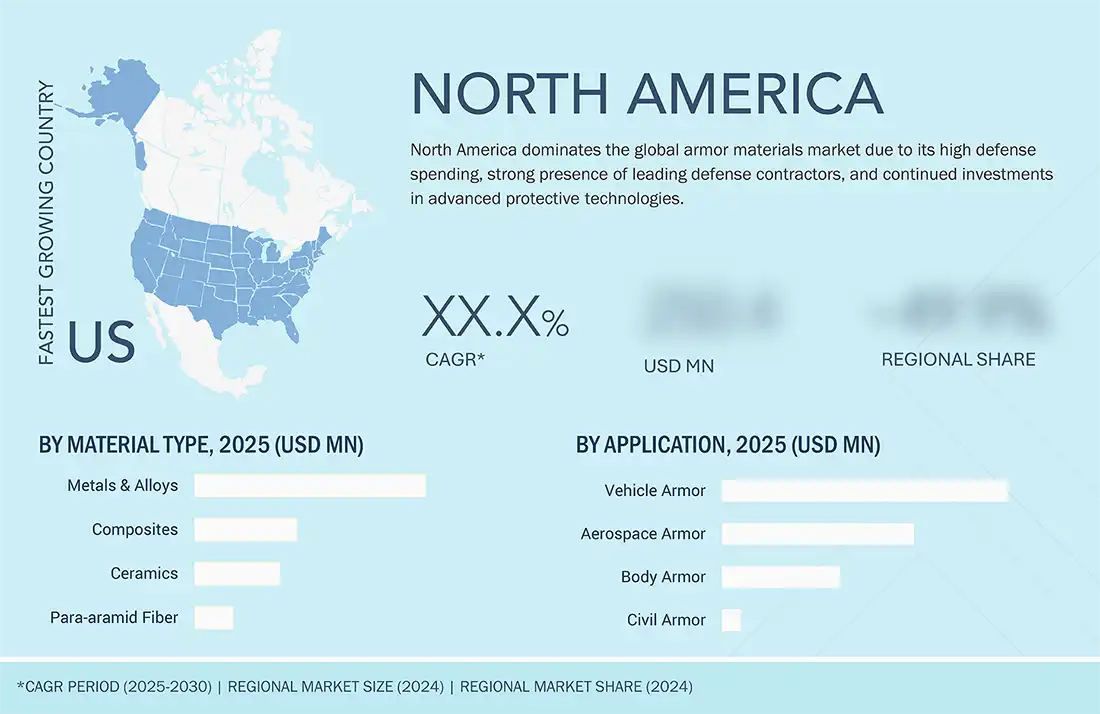
North America is projected to hold the largest share of the market, while the Asia Pacific will register fastest growth in global armor materials market during forecast period
North America holds the largest share of the global armor materials market, a position bolstered by significant defense investments, advanced military infrastructure, and a high adoption rate of armored vehicles and protective systems in the region. Strong government spending on defense modernization, along with technological innovations in body armor, vehicle armor, and aerospace armor, reinforces North America's dominant market position and growth trajectory. In contrast, the Asia Pacific region is the fastest-growing region in the global armor materials market. Rising defense budgets and geopolitical tensions are key factors driving the armor materials market in this region, with countries such as China, India, and South Korea actively pursuing major military modernization efforts.
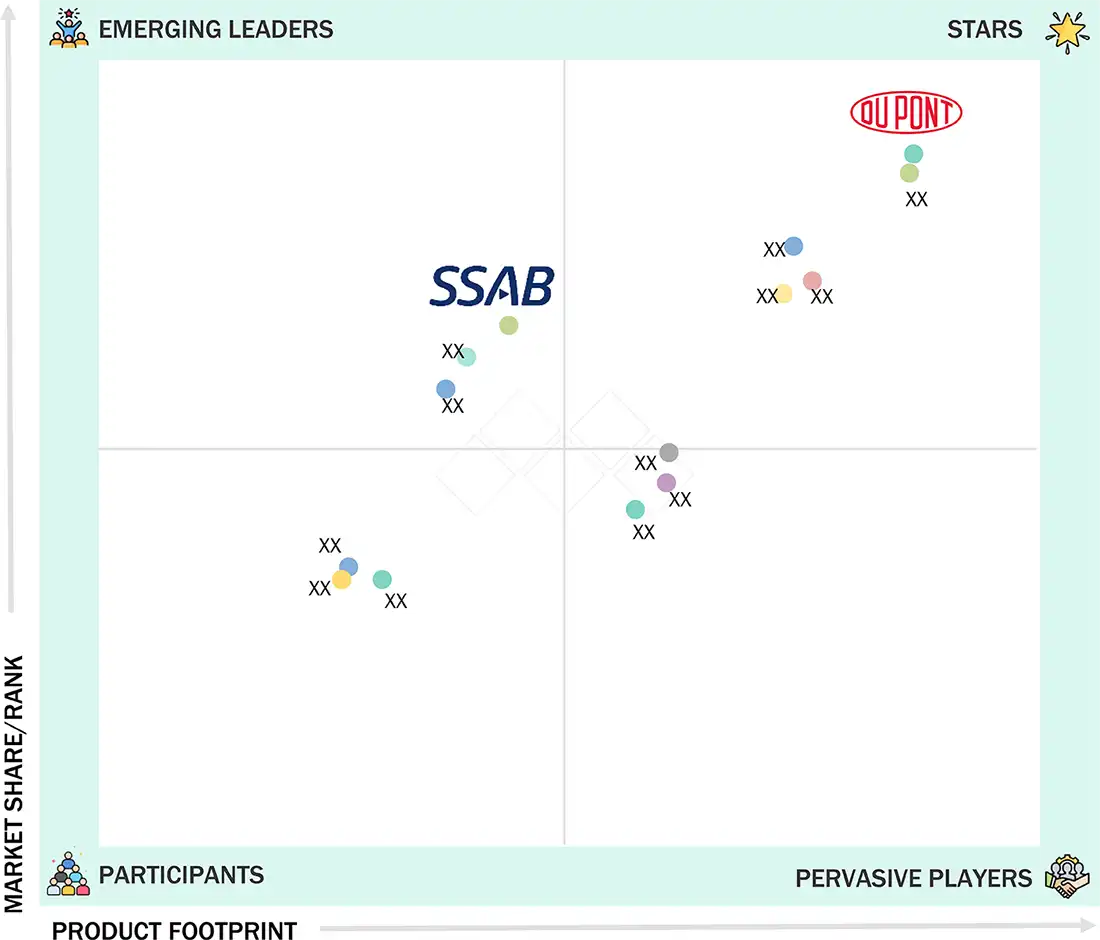
Armor Materials Market: COMPANY EVALUATION MATRIX
In the armor materials market, DuPont de Nemours, Inc. (Star) leads with a strong market presence and a diverse portfolio of armor materials suitable for various applications. This positions the company as a driving force behind large-scale adoption across the industry. SSAB AB (Emerging Leader) is making significant strides with its advanced high-strength steel solutions. While DuPont retains dominance due to its scale, SSAB is increasingly gaining traction in the defense, aerospace, and vehicle armor segments.
Source: Secondary Research, Interviews with Experts, MarketsandMarkets Analysis
KEY MARKET PLAYERS
MARKET SCOPE
| REPORT METRIC | DETAILS |
|---|---|
| Market Size in 2024 (Value) | USD 13.68 BN |
| Market Forecast in 2030 (Value) | USD 20.90 BN |
| Growth Rate | CAGR of 7.47% from 2025-2030 |
| Years Considered | 2021−2030 |
| Base Year | 2024 |
| Forecast Period | 2025−2030 |
| Units Considered | Value (USD Million), Volume (Kiloton) |
| Report Coverage | Revenue forecast, company ranking, competitive landscape, growth factors, and trends |
| Segments Covered | • By Material Type: Metals & Alloys, Ceramics, Composites, Para-aramid Fiber, UHMWPE, Fiberglass, and Other Material Types • By Application: Vehicle Armor, Aerospace Armor, Body Armor, Civil Armor, and Marine Armor |
| Regionals Covered | North America, Europe, Asia Pacific, Middle East & Africa, and South America |
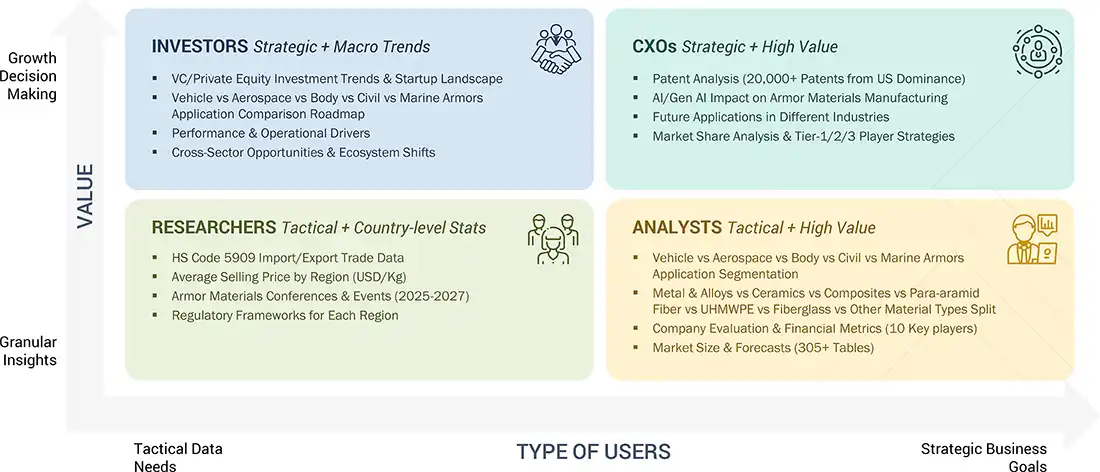
WHAT IS IN IT FOR YOU: Armor Materials Market REPORT CONTENT GUIDE
DELIVERED CUSTOMIZATIONS
We have successfully delivered the following deep-dive customizations:
| CLIENT REQUEST | CUSTOMIZATION DELIVERED | VALUE ADDS |
|---|---|---|
| Europe-based Armor Materials Manufacturer | • Detailed Europe-based company profiles of competitors (financials, product portfolio) • Customer landscape mapping by end-use sector • Partnership ecosystem analysis | • Identify interconnections and supply chain blind spots • Detect customer migration trends across industries • Highlight untapped customer clusters for market entry |
| US-based Armor Materials Manufacturer | • Global & regional production capacity benchmarking • Customer base profiling across applications | • Strengthen forward integration strategy • Identify high-demand customers for long-term supply contracts • Assess supply-demand gaps for competitive advantage |
RECENT DEVELOPMENTS
- September 2022 : Avient Corporation completed its acquisition of Royal DSM N.V.’s Protective Materials business, including the Dyneema brand. This acquisition is expected to significantly strengthen its portfolio of high-performance UHMWPE solutions for armor applications.
- July 2022 : ATI, Inc. announced it reached a new multi-year agreement with GKN Aerospace to supply high-value titanium materials used to manufacture commercial and military airframes, reinforcing its position in the aerospace and defense supply chain.
- March 2022 : DuPont de Nemours, Inc. announced the launch of Nomex Xtreme Performance, a new category of thermal and multi-threat protection solutions for emergency responders, including next-generation firefighting PPE.
- October 2021 : Honeywell launched Gold Shield MT, a high-performing ballistic composite material designed to provide advanced protection from multi-threats, such as blades and spikes, in addition to ballistic capabilities for law enforcement vests.
Table of Contents
 Exclusive indicates content/data unique to MarketsandMarkets and not available with any competitors.
Methodology
The study involved four main activities in estimating the armor materials market size. Extensive secondary research was conducted to gather information on the market, its peer markets, and its parent market. The next step was to validate these findings, assumptions, and size estimates with industry experts across the value chain through primary research. Both top-down and bottom-up approaches were used to calculate the complete market size. Then, market breakdown and data triangulation procedures were employed to estimate the sizes of segments and subsegments.
Secondary Research
Secondary sources used in this study included annual reports, press releases, and investor presentations from companies; white papers; certified publications; articles by recognized authors; and reputable websites such as Factiva, ICIS, Bloomberg, and others. The study’s findings were verified through primary research by conducting extensive interviews with key officials like CEOs, VPs, directors, and other executives.
Primary Research
The armor materials market includes stakeholders such as raw material suppliers, end-product manufacturers, and regulatory organizations involved in the supply chain. The demand side of this market is driven by key opinion leaders across various applications for armor materials. The supply side is influenced by technological advancements and diverse application industries. Interviews with primary sources from both the supply and demand sides of the market provided qualitative and quantitative information.
The breakdown of profiles of the primary interviewees is illustrated in the figure below:

Note: Tier 1, Tier 2, and Tier 3 companies are classified based on their market revenue in 2023/2024, available in the public domain, product portfolios, and geographical presence.
Other designations include consultants and sales, marketing, and procurement managers.
To know about the assumptions considered for the study, download the pdf brochure
| COMPANY NAME | DESIGNATION | |
|---|---|---|
| 3M Company | Senior Manager | |
| DuPont de Nemours, Inc. | Innovation Manager | |
| Teijin Limited | Vice President | |
| Saint-Gobain S.A. | Production Supervisor | |
| Honeywell International Inc. | Sales Manager | |
Market Size Estimation
Both top-down and bottom-up approaches were used to estimate and validate the total size of the armor materials market. These methods were also used extensively to estimate the size of various subsegments within the market. The research methodology used to estimate the market size includes the following:
- The key players in the industry have been identified through extensive secondary research.
- The industry’s supply chain has been mapped through both primary and secondary research.
- All percentage shares, splits, and breakdowns have been calculated using secondary sources and verified with primary sources.
- All relevant parameters affecting the markets covered in this research have been thoroughly examined, verified through primary research, and analyzed to produce the final quantitative and qualitative data.

Data Triangulation
After determining the overall market size—using the market size estimation processes described above—the market was divided into several segments and subsegments. Data triangulation and market breakdown methods were used as needed to complete the entire market analysis and obtain precise data for each segment and subsegment. The data was triangulated by examining various factors and trends from both the demand and supply sides in the armor materials industry.
Market Definition
According to the book titled “Introduction to Armor Materials” by Gopalakrishnan Shankaranarayanan, “armor materials are those materials that can resist penetration or damage from bullets, bombs, mines, and other ballistic or explosive threats. These materials typically have high strength, durability, and toughness, as well as special properties such as hardness, resilience, and deformation resistance. Armor is a layer or combination of protective layers on military and civilian assets, such as vehicles, individuals, building components, and other objects, to protect them from damage inflicted by weapons in hostile environments and war situations. Armor is made of different materials, such as metals & alloys, ceramics, composites, para-aramid fiber, ultra-high-molecular-weight polyethylene (UHMWPE), and fiberglass. Different materials have different properties, and parameters such as weight, flexibility, ballistic protection, machinability, fire resistance, and cost are considered when specifying armor against potential threats.
Stakeholders
- Manufacturers, dealers, and suppliers of armor materials and their raw materials
- Manufacturers across various end-use industries such as consumer electronics, automotive, electrical systems/wire harnessing, industrial distribution, flexo printing & paper, medical & hygiene, packaging, and other sectors
- Traders, distributors, and suppliers of armor materials
- Regional manufacturers’ associations and armor material associations
- Government agencies, regional agencies, and research organizations
Report Objectives
- To analyze and forecast the armor materials market in terms of value and volume
- To provide detailed information about the key factors (drivers, restraints, opportunities, and challenges) influencing market growth
- To define, segment, and project the size of the global armor materials market based on type, application, and region
- To project the market size for five main regions: North America, Europe, Asia Pacific, the Middle East & Africa, and South America, with their key countries
- To analyze the micromarkets1 concerning individual growth trends, prospects, and their contribution to the overall market
- To analyze opportunities in the market for stakeholders and provide a competitive landscape of the market leaders
- To track and analyze R&D and competitive developments such as expansions, product launches, collaborations, investments, partnerships, agreements, developments, collaborations, and mergers & acquisitions in the armor materials market
Key Questions Addressed by the Report
Who are the major players in the armor materials market?
The major players in the armor materials market include DuPont de Nemours, Inc. (US), Teijin Limited (Japan), Honeywell International Inc. (US), 3M Company (US), Saint-Gobain S.A. (France), ATI, Inc. (US), Avient Corporation (US), Alcoa Corporation (US), SSAB AB (Sweden), and Morgan Advanced Materials (UK).
What are the drivers and opportunities for the armor materials market?
Rising geopolitical tensions, increasing defense budgets, and growing demand for lightweight protection are driving the market, while the development of next-generation materials such as smart armor and technological advancements in manufacturing are creating new opportunities.
Which strategies are the key players focusing on in the armor materials market?
Key players are focusing on product launches, mergers and acquisitions, agreements, and expansions to strengthen their global presence and enhance their product portfolios.
What is the expected growth rate of the armor materials market between 2025 and 2030?
The armor materials market is projected to grow at a CAGR of 7.47% in terms of value during the forecast period.
Which major factors are expected to restrain the growth of the armor materials market during the forecast period?
Volatile raw material prices and the high cost of developing and certifying advanced materials are expected to restrain market growth during the forecast period.
Need a Tailored Report?
Customize this report to your needs
Get 10% FREE Customization
Customize This ReportPersonalize This Research
- Triangulate with your Own Data
- Get Data as per your Format and Definition
- Gain a Deeper Dive on a Specific Application, Geography, Customer or Competitor
- Any level of Personalization
Let Us Help You
- What are the Known and Unknown Adjacencies Impacting the Armor Materials Market
- What will your New Revenue Sources be?
- Who will be your Top Customer; what will make them switch?
- Defend your Market Share or Win Competitors
- Get a Scorecard for Target Partners

Custom Market Research Services
We Will Customise The Research For You, In Case The Report Listed Above Does Not Meet With Your Requirements
Get 10% Free CustomisationTESTIMONIALS

We at Nissan Chemicals Corporation have been clients of MarketsandMarkets for more than a year now. We recently consulted MarketsandMarkets for a study, the team at MarketsandMarkets was extremely professional and organized. The business insights were very detailed and aligned well with our expectations that really helped us formulate the Business Plans and device new strategies for development themes. MarketsandMarkets offers a unique combination of expertise and dedicated engagement model. Their research findings have helped us in designing our Pricing Strategy which will make it easier for us to predict the future sales and profits for the next ten years. We look forward to working with MarketsandMarkets in the future.
VP of Strategy & New Business Development
Leading Specialty Chemical Company
The MarketsandMarkets Engagement Model, composed of both the Knowledge Store and advisory custom research, has greatly helped us in understanding our markets and making strategic decisions. The Knowledge Store is a fast way to allow everyone in our organization to understand more about most any market they are interested in. The ability to then get custom research done and get answers to specific strategic questions and market insight has been spectacular. The Markets and Markets team feel more like colleagues than vendors and their services have helped us change our culture where statements of things like growth opportunities and competitive position are always backed by industry research.

Rich Gibson,
Director, Corporate Strategy
Milliken & Company,
Leading Industrial Manufacturer of specialty chemical, floor covering, performance and protective textile materials, and healthcaremilliken.com
MarketsandMarkets is a trusted resource that helps us to better understand markets that are near-adjacencies-whether its technology, value chain or geography. Their Knowledge Store platform provides a dashboard of markets and their characteristics which is easy to use and saves us time.
Adam Shaw,
Market Development and Strategy Manager
AdvanSix Inc. USA,
An American Leader in Chemicalswww.advansix.com
The Knowledge Store from MarketsandMarkets is a valuable tool which has helped my team acquire greater insight in to the end markets that our business serves. This has enabled us to help our company build stronger strategies throughout our planning process.
TOSHIO KINOSHITA
Senior Chif Consultion Research & Consulting Division
Mitsubishi Chemical Research Corporation,
Leading Manufacturer of Chemical Productswww.mitsubishichem-res.co.jp/en/

We recently engaged with MarketsandMarkets for a study, the team not only clearly understood our business objectives but was also extremely professional in the way they handled the entire project. The study was efficiently conducted in a phase-wise manner, and the engagement model furnished us with high-quality business insights that far exceeded our expectations at each phase. We were especially happy that MarketsandMarkets could provide us with both, an English as well as a Japanese version of the study. A special thanks to the Analyst Team and Client Services Team, whose fluency in Japanese enhanced our comfort level, as we could converse with them in our preferred language.
Independent entrepreneurs
Arrow Precision
We approached MarketsandMarkets for study on Proppants Market, and their work exceeded our expectations. The study conducted was comprehensive and enabled us to view the market through the various dimensions. In addition, the team was extraordinarily responsive throughout the process and resolved our queries on time. I strongly recommend MarketsandMarkets and will certainly consider them for additional market assessments we will need in the future.
Global engineering company, Japan
Deputy Manager,
Strategic Planning OfficeThe high-quality insights shared by the MarketsandMarkets team helped us understand the pharmaceutical plant designers in a specific geography. It also captured the risks that we may likely face in communicating with our potential partners. The study would enable us identify partners, which would impact our future growth.
Growth opportunities and latent adjacency in Armor Materials Market


sylvain
Apr, 2016
Information on volumes forecasts (surface) for UHMWPE composite armor / spilt per regions..
Mauricio
Dec, 2018
Sample required.
Paul
Jun, 2019
Specific information required on materials used in vehicle armours for defense application.
Neil
Dec, 2017
Manufacturers of Armoured vehiocles.
Sophie
Jun, 2019
Understand market potential for bulletproof steel and other bulletproof products for human, vehicle, ships and building safety.