Automotive Smart Antenna Market

Automotive Smart Antenna Market by Frequency (High, Very High, & Ultra High), Type (Shark-Fin & Fixed Mast), Component (Transceivers, ECU), Vehicle Type (Passenger Cars, LCV, & HCV), EV (BEV, FCEV, & PHEV) and Region - Global Forecast to 2030

Report Code: AT 6721 Jan, 2024, by marketsandmarkets.com

[257 Pages Report] The Automotive Smart Antenna Market is projected to grow from USD 2.5 Billion in 2023 to USD 5.2 Billion by 2030, at a CAGR of 10.9%. The key factors driving the automotive smart antenna market are the increase in sales of mid- & premium segment cars EVs and SUV sales. Growing cellular applications for connected vehicles, rising demand for safety features, growing use of Electrical/Electronic (E/E) architecture, and increasing EV sales are driving the automotive smart antenna market.

Automotive Smart Antenna Market

To know about the assumptions considered for the study, Request for Free Sample Report

Automotive Smart Antenna Market

To know about the assumptions considered for the study, download the pdf brochure

Market Dynamics

DRIVER: Growing cellular applications for connected vehicles

The data rate cost regarding spectrum usage has been reduced with successive generations of mobile networks. There have been various advancements in wireless networks in recent years. Each generation of the cellular network is faster, more secure, and more reliable than the previous one. However, the rise of 5G connectivity has been a key driver, with smart antennas optimized for 5G networks to provide high-speed, low-latency communication. Utilizing advanced technologies such as beamforming and MIMO, smart antennas improve signal quality, ensuring reliable connectivity in various environments.

Current 4G networks do not have the capacity or speed to enable a truly connected experience and deliver safe and reliable services. However, 5G technology has boosted OEMs by testing many non-safety V2X applications, such as weather, road conditions, and traffic data between vehicles. The enhanced safety features, including advanced driver assistance systems (ADAS) and vehicle-to-everything (V2X) communication, benefit from the improved reliability and speed of data transfer facilitated by smart antennas. Additionally, these antennas enable over-the-air (OTA) updates, allowing manufacturers to enhance vehicle functionality and security remotely. The growing consumer demand for vehicle connectivity features and regulatory requirements promoting intelligent transportation systems further contribute to the increasing adoption of smart antennas in the automotive sector.

Key automotive sector players invest heavily in 5G infrastructure to increase connectivity and data transfer rates. For instance, China Mobile (China) has invested USD 36 billion in 5G infrastructure. The company has focused on covering over 800 cities within China, highlighting widespread connectivity and digitalization. In July 2023, American Tower invested USD 1 billion in fiber optic network expansion to support 5G deployments, which will have a faster speed with lower latency. In February 2021, Verizon (US) was the top bidder worth USD 45 billion investment in 5G spectrum and network deployment for the future of connectivity and connected vehicles in the US.

The substantial investments by key players in developing 5G infrastructures further amplify the potential for groundbreaking innovations in connectivity to enhance the connected automotive vehicle driving experience. This will drive the adoption of automotive smart antennas in the cellular application segment.

RESTRAINT: Lack of communication infrastructure in emerging economies

An The expansion of the automotive smart antenna market is significantly hindered in emerging economies due to inadequate communication infrastructure. The deficient condition of communication infrastructure in countries like Sub-Saharan Africa (Ethiopia and Keney) and Central Asia (Turkmenistan and Tajikistan) substantially restrain the widespread integration of automotive smart antennas. The limitations in 4G or 5G networks severely impede the smart antenna's capability to deliver high-speed and low-latency communication, essential for applications like autonomous driving and V2X communication. Hence, remote and rural areas with connectivity gaps hinder the seamless operation of smart antennas and limit their potential benefits in terms of enhanced safety features and improved traffic management.

Furthermore, over-the-air (OTA) updates, essential for improving performance and ensuring security, have become challenging in countries with inadequate communication infrastructure. Smart antennas may struggle to receive timely updates, impacting their functionality and potentially leaving vehicles with outdated software and firmware. The security and reliability concerns related to data transmission are heightened in countries with inadequate or unreliable communication networks. The lack of a robust infrastructure exacerbates these issues, creating barriers to realizing the full advantages of smart antennas in connected vehicular systems. The ongoing initiatives and collaborations between governments, international entities, and industry stakeholders to address these infrastructure gaps indicate a recognized need for targeted investments. Despite positive strides, the current communication infrastructure in emerging economies remains a formidable restraining factor, necessitating sustained efforts to bridge the digital divide and fully unlock the potential of smart antennas in these economies. For instance, in Lagos (Nigeria), smartphone penetration is lower than in developed countries. This limits the potential customer base for smart antenna-equipped vehicles, making manufacturers hesitant to invest heavily in these technologies for such markets.

Hence, the restrained growth of the automotive smart antenna market in emerging economies can be attributed to the persistent lack of robust communication infrastructure. However, addressing this challenge presents an opportunity for collaborative efforts among governments, private sector stakeholders, and international organizations to invest in and develop comprehensive communication networks. By strategically addressing infrastructure gaps, fostering innovation, and implementing targeted policies, the market can overcome barriers and unlock its full potential, ensuring seamless connectivity and the integration of advanced technologies in vehicles within these economies.

OPPORTUNITY:New revenue opportunity in autonomous vehicle ecosystem

Currently, vehicles are equipped with various electronic components to sense the environment around the car and transmit and receive data through a smart antenna. Behind the entire communication process with various ECUs, a huge amount of data is generated to implement machine learning with algorithms in the computing system of vehicles. This is how OEMs, automotive Tier I suppliers, and other players (such as software development companies) will make autonomous vehicles possible. Autonomous vehicles catalyze a paradigm shift in the transportation industry, offering revenue opportunities across diverse logistics, ride-sharing, and mobility-as-a-service sectors. One prominent avenue is the rise of Mobility-as-a-Service (MaaS) platforms. Companies like Waymo (US), a subsidiary of Alphabet, have initiated autonomous ride-hailing services, allowing users to have self-driving taxis through mobile applications. This presents a convenient and efficient mode of transportation and establishes a revenue stream through per-ride charges and subscription models. Also, in April 2021, Domino's (US) partnered with Ford (US) to test autonomous pizza delivery vehicles in Houston, Texas. These self-driving cars were equipped with Domino's branding and used to deliver pizzas to customers who opted for the service. While the program is still in its pilot phase, it shows the potential for autonomous vehicles to revolutionize the delivery industry.

Apart from OEMs and other players in the automotive ecosystem, governments are taking steps to support autonomous vehicles. The regulatory bodies are encouraging the companies to develop technologies that will improve the vehicle's performance and the passengers' safety.

The deployment of autonomous vehicles in last-mile delivery services has gained traction. Companies like Amazon (US) and FedEx (US) are exploring using autonomous delivery vehicles to enhance efficiency and reduce operational costs. Autonomous delivery services streamline logistics and create revenue through delivery fees and partnerships with e-commerce platforms. These underscore how autonomous vehicles are reshaping transportation and creating novel revenue opportunities that extend across various industries. Hence, companies focus on autonomous vehicles, which require reliable and robust multiband technology in smart antennae. This will create new opportunities for the autonomous vehicle ecosystem.

CHALLENGE: Increase in cybercrimes for vehicles equipped with connected car features

The a Despite the considerable advancements in connected car technology, the automotive sector grapples with a significant and pressing challenge: cybersecurity. Connected cars, incorporating a blend of hardware, software, mobile applications, and Bluetooth connectivity, expose a range of vulnerabilities susceptible to cyberattacks. Instances such as the 2021 data breach affecting luxury brands Volkswagen and Audi, which exposed sensitive information in the US and Canada, are stark reminders of the potential consequences of cybersecurity lapses within the intricate networks of connected vehicles.

Hacking passive entry systems in cars poses a significant challenge for automotive smart antennas, as these antennas play a crucial role in facilitating wireless communication between the car and the smart key. Passive entry systems rely on radio frequency identification (RFID) or similar technologies to automatically unlock the car when the key fob is in proximity. However, sophisticated hackers can exploit vulnerabilities in smart antennas to intercept or manipulate these signals, leading to unauthorized access to the vehicle. For example, attackers may use signal amplification or relay attacks to extend the effective range of the key fob signal, tricking the smart antenna into unlocking the car even when the key fob is at a considerable distance. This security concern has increased the importance of robust encryption protocols and continuous advancements in smart antenna technology to protect such hacking attempts and ensure the integrity of passive entry systems in connected vehicles.

A white paper released by Accenture in November 2019 claimed that there has been a 67% surge in data breaches, with the US being the most frequently targeted target of assaults. To integrate cybersecurity and threat detection systems with data analytics and Al, multiple stakeholders are working on cybersecurity solutions to make connected cars and automotive smart antennas safer.

According to the Upstream Security Global Automotive Cybersecurity report, 21.4% of attacks that are made on connected vehicles are made majorly by the Black hat system. Hence, cybersecurity plays a pivotal role in safeguarding automotive smart antenna systems, as their integration into modern vehicles introduces new challenges and potential vulnerabilities. The reliance on wireless communication and connectivity features demands robust security measures to protect against cyber threats. Manufacturers must prioritize the implementation of advanced encryption protocols, secure key storage, and continuous monitoring to fortify smart antenna systems against potential hacking attempts. As the automotive sector embraces the era of connected and autonomous vehicles, a proactive and collaborative approach involving manufacturers, cybersecurity experts, and regulatory bodies becomes essential to ensure the resilience and safety of automotive smart antenna systems in the face of evolving cyber threats.

Automotive Smart Antenna Market Ecosystem.

The major automotive smart antenna market companies have the latest technologies, diversified portfolios, and strong distribution networks globally. The major players in the market include Continental AG (Germany), Denso Corporation (Japan), TE Connectivity (Switzerland), Forvia (France), and Ficosa Internacional SA (Spain).

Automotive Smart Antenna Market

The passenger car segment is estimated to be the largest market during the forecasted period.

Passenger cars contribute to the largest market share of the global vehicle market. These vehicles are the early adopters of new technologies and safety features, some directly related to automotive smart antennas installed in the vehicles. Features such as ADAS, V2X, collision avoidance systems, adaptive cruise control, pedestrian safety, and intersection movement assist (IMA) are some of the features offered by major OEMs in their premium and luxury vehicles, owing to the need for smart antennas in vehicles. Adding further In-vehicle entertainment has witnessed significant advancements, contributing to an increased focus on enhancing the overall driving experience. Modern vehicles are increasingly equipped with sophisticated infotainment systems, providing many entertainment options for drivers and passengers. Features such as integrated navigation, audio/video playback, Apple CarPlay, and Android Auto are offered in the vehicle, which requires smart antenna to enjoy the personalized driving experience seamlessly.

The advent of autonomous vehicles is expected to have a transformative impact on the smart antenna market, driving increased demand for advanced communication technologies. Autonomous vehicles rely on real-time data exchange and seamless communication to navigate, make decisions, and ensure safety. Smart antennas play a crucial role in facilitating Vehicle-to-Everything (V2X) communication, allowing autonomous vehicles to interact with each other, infrastructure, and pedestrians. These antennas enable the transmission and reception of data related to the vehicle's surroundings, traffic conditions, and potential hazards. In the US, The Jaguar I-PACE electric SUV is used by Waymo's fleet, first introduced in March 2022. It offers Waymo's self-driving technology, smoother handling, faster acceleration, and a more luxurious interior. As the deployment of autonomous vehicles becomes more widespread, the smart antenna market is poised to experience substantial growth, providing the essential communication infrastructure for these advanced vehicles' safe and efficient operation.

The rapid growth of telecom infrastructure is a key driving force behind the increasing adoption of automotive smart antennas in passenger cars. The widespread deployment of 4G and the impending arrival of 5G networks create a robust data highway for smart antennas, which have paved the way for advanced connectivity features in vehicles. As telecom infrastructure evolves, passenger cars are becoming integral components of the broader Internet of Things (IoT) ecosystem, benefiting from seamless communication, real-time data exchange, and improved connectivity on the road. Ford (US), in March 2022, announced that it would invest USD 50 billion in commitment for the electrification of all vehicle types by 2026.

As the digital age expands, passenger cars will be equipped with more advanced features like real-time information that empowers smoother journeys, innovative technology that enhances safety, and the possible advent of interconnected cars, which will need automotive smart antennas.

Ultra-high frequency is the fastest-growing frequency segment for the automotive smart antenna market.

The ultra-high frequency for automotive smart antennas ranges from 2000 to 6000 MHz. This application or frequency is based on long-range communication. Applications such as satellite radio (SDARS), digital video broadcasting (DVB), cellular connectivity, WLAN, and V2V communication fall under ultra-high frequency. The ultra-high frequency segment is expected to be the fastest-growing segment of the market owing to an increase in connected cars. The connected car concept has brought the next growth cycle of the automotive sector with a rise in convenience and safety features.

Compared to lower frequencies, Ultra-high offers significantly higher bandwidth, enabling faster data transmission, which is crucial for next-generation connected car applications like Cellular V2X communication, real-time traffic updates, and even high-definition in-car entertainment streaming. This bandwidth advantage future-proofs vehicles for the ever-increasing data demands of connected car technologies. Also, the higher frequencies are less susceptible to interference from common sources like buildings and other vehicles. This translates to more reliable and stable data connection, especially in crowded urban environments, ensuring seamless communication for critical safety applications like collision avoidance and traffic flow optimization.

Vehicles such as Mercedes-Benz S-Class, BMW iX Flow, Audi e-tron GT, Genesis GV70, and Porsche Taycan are few examples of Luxury cars that are mostly equipped with advanced connectivity features, including high-speed internet, in-car Wi-Fi, sophisticated infotainment systems, advanced autonomous driving capabilities, and ADAS features that rely on robust communication systems, where smart antennas with ultra-high-frequency bands enhance the performance of these systems by ensuring reliable and efficient data exchange to increase the safety and in-car experience. According to MarketsandMarkets' analysis, premium car sales have increased by 11.3% from 2019 to 2022. Hence, it will create more opportunities for key automotive players.

BEVs hold the largest market share in the electric vehicles type segment for automotive smart antennae.

The automotive smart antenna market has witnessed a shift in consumer preference for BEVs, which has led to wide adoption of smart antennas. The BEVs are the ideal platform with advanced antenna technology equipped with sensors, processors, and communication modules. This intricate network relies heavily on robust and dependable smart antennas for several critical functions.

Considering the regional investments in the US, the Bipartisan Infrastructure Investment group had invested USD 550 billion in August 2021 which also included V2X technology deployment for US roads, including funding for the purchase and installation of compatible vehicle equipment. Also, the US governing body has allocated a subsidy for EVs with a tax credit of USD 7,500 to purchase new BEVs, indirectly supporting the adoption of smart antennas as they are becoming standard features in many models. Also, several EU member states have offered their national subsidies of USD 5,440 for purchasing BEVs under the French Bonus écologique scheme to increase the sales of BEV vehicles manufactured in France over Chinese EVs. The rising sales of BEVs in Europe and US are expected to increase the demand for smart antennae in electric cars during the forecast period.

According to MarketsandMarkets analysis, the global Electric vehicles market is valued at USD 388.1 in 2023 and is expected to grow to USD 951.9 billion in 2030 at a CAGR of 13.7%. Hence, these increasing sales of EVs with government subsidies and investments in infrastructure will drive the BEVs market for the automotive smart antenna market.

Asia Pacific holds the largest share of the automotive smart antenna market.

The Asia-Pacific region has emerged as a stronghold for the automotive smart antenna market, primarily fueled by the dynamic growth of its automotive industry and the rapid adoption of advanced technologies. Notably, major automotive markets such as China, Japan, South Korea, and India have been at the forefront of this trend. The surge in connected vehicle technologies has played a pivotal role, with smart antennas being a critical component for seamless communication between vehicles and the evolving smart infrastructure. The deployment of 5G connectivity has further accelerated the demand for smart antennas, mainly as they facilitate high-speed, low-latency communication crucial for advancing autonomous vehicles. In July 2023, Telcos (Israel) planned to invest USD 259 billion till 2030 in the Asia Pacific region for 5G.

Investments and collaborations between the region's automotive manufacturers and technology firms have spurred the development of innovative smart antenna solutions. The partnerships between local automotive companies and global tech players highlight the commitment to integrating advanced communication systems into vehicles. For instance, Tata Motors (India) and Microsoft (US) collaborated to build connected car platforms and integrate Microsoft Azure cloud services for advanced in-vehicle features. Government initiatives and supportive regulations have also contributed to the growth of smart antenna technologies, with policymakers recognizing their role in enhancing safety and connectivity. The consumer preferences for advanced vehicle features and the rising adoption of electric and hybrid vehicles further underscore the significance of smart antennas in the Asia-Pacific automotive market.

China has the major dominance in the Asia-Pacific region for the automotive smart antenna market due to their strategic investments and supportive policies. The Chinese government has pushed EVs and smart transportation systems, increasing the demand for advanced technologies like smart antennas. Partnership between OEMs and component manufacturers has also boosted smart antennas' growth. For instance, Huawei and Great Wall Motors signed a partnership agreement in June 2020 to develop smart EVs. This collaboration emphasizes the integration of Huawei's expertise in 5G technology and smart antennas with Great Wall Motors' capabilities in electric vehicle manufacturing. Such initiatives reflect the broader trend in China, where automotive players actively invest in smart antenna technologies to meet the rising demand for connected and autonomous vehicles, solidifying China's position as a frontrunner in the market.

The Asia Pacific region is a dominant market in the automotive smart antenna sector, resulting in confluence of factors, including robust industry growth, technological advancements, strategic investments, and collaborative efforts between key stakeholders.

Automotive Smart Antenna Market Size, and Share

Key Market Players

Major manufacturers in the Automotive smart antenna market includes major players in the market such as Continental AG (Germany), Denso Corporation (Japan), TE Connectivity (Switzerland), Forvia (France), and Ficosa Internacional SA (Spain).

Get online access to the report on the World's First Market Intelligence Cloud

  • Easy to Download Historical Data & Forecast Numbers
  • Company Analysis Dashboard for high growth potential opportunities
  • Research Analyst Access for customization & queries
  • Competitor Analysis with Interactive dashboard
  • Latest News, Updates & Trend analysis
Request Sample

Scope of the Report

Report Attribute

Details

Market size available for years

2018–2030

Base year considered

2022

Market Growth forecast 

USD 5.12 Billion by 2030 from USD 2.50 Billion in 2023 at 10.9% CAGR

Forecast period

2023–2030

Forecast units

Value (USD Million/Billion)

Segments Covered

Vehicle Type, Frequency, Type, Sales Channel, Component Type, and Electric Vehicle Type

Geographies covered

Asia Pacific, North America, Europe, and Rest of the World.

Top Players

Continental AG (Germany), Denso Corporation (Japan), TE Connectivity (Switzerland), Forvia (France), and Ficosa Internacional SA (Spain).
A total of 20 other major players covered

With the given market data, MarketsandMarkets offers customizations per the company’s specific needs.

The study segments the automotive smart antenna market:

Automotive Smart Antenna Market, By Vehicle Type
  • Passenger Car
  • Light Commercial Vehicles
  • Heavy Commercial Vehicles
Automotive Smart Antenna Market, By Frequency
  • High
  • Very High
  • Ultra High
Automotive Smart Antenna Market, By Sales Channel
  • OEM
  • Aftermarket
Automotive Smart Antenna Market, By Component Type
  • Transceiver
  • Electronic Control Unit (ECU)
  • Others (Connector, Wire Harness, and Digital Bus)
Electric Vehicle Type
  • Battery Electric Vehicle (BEV)
  • Fuel Cell Electric Vehicle (FCEV)
  • Plug-in Hybrid Vehicle (PHEV)
Automotive Paints Market, By Region
  • North America
  • Europe
  • Asia Pacific
  • Rest of the World

Recent Developments

  • In January 2022, Denso developed Global Safety Package 3, an active safety system designed to improve the safety of vehicles by giving them high sensing capability of their surroundings. This package combines a millimeter-wave radar sensor and a vision sensor for excellent vehicle safety. To reduce the cost and size, the company has reduced the number of parts compared to the previous generation. In this package, the company uses multiple-input and multiple-output (MIMO) technology, which has A compact antenna with only a few channels for transmitting and receiving radio signals. This feature has been used in THE Hino Ranger (Japan), Lexus (Japan) NX, and the Toyota (Japan) Noah and Voxy.
  • In August 2023, TE Connectivity launched FP20 and FP40, which were multi-port antennas combining several functions like LTE/5G, Wi-Fi 6E/7, and Bluetooth into one, simplifying installation, reducing roof clutter, and boosting aesthetics. The passenger will experience faster internet, reliable navigation, and smoother Bluetooth connections. It comes with future-proof 5G and Wi-Fi 6E/7 support. These antennas are specially designed for connected cars.
  • In March 2023, Continental AG and HERE Technologies announced a partnership agreement to integrate HERE's high-definition (HD) map data with Continental's C-V2X solutions. This combination provides vehicles with precise location information. It enables them to communicate with each other and surrounding infrastructure, enhancing safety and efficiency on the road with the help of smart antennas.
  • In October 2022, Denso Corporation and DESAY SV Automotive Co., Ltd. (DESAY SV) established a joint venture to develop and manufacture smart antenna systems for connected vehicles. This partnership strategically combined the strengths of both companies, such as Denso Corporation's expertise in RF technology and antenna design, strong R&D capabilities, and global manufacturing footprint. In contrast, Desay SV shared its automotive infotainment systems and ADAS technologies, and it has a strong presence in the Chinese automotive market.
  • In January 2022, Continental AG signed a partnership agreement with NXP Semiconductors to develop and commercialize next-generation radar sensors and software solutions for ADAS and autonomous driving applications. This partnership leveraged NXP's high-performance radar chipsets and Continental's expertise in radar sensor design and software development to deliver innovative solutions for the future of mobility.

Frequently Asked Questions (FAQ):

To speak to our analyst for a discussion on the above findings, click Speak to Analyst

TABLE OF CONTENTS
 
1 INTRODUCTION (Page No. - 33)
    1.1 STUDY OBJECTIVES 
    1.2 MARKET DEFINITION 
           1.2.1 INCLUSIONS AND EXCLUSIONS
                    TABLE 1 INCLUSIONS AND EXCLUSIONS
    1.3 STUDY SCOPE 
           FIGURE 1 AUTOMOTIVE SMART ANTENNA MARKET SEGMENTATION
           1.3.1 REGIONS COVERED
           1.3.2 YEARS CONSIDERED
    1.4 CURRENCY CONSIDERED 
           TABLE 2 CURRENCY EXCHANGE RATES
    1.5 UNIT CONSIDERED 
    1.6 STAKEHOLDERS 
    1.7 SUMMARY OF CHANGES 
 
2 RESEARCH METHODOLOGY (Page No. - 38)
    2.1 RESEARCH DATA 
           FIGURE 2 AUTOMOTIVE SMART ANTENNA MARKET: RESEARCH DESIGN
           FIGURE 3 RESEARCH DESIGN MODEL
           2.1.1 SECONDARY DATA
                    2.1.1.1 List of key secondary sources to estimate vehicle production
                    2.1.1.2 List of key secondary sources to estimate market size
                    2.1.1.3 Key data from secondary sources
           2.1.2 PRIMARY DATA
                    FIGURE 4 BREAKDOWN OF PRIMARY INTERVIEWS
                    2.1.2.1 Primary participants
    2.2 MARKET SIZE ESTIMATION 
           FIGURE 5 RESEARCH METHODOLOGY: HYPOTHESIS BUILDING
           2.2.1 BOTTOM-UP APPROACH
                    FIGURE 6 AUTOMOTIVE SMART ANTENNA MARKET SIZE ESTIMATION:  BOTTOM-UP APPROACH (VEHICLE TYPE AND REGION)
           2.2.2 TOP-DOWN APPROACH
                    FIGURE 7 AUTOMOTIVE SMART ANTENNA MARKET SIZE ESTIMATION: TOP-DOWN APPROACH (FREQUENCY AND COMPONENT TYPE)
    2.3 DATA TRIANGULATION 
           FIGURE 8 DATA TRIANGULATION
    2.4 FACTOR ANALYSIS 
    2.5 RESEARCH ASSUMPTIONS 
    2.6 RESEARCH LIMITATIONS 
    2.7 RECESSION IMPACT ANALYSIS 
 
3 EXECUTIVE SUMMARY (Page No. - 51)
    3.1 REPORT SUMMARY 
           FIGURE 9 AUTOMOTIVE SMART ANTENNA MARKET, BY VEHICLE TYPE, 2023 VS. 2030
 
4 PREMIUM INSIGHTS (Page No. - 54)
    4.1 ATTRACTIVE OPPORTUNITIES FOR PLAYERS IN AUTOMOTIVE SMART ANTENNA MARKET 
           FIGURE 10 INCREASE IN VEHICLE PRODUCTION TO DRIVE MARKET
    4.2 MARKET, BY FREQUENCY 
           FIGURE 11 VERY HIGH TO BE LARGEST FREQUENCY SEGMENT DURING FORECAST PERIOD
    4.3 MARKET, BY COMPONENT 
           FIGURE 12 TRANSCEIVER TO BE LEADING COMPONENT TYPE IN 2030
    4.4 MARKET, BY TYPE 
           FIGURE 13 SHARK-FIN ANTENNA TO DOMINATE MARKET IN 2030
    4.5 MARKET, BY VEHICLE TYPE 
           FIGURE 14 PASSENGER CAR TO BE LARGEST VEHICLE TYPE FOR AUTOMOTIVE SMART ANTENNA DURING FORECAST PERIOD
    4.6 MARKET, BY ELECTRIC VEHICLE 
           FIGURE 15 BEV TO SECURE LEADING MARKET POSITION DURING FORECAST PERIOD
    4.7 MARKET, BY REGION 
           FIGURE 16 ASIA PACIFIC TO BE FASTEST-GROWING MARKET DURING FORECAST PERIOD
 
5 MARKET OVERVIEW (Page No. - 58)
    5.1 INTRODUCTION 
           FIGURE 17 EVOLUTION OF AUTOMOTIVE SMART ANTENNA
    5.2 MARKET DYNAMICS 
           FIGURE 18 AUTOMOTIVE SMART ANTENNA MARKET: DRIVERS, RESTRAINTS, OPPORTUNITIES, AND CHALLENGES
           5.2.1 DRIVERS
                    5.2.1.1 Growing cellular applications for connected vehicles
                               FIGURE 19 AVERAGE DOWNLOAD SPEED, COUNTRY-WISE, 2022
                    5.2.1.2 Rising demand for safety features in vehicles
                               TABLE 3 US DEPARTMENT OF TRANSPORTATION'S FATALITY ANALYSIS REPORTING SYSTEM (FARS)
                    5.2.1.3 Growing use of Electrical/Electronic (E/E) architecture
                               FIGURE 20 EVOLUTION OF E/E VEHICLE ARCHITECTURE
                    5.2.1.4 Increasing EV sales
           5.2.2 RESTRAINTS
                    5.2.2.1 Lack of communication infrastructure in emerging economies
           5.2.3 OPPORTUNITIES
                    5.2.3.1 New revenue opportunity in autonomous vehicle ecosystem
                               TABLE 4 AUTONOMOUS VEHICLE REGULATIONS FOR KEY REGIONS/COUNTRIES
                               FIGURE 21 ADAS MARKET, BY LEVEL OF AUTONOMY, 2022–2030 (‘000 UNITS)
                    5.2.3.2 Significant revenue contribution by premium vehicle sales
                               TABLE 5 PREMIUM VEHICLES SOLD IN 2022–2023 WITH THEIR FEATURES
                    5.2.3.3 Increasing in-car entertainment options
                               TABLE 6 FEATURES OFFERED BY OEMS FOR IN-VEHICLE INFOTAINMENT SYSTEMS, 2022–2023
                    5.2.3.4 New revenue stream by key players using data monetization
                               FIGURE 22 AVERAGE DATA GENERATED BY CONNECTED CAR FEATURE
           5.2.4 CHALLENGES
                    5.2.4.1 Increase in cybercrimes for vehicles equipped with connected car features
                               FIGURE 23 MOST COMMON ATTACK VECTORS, 2019–2020
                    5.2.4.2 Interference with metal objects reducing reception frequency quality
    5.3 TRENDS AND DISRUPTIONS IMPACTING CUSTOMER BUSINESS 
           FIGURE 24 TRENDS AND DISRUPTIONS IMPACTING AUTOMOTIVE SMART ANTENNA MARKET
    5.4 SUPPLY CHAIN ANALYSIS 
           FIGURE 25 SUPPLY CHAIN ANALYSIS
           TABLE 7 ROLE OF COMPANIES IN SUPPLY CHAIN
    5.5 PRICING ANALYSIS 
           5.5.1 PRICING ANALYSIS FOR AUTOMOTIVE SMART ANTENNA
           5.5.2 AVERAGE SELLING PRICE TREND OF AUTOMOTIVE SMART ANTENNA, BY TYPE
                    TABLE 8 AVERAGE SELLING PRICE TREND OF AUTOMOTIVE SMART ANTENNA, BY TYPE, 2022 (USD)
           5.5.3 AVERAGE SELLING PRICE TREND OF AUTOMOTIVE SMART ANTENNA, BY REGION
                    TABLE 9 AVERAGE SELLING PRICE TREND OF AUTOMOTIVE SMART ANTENNA, BY REGION,  2022 (USD)
           5.5.4 AUTOMOTIVE CONVENTIONAL VS. SMART ANTENNA
                    TABLE 10 EXAMPLES OF AUTOMOTIVE CONVENTIONAL AND SMART ANTENNA
    5.6 CASE STUDY ANALYSIS 
           5.6.1 MANTARAY: FUTURE OF CONNECTED CARS
           5.6.2 VIRTUAL SIGNAL TESTING FOR VEHICLE ANTENNAS FROM ALTAIR ENGINEERING INC.
           5.6.3 INSTALLING TV IN VEHICLES FROM RT-RK LLC
    5.7 PATENT ANALYSIS 
           TABLE 11 INNOVATIONS AND PATENTS, 2021–2023
    5.8 TRADE ANALYSIS 
           5.8.1 IMPORT DATA
                    TABLE 12 US: IMPORT DATA, BY COUNTRY (%)
                    TABLE 13 JAPAN: IMPORT DATA, BY COUNTRY (%)
                    TABLE 14 GERMANY: IMPORT DATA, BY COUNTRY (%)
                    TABLE 15 UK: IMPORT DATA, BY COUNTRY (%)
                    TABLE 16 MEXICO: IMPORT DATA, BY COUNTRY (%)
                    TABLE 17 FRANCE: IMPORT DATA, BY COUNTRY (%)
           5.8.2 EXPORT DATA
                    TABLE 18 CHINA: EXPORT DATA, BY COUNTRY (%)
                    TABLE 19 US: EXPORT DATA, BY COUNTRY (%)
                    TABLE 20 GERMANY: EXPORT DATA, BY COUNTRY (%)
                    TABLE 21 UK: EXPORT DATA, BY COUNTRY (%)
                    TABLE 22 HONG KONG: EXPORT DATA, BY COUNTRY (%)
    5.9 TECHNOLOGY ANALYSIS 
           5.9.1 MULTI MILLIMETER-WAVE (MMWAVE) TECHNOLOGY
                    FIGURE 26 WORLDWIDE ALLOCATION OF 60 GHZ MMWAVE SPECTRUM
           5.9.2 CONFORMAL ANTENNA
           5.9.3 5G INTEGRATED ANTENNA
                    FIGURE 27 EVOLUTION OF INTERNET AND ITS SPEED
           5.9.4 EVOLUTION OF SMARTPHONE FOR AUTOMOTIVE SMART ANTENNA
           5.9.5 IN-VEHICLE EXPERIENCE
           5.9.6 IOT TECHNOLOGY USED IN SMART ANTENNA
           5.9.7 V2X TECHNOLOGY
                    FIGURE 28 V2X TECHNOLOGY
    5.10 ECOSYSTEM MAPPING 
           FIGURE 29 ECOSYSTEM MAPPING
    5.11 TARIFF AND REGULATORY LANDSCAPE 
           5.11.1 GLOBAL
                    TABLE 23 STANDARDS FOR AUTOMOTIVE SMART ANTENNA, BY COUNTRY
           5.11.2 EUROPE
                    TABLE 24 EUROPE: SPECIFICATION STANDARDS FOR AUTOMOTIVE ANTENNA
           5.11.3 US
                    TABLE 25 US: SPECIFICATION STANDARDS FOR AUTOMOTIVE ANTENNA
           5.11.4 REGULATORY BODIES, GOVERNMENT AGENCIES, AND OTHER ORGANIZATIONS
                    5.11.4.1 North America
                               TABLE 26 NORTH AMERICA: REGULATORY BODIES, GOVERNMENT AGENCIES, AND OTHER ORGANIZATIONS
                    5.11.4.2 Europe
                               TABLE 27 EUROPE: REGULATORY BODIES, GOVERNMENT AGENCIES, AND OTHER ORGANIZATIONS
                    5.11.4.3 Asia Pacific
                               TABLE 28 ASIA PACIFIC: REGULATORY BODIES, GOVERNMENT AGENCIES, AND OTHER ORGANIZATIONS
    5.12 KEY STAKEHOLDERS AND BUYING CRITERIA 
           5.12.1 BUYING CRITERIA
                    FIGURE 30 KEY BUYING CRITERIA FOR AUTOMOTIVE SMART ANTENNA
                    TABLE 29 KEY BUYING CRITERIA FOR AUTOMOTIVE SMART ANTENNA
           5.12.2 KEY STAKEHOLDERS
                    TABLE 30 INFLUENCE OF STAKEHOLDERS ON BUYING PROCESS OF AUTOMOTIVE SMART ANTENNA
    5.13 KEY CONFERENCES AND EVENTS IN 2024 
                    TABLE 31 KEY CONFERENCES AND EVENTS, 2024
    5.14 SUPPLIER ANALYSIS 
                    TABLE 32 SMART ANTENNA SUPPLIER ANALYSIS, 2021–2023
 
6 AUTOMOTIVE SMART ANTENNA MARKET, BY COMPONENT TYPE (Page No. - 107)
    6.1 INTRODUCTION 
           6.1.1 PRIMARY INSIGHTS
                    FIGURE 31 AUTOMOTIVE SMART ANTENNA MARKET, BY COMPONENT,  2023 VS. 2030 (USD MILLION)
                    TABLE 33 MARKET, BY COMPONENT, 2018–2022 (USD MILLION)
                    TABLE 34 MARKET, BY COMPONENT, 2023–2030 (USD MILLION)
    6.2 TRANSCEIVER 
           6.2.1 INCREASING DEMAND FOR CONNECTED CARS TO DRIVE MARKET
                    TABLE 35 TRANSCEIVER: MARKET, BY REGION,  2018–2022 (USD MILLION)
                    TABLE 36 TRANSCEIVER: MARKET, BY REGION,  2023–2030 (USD MILLION)
    6.3 ELECTRONIC CONTROL UNIT (ECU) 
           6.3.1 SMALLER SIZE WITH INCREASED PROCESSING SPEED TO DRIVE MARKET
                    TABLE 37 ECU: MARKET, BY REGION, 2018–2022 (USD MILLION)
                    TABLE 38 ECU: MARKET, BY REGION, 2023–2030 (USD MILLION)
    6.4 OTHERS 
           TABLE 39 OTHERS: MARKET, BY REGION,  2018–2022 (USD MILLION)
           TABLE 40 OTHERS: MARKET, BY REGION,  2023–2030 (USD MILLION)
 
7 AUTOMOTIVE SMART ANTENNA MARKET, BY FREQUENCY (Page No. - 113)
    7.1 INTRODUCTION 
           TABLE 41 AUTOMOTIVE SMART ANTENNA: FREQUENCY USAGE PLAN FOR VEHICLE APPLICATIONS
           TABLE 42 AUTOMOTIVE SMART ANTENNA: OPERATIONAL DATA
           7.1.1 PRIMARY INSIGHTS
                    FIGURE 32 AUTOMOTIVE SMART ANTENNA MARKET, BY FREQUENCY,  2023 VS. 2030 (USD MILLION)
                    TABLE 43 MARKET, BY FREQUENCY, 2018–2022 (‘000 UNITS)
                    TABLE 44 MARKET, BY FREQUENCY, 2023–2030 (’000 UNITS)
                    TABLE 45 MARKET, BY FREQUENCY, 2018–2022 (USD MILLION)
                    TABLE 46 MARKET, BY FREQUENCY, 2023–2030 (USD MILLION)
    7.2 HIGH 
           7.2.1 KEYLESS ENTRY SYSTEM WITH ADVANCED FEATURES TO DRIVE MARKET
                    TABLE 47 HIGH FREQUENCY: AUTOMOTIVE SMART ANTENNA MARKET, BY REGION,  2018–2022 (‘000 UNITS)
                    TABLE 48 HIGH FREQUENCY: MARKET, BY REGION,  2023–2030 (‘000 UNITS)
                    TABLE 49 HIGH FREQUENCY: MARKET, BY REGION,  2018–2022 (USD MILLION)
                    TABLE 50 HIGH FREQUENCY: MARKET, BY REGION,  2023–2030 (USD MILLION)
    7.3 VERY HIGH 
           7.3.1 INCREASE IN SALES OF SUV VEHICLES TO DRIVE MARKET
                    TABLE 51 VERY HIGH FREQUENCY: AUTOMOTIVE SMART ANTENNA MARKET, BY REGION,  2018–2022 (‘000 UNITS)
                    TABLE 52 VERY HIGH FREQUENCY: MARKET, BY REGION,  2023–2030 (‘000 UNITS)
                    TABLE 53 VERY HIGH FREQUENCY: MARKET, BY REGION,  2018–2022 (USD MILLION)
                    TABLE 54 VERY HIGH FREQUENCY: MARKET, BY REGION,  2023–2030 (USD MILLION)
    7.4 ULTRA HIGH 
           7.4.1 INCREASE IN SALES OF LUXURY VEHICLES TO DRIVE MARKET
                    TABLE 55 ULTRA HIGH FREQUENCY: AUTOMOTIVE SMART ANTENNA MARKET, BY REGION,  2018–2022 (‘000 UNITS)
                    TABLE 56 ULTRA HIGH FREQUENCY: MARKET, BY REGION,  2023–2030 (‘000 UNITS)
                    TABLE 57 ULTRA HIGH FREQUENCY: MARKET, BY REGION,  2018–2022 (USD MILLION)
                    TABLE 58 ULTRA HIGH FREQUENCY: MARKET, BY REGION,  2023–2030 (USD MILLION)
 
8 AUTOMOTIVE SMART ANTENNA MARKET, BY SALES CHANNEL (Page No. - 124)
    8.1 INTRODUCTION 
           8.1.1 PRIMARY INSIGHTS
    8.2 OEMS 
    8.3 AFTERMARKET 
           TABLE 59 KEY COMPANIES OFFERING AUTOMOTIVE SMART ANTENNA IN AFTERMARKET
 
9 AUTOMOTIVE SMART ANTENNA MARKET, BY TYPE (Page No. - 126)
    9.1 INTRODUCTION 
           9.1.1 PRIMARY INSIGHTS
                    FIGURE 33 AUTOMOTIVE SMART ANTENNA MARKET, BY TYPE,  2023 VS. 2030 (USD MILLION)
                    TABLE 60 MARKET, BY TYPE, 2018–2022 (‘000 UNITS)
                    TABLE 61 MARKET, BY TYPE, 2023–2030 (’000 UNITS)
                    TABLE 62 MARKET, BY TYPE, 2018–2022 (USD MILLION)
                    TABLE 63 MARKET, BY TYPE, 2023–2030 (USD MILLION)
    9.2 SHARK-FIN 
           9.2.1 CONSUMER PREFERENCE FOR ADVANCED FEATURES TO DRIVE MARKET
                    TABLE 64 VEHICLES OFFERED WITH SHARK-FIN ANTENNAS, 2022–2024
                    TABLE 65 SHARK-FIN ANTENNA MARKET, BY REGION, 2018–2022 (‘000 UNITS)
                    TABLE 66 SHARK-FIN ANTENNA MARKET, BY REGION, 2023–2030 (‘000 UNITS)
                    TABLE 67 SHARK-FIN ANTENNA MARKET, BY REGION, 2018–2022 (USD MILLION)
                    TABLE 68 SHARK-FIN ANTENNA MARKET, BY REGION, 2023–2030 (USD MILLION)
    9.3 FIXED MAST 
           9.3.1 COST-EFFECTIVENESS AND SIMPLE DESIGN TO DRIVE MARKET
                    TABLE 69 FIXED MAST ANTENNA MARKET, BY REGION, 2018–2022 (‘000 UNITS)
                    TABLE 70 FIXED MAST ANTENNA MARKET, BY REGION, 2023–2030 (‘000 UNITS)
                    TABLE 71 FIXED MAST ANTENNA MARKET, BY REGION, 2018–2022 (USD MILLION)
                    TABLE 72 FIXED MAST ANTENNA MARKET, BY REGION, 2023–2030 (USD MILLION)
 
10 AUTOMOTIVE SMART ANTENNA MARKET, BY VEHICLE TYPE (Page No. - 134)
     10.1 INTRODUCTION 
             10.1.1 PRIMARY INSIGHTS
                       FIGURE 34 AUTOMOTIVE SMART ANTENNA MARKET, BY VEHICLE TYPE,  2023 VS. 2030 (USD MILLION)
                       TABLE 73 MARKET, BY VEHICLE TYPE, 2018–2022 (‘000 UNITS)
                       TABLE 74 MARKET, BY VEHICLE TYPE, 2023–2030 (’000 UNITS)
                       TABLE 75 MARKET, BY VEHICLE TYPE, 2018–2022 (USD MILLION)
                       TABLE 76 MARKET, BY VEHICLE TYPE, 2023–2030 (USD MILLION)
     10.2 PASSENGER CAR (PC) 
             10.2.1 RAPID GROWTH OF TELECOM INFRASTRUCTURE TO DRIVE MARKET
                       TABLE 77 PASSENGER CAR SMART ANTENNA MARKET, BY REGION, 2018–2022 (‘000 UNITS)
                       TABLE 78 PASSENGER CAR SMART ANTENNA MARKET, BY REGION, 2023–2030 (‘000 UNITS)
                       TABLE 79 PASSENGER CAR SMART ANTENNA MARKET, BY REGION, 2018–2022 (USD MILLION)
                       TABLE 80 PASSENGER CAR SMART ANTENNA MARKET, BY REGION, 2023–2030 (USD MILLION)
     10.3 LIGHT COMMERCIAL VEHICLE (LCV) 
             10.3.1 ADVANCED TELEMATICS AND DATA EXCHANGE TO DRIVE MARKET
                       TABLE 81 LCV SMART ANTENNA MARKET, BY REGION, 2018–2022 (‘000 UNITS)
                       TABLE 82 LCV SMART ANTENNA MARKET, BY REGION, 2023–2030 (‘000 UNITS)
                       TABLE 83 LCV SMART ANTENNA MARKET, BY REGION, 2018–2022 (USD MILLION)
                       TABLE 84 LCV SMART ANTENNA MARKET, BY REGION, 2023–2030 (USD MILLION)
     10.4 HEAVY COMMERCIAL VEHICLE (HCV) 
             10.4.1 DATA-DRIVEN LOGISTICS AND PREDICTIVE MAINTENANCE TO DRIVE MARKET
                       TABLE 85 HCV SMART ANTENNA MARKET, BY REGION, 2018–2022 (‘000 UNITS)
                       TABLE 86 HCV SMART ANTENNA MARKET, BY REGION, 2023–2030 (‘000 UNITS)
                       TABLE 87 HCV SMART ANTENNA MARKET, BY REGION, 2018–2022 (USD MILLION)
                       TABLE 88 HCV SMART ANTENNA MARKET, BY REGION, 2023–2030 (USD MILLION)
 
11 AUTOMOTIVE SMART ANTENNA MARKET, BY ELECTRIC VEHICLE (Page No. - 144)
     11.1 INTRODUCTION 
             11.1.1 PRIMARY INSIGHTS
                       FIGURE 35 AUTOMOTIVE SMART ANTENNA MARKET, BY ELECTRIC VEHICLE,  2023 VS. 2030 (USD MILLION)
                       TABLE 89 MARKET, BY ELECTRIC VEHICLE,  2018–2022 (‘000 UNITS)
                       TABLE 90 MARKET, BY ELECTRIC VEHICLE,  2023–2030 (’000 UNITS)
                       TABLE 91 MARKET, BY ELECTRIC VEHICLE,  2018–2022 (USD MILLION)
                       TABLE 92 MARKET, BY ELECTRIC VEHICLE,  2023–2030 (USD MILLION)
     11.2 BATTERY ELECTRIC VEHICLE (BEV) 
             11.2.1 INCREASE IN ADOPTION OF STRICT EMISSIONS NORMS TO DRIVE MARKET
                       TABLE 93 BEV SMART ANTENNA MARKET, BY REGION, 2018–2022 (‘000 UNITS)
                       TABLE 94 BEV SMART ANTENNA MARKET, BY REGION, 2023–2030 (‘000 UNITS)
                       TABLE 95 BEV SMART ANTENNA MARKET, BY REGION, 2018–2022 (USD MILLION)
                       TABLE 96 BEV SMART ANTENNA MARKET, BY REGION, 2023–2030 (USD MILLION)
     11.3 PLUG-IN HYBRID ELECTRIC VEHICLE (PHEV) 
             11.3.1 GREATER RANGE THAN HEVS TO DRIVE MARKET
                       TABLE 97 PHEV SMART ANTENNA MARKET, BY REGION, 2018–2022 (‘000 UNITS)
                       TABLE 98 PHEV SMART ANTENNA MARKET, BY REGION, 2023–2030 (‘000 UNITS)
                       TABLE 99 PHEV SMART ANTENNA MARKET, BY REGION, 2018–2022 (USD MILLION)
                       TABLE 100 PHEV SMART ANTENNA MARKET, BY REGION, 2023–2030 (USD MILLION)
     11.4 FUEL CELL ELECTRIC VEHICLE (FCEV) 
             11.4.1 STRINGENT EMISSION REGULATIONS TO DRIVE MARKET
                       TABLE 101 FCEV SMART ANTENNA MARKET, BY REGION, 2018–2022 (‘000 UNITS)
                       TABLE 102 FCEV SMART ANTENNA MARKET, BY REGION, 2023–2030 (‘000 UNITS)
                       TABLE 103 FCEV SMART ANTENNA MARKET, BY REGION, 2018–2022 (USD MILLION)
                       TABLE 104 FCEV SMART ANTENNA MARKET, BY REGION, 2023–2030 (USD MILLION)
 
12 AUTOMOTIVE SMART ANTENNA MARKET, BY REGION (Page No. - 153)
     12.1 INTRODUCTION 
             12.1.1 PRIMARY INSIGHTS
                       FIGURE 36 AUTOMOTIVE SMART ANTENNA MARKET, BY REGION,  2023 VS. 2030 (USD MILLION)
                       TABLE 105 MARKET, BY REGION, 2018–2022 (‘000 UNITS)
                       TABLE 106 MARKET, BY REGION, 2023–2030 (‘000 UNITS)
                       TABLE 107 MARKET, BY REGION, 2018–2022 (USD MILLION)
                       TABLE 108 MARKET, BY REGION, 2023–2030 (USD MILLION)
     12.2 ASIA PACIFIC 
             12.2.1 RECESSION IMPACT
                       FIGURE 37 ASIA PACIFIC: AUTOMOTIVE SMART ANTENNA MARKET SNAPSHOT
                       FIGURE 38 ASIA PACIFIC: MARKET, BY COUNTRY,  2023 VS. 2030 (USD MILLION)
                       TABLE 109 ASIA PACIFIC: MARKET, BY COUNTRY,  2018–2022 (‘000 UNITS)
                       TABLE 110 ASIA PACIFIC: MARKET, BY COUNTRY,  2023–2030 (‘000 UNITS)
                       TABLE 111 ASIA PACIFIC: MARKET, BY COUNTRY,  2018–2022 (USD MILLION)
                       TABLE 112 ASIA PACIFIC: MARKET, BY COUNTRY,  2023–2030 (USD MILLION)
             12.2.2 CHINA
                       12.2.2.1 Increasing production of mid-segment and premium cars to drive market
                                   TABLE 113 CHINA: AUTOMOTIVE SMART ANTENNA MARKET, BY VEHICLE TYPE,  2018–2022 (‘000 UNITS)
                                   TABLE 114 CHINA: MARKET, BY VEHICLE TYPE,  2023–2030 (‘000 UNITS)
                                   TABLE 115 CHINA: MARKET, BY VEHICLE TYPE,  2018–2022 (USD MILLION)
                                   TABLE 116 CHINA: MARKET, BY VEHICLE TYPE,  2023–2030 (USD MILLION)
             12.2.3 JAPAN
                       12.2.3.1 Increase in popularity of compact cars to drive market
                                   TABLE 117 JAPAN: AUTOMOTIVE SMART ANTENNA MARKET, BY VEHICLE TYPE,  2018–2022 (‘000 UNITS)
                                   TABLE 118 JAPAN: MARKET, BY VEHICLE TYPE,  2023–2030 (‘000 UNITS)
                                   TABLE 119 JAPAN: MARKET, BY VEHICLE TYPE,  2018–2022 (USD MILLION)
                                   TABLE 120 JAPAN: MARKET, BY VEHICLE TYPE,  2023–2030 (USD MILLION)
             12.2.4 SOUTH KOREA
                       12.2.4.1 Growing demand for passenger cars to drive market
                                   TABLE 121 SOUTH KOREA: AUTOMOTIVE SMART ANTENNA MARKET, BY VEHICLE TYPE,  2018–2022 (‘000 UNITS)
                                   TABLE 122 SOUTH KOREA: MARKET, BY VEHICLE TYPE,  2023–2030 (‘000 UNITS)
                                   TABLE 123 SOUTH KOREA: MARKET, BY VEHICLE TYPE,  2018–2022 (USD MILLION)
                                   TABLE 124 SOUTH KOREA: MARKET, BY VEHICLE TYPE,  2023–2030 (USD MILLION)
             12.2.5 INDIA
                       12.2.5.1 Increase in sales of SUVs with ADAS features to drive market
                                   TABLE 125 INDIA: AUTOMOTIVE SMART ANTENNA MARKET, BY VEHICLE TYPE,  2018–2022 (‘000 UNITS)
                                   TABLE 126 INDIA: MARKET, BY VEHICLE TYPE,  2023–2030 (‘000 UNITS)
                                   TABLE 127 INDIA: MARKET, BY VEHICLE TYPE,  2018–2022 (USD MILLION)
                                   TABLE 128 INDIA: MARKET, BY VEHICLE TYPE,  2023–2030 (USD MILLION)
             12.2.6 REST OF ASIA PACIFIC
                       TABLE 129 REST OF ASIA PACIFIC: MARKET, BY VEHICLE TYPE,  2018–2022 (‘000 UNITS)
                       TABLE 130 REST OF ASIA PACIFIC: MARKET, BY VEHICLE TYPE,  2023–2030 (‘000 UNITS)
                       TABLE 131 REST OF ASIA PACIFIC: MARKET, BY VEHICLE TYPE,  2018–2022 (USD MILLION)
                       TABLE 132 REST OF ASIA PACIFIC: MARKET, BY VEHICLE TYPE,  2023–2030 (USD MILLION)
     12.3 EUROPE 
             12.3.1 RECESSION IMPACT
                       TABLE 133 EUROPE: MARKET, BY COUNTRY,  2018–2022 (‘000 UNITS)
                       TABLE 134 EUROPE: MARKET, BY COUNTRY,  2023–2030 (‘000 UNITS)
                       TABLE 135 EUROPE: MARKET, BY COUNTRY,  2018–2022 (USD MILLION)
                       TABLE 136 EUROPE: MARKET, BY COUNTRY,  2023–2030 (USD MILLION)
             12.3.2 GERMANY
                       12.3.2.1 OEMs offering premium cars to drive market
                                   TABLE 137 GERMANY: AUTOMOTIVE SMART ANTENNA MARKET, BY VEHICLE TYPE,  2018–2022 (‘000 UNITS)
                                   TABLE 138 GERMANY: MARKET, BY VEHICLE TYPE,  2023–2030 (‘000 UNITS)
                                   TABLE 139 GERMANY: MARKET, BY VEHICLE TYPE,  2018–2022 (USD MILLION)
                                   TABLE 140 GERMANY: MARKET, BY VEHICLE TYPE,  2023–2030 (USD MILLION)
             12.3.3 FRANCE
                       12.3.3.1 Rise in focus on road safety to drive market
                                   TABLE 141 FRANCE: MARKET, BY VEHICLE TYPE,  2018–2022 (‘000 UNITS)
                                   TABLE 142 FRANCE: MARKET, BY VEHICLE TYPE,  2023–2030 (‘000 UNITS)
                                   TABLE 143 FRANCE: MARKET, BY VEHICLE TYPE,  2018–2022 (USD MILLION)
                                   TABLE 144 FRANCE: MARKET, BY VEHICLE TYPE,  2023–2030 (USD MILLION)
             12.3.4 UK
                       12.3.4.1 Consumer preference for luxury vehicles to drive market
                                   TABLE 145 UK: AUTOMOTIVE SMART ANTENNA MARKET, BY VEHICLE TYPE, 2018–2022 (‘000 UNITS)
                                   TABLE 146 UK: MARKET, BY VEHICLE TYPE, 2023–2030 (‘000 UNITS)
                                   TABLE 147 UK: MARKET, BY VEHICLE TYPE,  2018–2022 (USD MILLION)
                                   TABLE 148 UK: MARKET, BY VEHICLE TYPE,  2023–2030 (USD MILLION)
             12.3.5 SPAIN
                       12.3.5.1 Increasing popularity of connected car features to drive market
                                   TABLE 149 SPAIN: MARKET, BY VEHICLE TYPE,  2018–2022 (‘000 UNITS)
                                   TABLE 150 SPAIN: MARKET, BY VEHICLE TYPE,  2023–2030 (‘000 UNITS)
                                   TABLE 151 SPAIN: MARKET, BY VEHICLE TYPE,  2018–2022 (USD MILLION)
                                   TABLE 152 SPAIN: MARKET, BY VEHICLE TYPE,  2023–2030 (USD MILLION)
             12.3.6 ITALY
                       12.3.6.1 Demand for advanced traffic information systems to drive market
                                   TABLE 153 ITALY: AUTOMOTIVE SMART ANTENNA MARKET, BY VEHICLE TYPE,  2018–2022 (‘000 UNITS)
                                   TABLE 154 ITALY: MARKET, BY VEHICLE TYPE,  2023–2030 (‘000 UNITS)
                                   TABLE 155 ITALY: MARKET, BY VEHICLE TYPE,  2018–2022 (USD MILLION)
                                   TABLE 156 ITALY: MARKET, BY VEHICLE TYPE,  2023–2030 (USD MILLION)
             12.3.7 REST OF EUROPE
                       TABLE 157 REST OF EUROPE: MARKET, BY VEHICLE TYPE,  2018–2022 (‘000 UNITS)
                       TABLE 158 REST OF EUROPE: MARKET, BY VEHICLE TYPE,  2023–2030 (‘000 UNITS)
                       TABLE 159 REST OF EUROPE: MARKET, BY VEHICLE TYPE,  2018–2022 (USD MILLION)
                       TABLE 160 REST OF EUROPE: MARKET, BY VEHICLE TYPE,  2023–2030 (USD MILLION)
     12.4 NORTH AMERICA 
             12.4.1 RECESSION IMPACT
                       FIGURE 39 NORTH AMERICA: AUTOMOTIVE SMART ANTENNA MARKET SNAPSHOT
                       FIGURE 40 NORTH AMERICA: MARKET, BY COUNTRY,  2023 VS. 2030 (USD MILLION)
                       TABLE 161 NORTH AMERICA: MARKET, BY COUNTRY,  2018–2022 (‘000 UNITS)
                       TABLE 162 NORTH AMERICA: MARKET, BY COUNTRY,  2023–2030 (‘000 UNITS)
                       TABLE 163 NORTH AMERICA: MARKET, BY COUNTRY,  2018–2022 (USD MILLION)
                       TABLE 164 NORTH AMERICA: MARKET, BY COUNTRY,  2023–2030 (USD MILLION)
             12.4.2 US
                       12.4.2.1 In-car infotainment systems as options in low- to mid-segment vehicles to drive market
                                   TABLE 165 US: AUTOMOTIVE SMART ANTENNA MARKET, BY VEHICLE TYPE, 2018–2022 (’000 UNITS)
                                   TABLE 166 US: MARKET, BY VEHICLE TYPE, 2023–2030 (‘000 UNITS)
                                   TABLE 167 US: MARKET, BY VEHICLE TYPE,  2018–2022 (USD MILLION)
                                   TABLE 168 US: MARKET, BY VEHICLE TYPE,  2023–2030 (USD MILLION)
             12.4.3 CANADA
                       12.4.3.1 Government regulations for driver safety to drive market
                                   TABLE 169 CANADA: MARKET, BY VEHICLE TYPE,  2018–2022 (‘000 UNITS)
                                   TABLE 170 CANADA: MARKET, BY VEHICLE TYPE,  2023–2030 (‘000 UNITS)
                                   TABLE 171 CANADA: MARKET, BY VEHICLE TYPE,  2018–2022 (USD MILLION)
                                   TABLE 172 CANADA: MARKET, BY VEHICLE TYPE,  2023–2030 (USD MILLION)
             12.4.4 MEXICO
                       12.4.4.1 Increase in demand for trucks to drive market
                                   TABLE 173 MEXICO: AUTOMOTIVE SMART ANTENNA MARKET, BY VEHICLE TYPE,  2018–2022 (‘000 UNITS)
                                   TABLE 174 MEXICO: MARKET, BY VEHICLE TYPE,  2023–2030 (‘000 UNITS)
                                   TABLE 175 MEXICO: MARKET, BY VEHICLE TYPE,  2018–2022 (USD MILLION)
                                   TABLE 176 MEXICO: MARKET, BY VEHICLE TYPE,  2023–2030 (USD MILLION)
     12.5 REST OF THE WORLD (ROW) 
               FIGURE 41 ROW: MARKET, BY COUNTRY,  2023–2030 (USD MILLION)
               TABLE 177 ROW: MARKET, BY COUNTRY, 2018–2022 (‘000 UNITS)
               TABLE 178 ROW: MARKET, BY COUNTRY, 2023–2030 (‘000 UNITS)
               TABLE 179 ROW: MARKET, BY COUNTRY, 2018–2022 (USD MILLION)
               TABLE 180 ROW: MARKET, BY COUNTRY, 2023–2030 (USD MILLION)
             12.5.1 BRAZIL
                       12.5.1.1 Rise in sales of ethanol-based vehicles to drive market
                                   TABLE 181 BRAZIL: AUTOMOTIVE SMART ANTENNA MARKET, BY VEHICLE TYPE,  2018–2022 (‘000 UNITS)
                                   TABLE 182 BRAZIL: MARKET, BY VEHICLE TYPE,  2023–2030 (‘000 UNITS)
                                   TABLE 183 BRAZIL: MARKET, BY VEHICLE TYPE,  2018–2022 (USD MILLION)
                                   TABLE 184 BRAZIL: MARKET, BY VEHICLE TYPE,  2023–2030 (USD MILLION)
             12.5.2 IRAN
                       12.5.2.1 Innovations in smart antenna technology to drive market
                                   TABLE 185 IRAN: MARKET, BY VEHICLE TYPE,  2018–2022 (‘000 UNITS)
                                   TABLE 186 IRAN: MARKET, BY VEHICLE TYPE,  2023–2030 (‘000 UNITS)
                                   TABLE 187 IRAN: MARKET, BY VEHICLE TYPE,  2018–2022 (USD MILLION)
                                   TABLE 188 IRAN: MARKET, BY VEHICLE TYPE,  2023–2030 (USD MILLION)
             12.5.3 OTHER COUNTRIES
                       TABLE 189 OTHER COUNTRIES: AUTOMOTIVE SMART ANTENNA MARKET, BY VEHICLE TYPE,  2018–2022 (‘000 UNITS)
                       TABLE 190 OTHER COUNTRIES: MARKET, BY VEHICLE TYPE,  2023–2030 (‘000 UNITS)
                       TABLE 191 OTHER COUNTRIES: MARKET, BY VEHICLE TYPE,  2018–2022 (USD MILLION)
                       TABLE 192 OTHER COUNTRIES: MARKET, BY VEHICLE TYPE,  2023–2030 (USD MILLION)
 
13 COMPETITIVE LANDSCAPE (Page No. - 194)
     13.1 OVERVIEW 
     13.2 REVENUE ANALYSIS OF TOP LISTED/PUBLIC PLAYERS 
               FIGURE 42 REVENUE ANALYSIS OF TOP LISTED/PUBLIC PLAYERS, 2020–2022
     13.3 KEY PLAYERS’ STRATEGIES/RIGHT TO WIN, 2021–2023 
               TABLE 193 STRATEGIES ADOPTED BY KEY PLAYERS FROM 2021 TO 2023
     13.4 AUTOMOTIVE SMART ANTENNA MARKET SHARE ANALYSIS, 2022 
               TABLE 194 DEGREE OF COMPETITION, 2022
               FIGURE 43 MARKET SHARE, 2022
     13.5 COMPANY EVALUATION MATRIX 
             13.5.1 STARS
             13.5.2 EMERGING LEADERS
             13.5.3 PERVASIVE PLAYERS
             13.5.4 PARTICIPANTS
                       FIGURE 44 MARKET: COMPANY EVALUATION MATRIX, 2022
             13.5.5 COMPANY FOOTPRINT
                       TABLE 195 MARKET: COMPANY PRODUCT FOOTPRINT, 2022
                       TABLE 196 MARKET: COMPANY VEHICLE TYPE FOOTPRINT, 2022
                       TABLE 197 MARKET: COMPANY REGION FOOTPRINT, 2022
     13.6 COMPETITIVE SCENARIO 
             13.6.1 PRODUCT DEVELOPMENTS
                       TABLE 198 PRODUCT DEVELOPMENTS, 2022–2023
             13.6.2 DEALS
                       TABLE 199 DEALS, 2021–2023
 
14 COMPANY PROFILES (Page No. - 206)
     14.1 KEY PLAYERS 
(Business Overview, Products/Services/Solutions Offered, MnM View, Key Strengths and Right to Win, Strategic Choices Made, Weaknesses and Competitive Threats, Recent Developments)*
             14.1.1 CONTINENTAL AG
                       TABLE 200 CONTINENTAL AG: COMPANY OVERVIEW
                       FIGURE 45 CONTINENTAL AG: COMPANY SNAPSHOT
                       TABLE 201 CONTINENTAL AG: PRODUCTS OFFERED
                       TABLE 202 CONTINENTAL AG: DEALS
             14.1.2 DENSO CORPORATION
                       TABLE 203 DENSO CORPORATION: COMPANY OVERVIEW
                       FIGURE 46 DENSO CORPORATION: COMPANY SNAPSHOT
                       TABLE 204 DENSO CORPORATION: PRODUCTS OFFERED
                       TABLE 205 DENSO CORPORATION: PRODUCT DEVELOPMENTS
                       TABLE 206 DENSO CORPORATION: DEALS
             14.1.3 FORVIA
                       TABLE 207 FORVIA: COMPANY OVERVIEW
                       FIGURE 47 FORVIA: COMPANY SNAPSHOT
                       TABLE 208 FORVIA: PRODUCTS OFFERED
                       TABLE 209 FORVIA: DEALS
             14.1.4 TE CONNECTIVITY
                       TABLE 210 TE CONNECTIVITY: COMPANY OVERVIEW
                       FIGURE 48 TE CONNECTIVITY: COMPANY SNAPSHOT
                       TABLE 211 TE CONNECTIVITY: PRODUCTS OFFERED
                       TABLE 212 TE CONNECTIVITY: PRODUCT DEVELOPMENTS
                       TABLE 213 TE CONNECTIVITY: DEALS
             14.1.5 FICOSA INTERNACIONAL SA
                       TABLE 214 FICOSA INTERNACIONAL SA: COMPANY OVERVIEW
                       FIGURE 49 FICOSA INTERNACIONAL SA: COMPANY SNAPSHOT
                       FIGURE 50 FICOSA INTERNACIONAL SA: INTEGRATED SERVICE CAPABILITIES WITHIN VEHICLE
                       FIGURE 51 FICOSA INTERNACIONAL SA: ANTENNA LOCATIONS WITHIN VEHICLE
                       TABLE 215 FICOSA INTERNACIONAL SA: PRODUCTS OFFERED
             14.1.6 HARADA INDUSTRY CO., LTD.
                       TABLE 216 HARADA INDUSTRY CO., LTD.: COMPANY OVERVIEW
                       FIGURE 52 HARADA INDUSTRY CO., LTD.: COMPANY SNAPSHOT
                       TABLE 217 HARADA INDUSTRY CO., LTD.: PRODUCTS OFFERED
             14.1.7 KATHREIN SOLUTIONS GMBH
                       TABLE 218 KATHREIN SOLUTIONS GMBH: COMPANY OVERVIEW
                       TABLE 219 KATHREIN SOLUTIONS GMBH: PRODUCTS OFFERED
             14.1.8 ROBERT BOSCH GMBH
                       TABLE 220 ROBERT BOSCH GMBH: COMPANY OVERVIEW
                       FIGURE 53 ROBERT BOSCH GMBH: COMPANY SNAPSHOT
                       TABLE 221 ROBERT BOSCH GMBH: PRODUCTS OFFERED
                       TABLE 222 ROBERT BOSCH GMBH: DEALS
             14.1.9 LAIRD CONNECTIVITY
                       TABLE 223 LAIRD CONNECTIVITY: COMPANY OVERVIEW
                       TABLE 224 LAIRD CONNECTIVITY: PRODUCTS OFFERED
             14.1.10 YOKOWO CO., LTD.
                       TABLE 225 YOKOWO CO., LTD.: COMPANY OVERVIEW
                       FIGURE 54 YOKOWO CO., LTD.: COMPANY SNAPSHOT
                       TABLE 226 YOKOWO CO., LTD.: PRODUCTS OFFERED
*Business Overview, Products/Services/Solutions Offered, MnM View, Key Strengths and Right to Win, Strategic Choices Made, Weaknesses and Competitive Threats, Recent Developments might not be captured in case of unlisted companies.
     14.2 OTHER PLAYERS 
             14.2.1 SCHAFFNER HOLDING AG
                       TABLE 227 SCHAFFNER HOLDING AG: COMPANY OVERVIEW
             14.2.2 HIRSCHMANN CAR COMMUNICATION GMBH
                       TABLE 228 HIRSCHMANN CAR COMMUNICATION GMBH: COMPANY OVERVIEW
             14.2.3 HARMAN INTERNATIONAL
                       TABLE 229 HARMAN INTERNATIONAL: COMPANY OVERVIEW
             14.2.4 TAOGLAS LTD.
                       TABLE 230 TAOGLAS LTD.: COMPANY OVERVIEW
             14.2.5 AIRGAIN
                       TABLE 231 AIRGAIN: COMPANY OVERVIEW
             14.2.6 INPAQ TECHNOLOGY CO., LTD.
                       TABLE 232 INPAQ TECHNOLOGY CO., LTD.: COMPANY OVERVIEW
             14.2.7 ANOKIWAVE, INC.
                       TABLE 233 ANOKIWAVE, INC.: COMPANY OVERVIEW
             14.2.8 CALEARO ANTENNE SPA
                       TABLE 234 CALEARO ANTENNE SPA: COMPANY OVERVIEW
             14.2.9 ANTENOVA LTD.
                       TABLE 235 ANTENOVA LTD.: COMPANY OVERVIEW
             14.2.10 YAGEO GROUP
                       TABLE 236 YAGEO GROUP: COMPANY OVERVIEW
 
15 RECOMMENDATIONS (Page No. - 245)
     15.1 ASIA PACIFIC TO DOMINATE AUTOMOTIVE SMART ANTENNA MARKET 
     15.2 CONFORMAL ANTENNAS FOR FUTURE APPLICATIONS: KEY FOCUS AREA 
     15.3 V2X FOR FUTURE APPLICATIONS: KEY FOCUS AREA 
     15.4 CONCLUSION 
 
16 APPENDIX (Page No. - 248)
     16.1 INSIGHTS OF INDUSTRY EXPERTS 
     16.2 DISCUSSION GUIDE 
     16.3 KNOWLEDGESTORE: MARKETSANDMARKETS’  SUBSCRIPTION PORTAL 
     16.4 CUSTOMIZATION OPTIONS 
             16.4.1 AUTOMOTIVE SMART ANTENNA MARKET,  BY FREQUENCY AND COUNTRY
                       16.4.1.1 Asia Pacific
                                   16.4.1.1.1 China
                                   16.4.1.1.2 India
                                   16.4.1.1.3 Japan
                                   16.4.1.1.4 South Korea
                                   16.4.1.1.5 Rest of Asia Pacific
                       16.4.1.2 Europe
                                   16.4.1.2.1 Germany
                                   16.4.1.2.2 France
                                   16.4.1.2.3 UK
                                   16.4.1.2.4 Spain
                                   16.4.1.2.5 Italy
                                   16.4.1.2.6 Rest of Europe
                       16.4.1.3 North America
                                   16.4.1.3.1 US
                                   16.4.1.3.2 Canada
                                   16.4.1.3.3 Mexico
                       16.4.1.4 RoW
                                   16.4.1.4.1 Brazil
                                   16.4.1.4.2 Iran
                                   16.4.1.4.3 Others
             16.4.2 AUTOMOTIVE SMART ANTENNA MARKET, BY TYPE AND COUNTRY
                       16.4.2.1 Asia Pacific
                                   16.4.2.1.1 China
                                   16.4.2.1.2 India
                                   16.4.2.1.3 Japan
                                   16.4.2.1.4 South Korea
                                   16.4.2.1.5 Rest of Asia Pacific
                       16.4.2.2 Europe
                                   16.4.2.2.1 Germany
                                   16.4.2.2.2 France
                                   16.4.2.2.3 UK
                                   16.4.2.2.4 Spain
                                   16.4.2.2.5 Italy
                                   16.4.2.2.6 Rest of Europe
                       16.4.2.3 North America
                                   16.4.2.3.1 US
                                   16.4.2.3.2 Canada
                                   16.4.2.3.3 Mexico
                       16.4.2.4 RoW
                                   16.4.2.4.1 Brazil
                                   16.4.2.4.2 Iran
                                   16.4.2.4.3 Others
             16.4.3 DETAILED ANALYSIS AND PROFILING OF ADDITIONAL MARKET PLAYERS (UP TO 3)
     16.5 RELATED REPORTS 
     16.6 AUTHOR DETAILS 

Various secondary sources, directories, and databases have been used to identify and collect information for an extensive automotive smart antenna market study. The study involved four main activities in estimating the current size of the automotive smart antenna market: secondary research, validation through primary research, assumptions, and market analysis. Exhaustive secondary research was carried out to collect information on the market, such as the antenna type and the upcoming technologies and trends. The next step was to validate these findings, assumptions, and market analysis with industry experts across the value chain through primary research. The top-down approach was employed to estimate the complete market size for different segments considered in this study.

Secondary Research

In the secondary research process, various secondary sources have been used to identify and collect information useful for an extensive commercial study of the automotive smart antenna market. Secondary sources include company annual reports/presentations, press releases, industry association publications [such as publications on vehicle sales, EEA (European Energy Agency), IEA (International Energy Agency), ACEA (European Automobile Manufacturers Association), T&E (Transport and Environment), country-level automotive associations and trade organizations, and the US Department of Transportation (DOT)], Automotive smart antenna related magazine articles, directories, technical handbooks, World Economic Outlook, trade websites, and technical articles. Additionally, secondary research has been carried out to understand the average cost of automotive smart antennas equipped in each vehicle type and the historical sales of vehicles.

Primary Research

In the primary research process, various primary sources from both the supply and demand sides were interviewed to obtain qualitative and quantitative information on the market. The primary sources from the supply side included industry experts such as CXOs, vice presidents, directors from business development, marketing, product development/innovation teams, and related key executives from various key companies. Various system integrators, industry associations, independent consultants/industry veterans, and key opinion leaders were also interviewed.

In the primary research process, various primary sources from both the supply and demand sides have been interviewed to obtain qualitative and quantitative information for this report. The primary sources from the supply side include industry experts such as research and development experts, CEOs, CTOs, COOS, vice presidents, marketing directors, technology and innovation directors, and related key executives from different key companies operating in the automotive smart antenna market.

After the complete market engineering, which includes calculations for market statistics, market breakdown, market size estimations, market forecasting, and data triangulation, extensive primary research has been conducted to gather information and verify and validate the critical numbers arrived at. Primary research has also been conducted to identify and validate the segmentation, industry trends, key players, competitive landscape, and market dynamics, such as drivers, restraints, opportunities, challenges, industry trends, and key strategies. Extensive qualitative and quantitative analysis has been performed on the complete market engineering process to list key information/insights throughout the report.

After interacting with industry experts, we have also conducted brief sessions with highly experienced independent consultants to reinforce the findings from our primaries. This, along with the in-house subject matter expert’s opinions, has led us to the findings described in this report's remainder.

Automotive Smart Antenna Market Size, and Share

To know about the assumptions considered for the study, download the pdf brochure

Market Size Estimation

A detailed market estimation approach was followed to estimate and validate the value of the automotive smart antenna market and other dependent submarkets, as mentioned below:

  • Key players in the automotive smart antenna market were identified through secondary research, and their global market shares were determined through primary and secondary research.
  • The research methodology included the study of annual and quarterly financial reports, regulatory filings of major market players (public), and interviews with industry experts for detailed market insights.
  • All industry-level penetration rates, percentage shares, splits, and breakdowns for the automotive smart antenna market were determined using secondary sources and verified through primary sources.
  • All key macro indicators affecting the revenue growth of the market segments and sub-segments have been accounted for, viewed in extensive detail, verified through primary research, and analyzed to get the validated and verified quantitative and qualitative data.
  • The gathered market data was consolidated and added with detailed inputs, analyzed, and presented in this report.

Automotive Smart Antenna Market: Bottom-Up Approach

Automotive Smart Antenna Market Size, and Share

To know about the assumptions considered for the study, Request for Free Sample Report

Automotive Smart Antenna Market: Top-Down Approach

  • The top-down approach has been used to estimate and validate the size of the automotive smart antenna market, by frequency. The market share of each technology was derived at the regional level through secondary research & insights from industry experts. Further, the market was segmented based on market share for each frequency type at a regional level. A similar approach is used in EVs type, Type, and component type segments.

Top-Down Approach Automotive Smart Antenna Market For Frequency At The Regional Level

Automotive Smart Antenna Market Size, and Share

Bottom-Up Approach Automotivesmart Antenna By Type At Regional Level

Automotive Smart Antenna Market Size, and Share

Data Triangulation

The market was split into several segments and sub-segments after arriving at the overall market size—using the market size estimation processes as explained above. Where applicable, data triangulation and market breakdown procedures were employed to complete the overall market engineering process and arrive at the exact statistics of each market segment and sub-segment. The data was triangulated by studying various factors and trends.

Market Definition

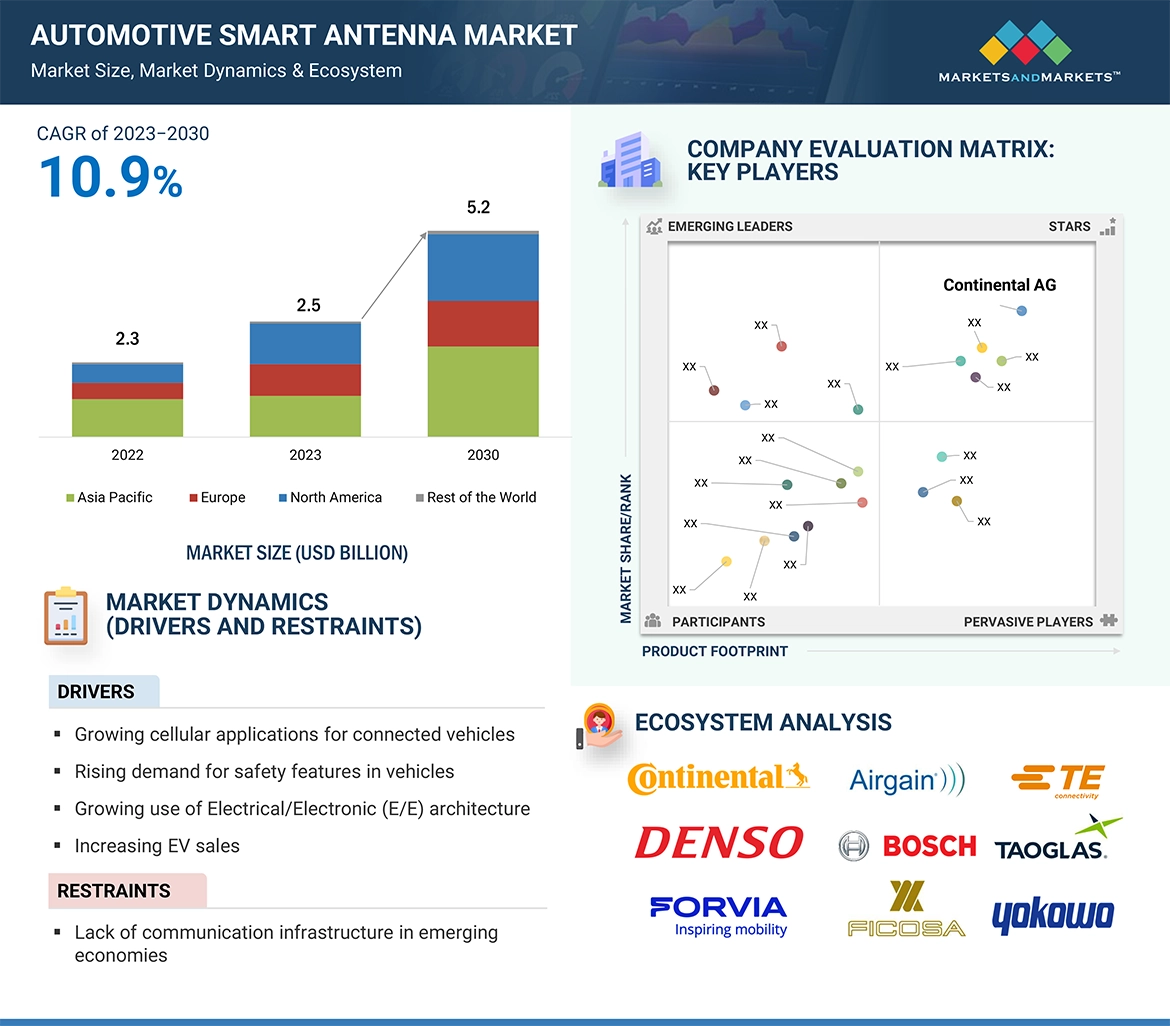
Smart antennas utilize sophisticated signal processing techniques to improve V2V communication performance. They can dynamically adjust the radiation pattern towards the intended receiver, optimizing signal strength while minimizing interference. The adaptive beamforming features of smart antennas facilitate precise communication, particularly in challenging scenarios characterized by obstacles or signal fading. Its features include 4G (LTE)/5G, GPS, passive key entry, tire pressure monitoring system (TPMS), in-build Wi-Fi system, radio/FM, digital audio broadcasting and C-V2X. These features are used for high-speed data transfer, e-call, telematics systems, navigation systems, and to increase vehicle safety.
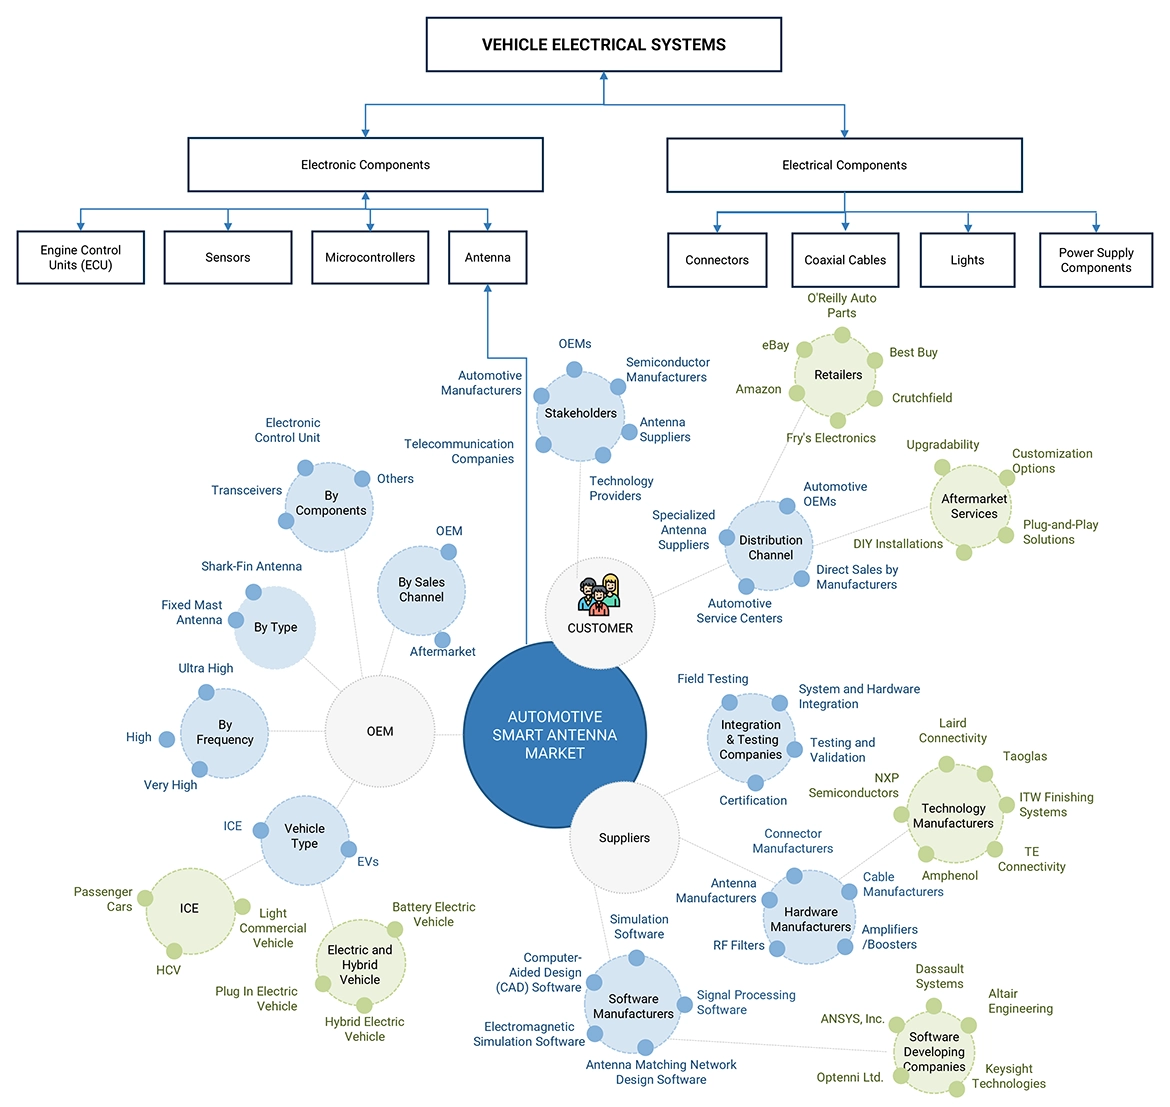
Stakeholders

  • Automotive smart antenna manufacturers
  • Automotive electronic component and software suppliers
  • Automotive original equipment manufacturers (OEMs)
  • Government regulatory bodies
  • Telecommunication companies
  • Automotive testing and certification services
  • Automotive aftermarket suppliers
  • Fleet management companies
  • Satellite communication providers
  • Insurance companies
  • Cybersecurity firms

Report Objectives

  • To define, describe, and forecast the automotive smart antenna market, in terms of value
    (USD million), based on the following segments:
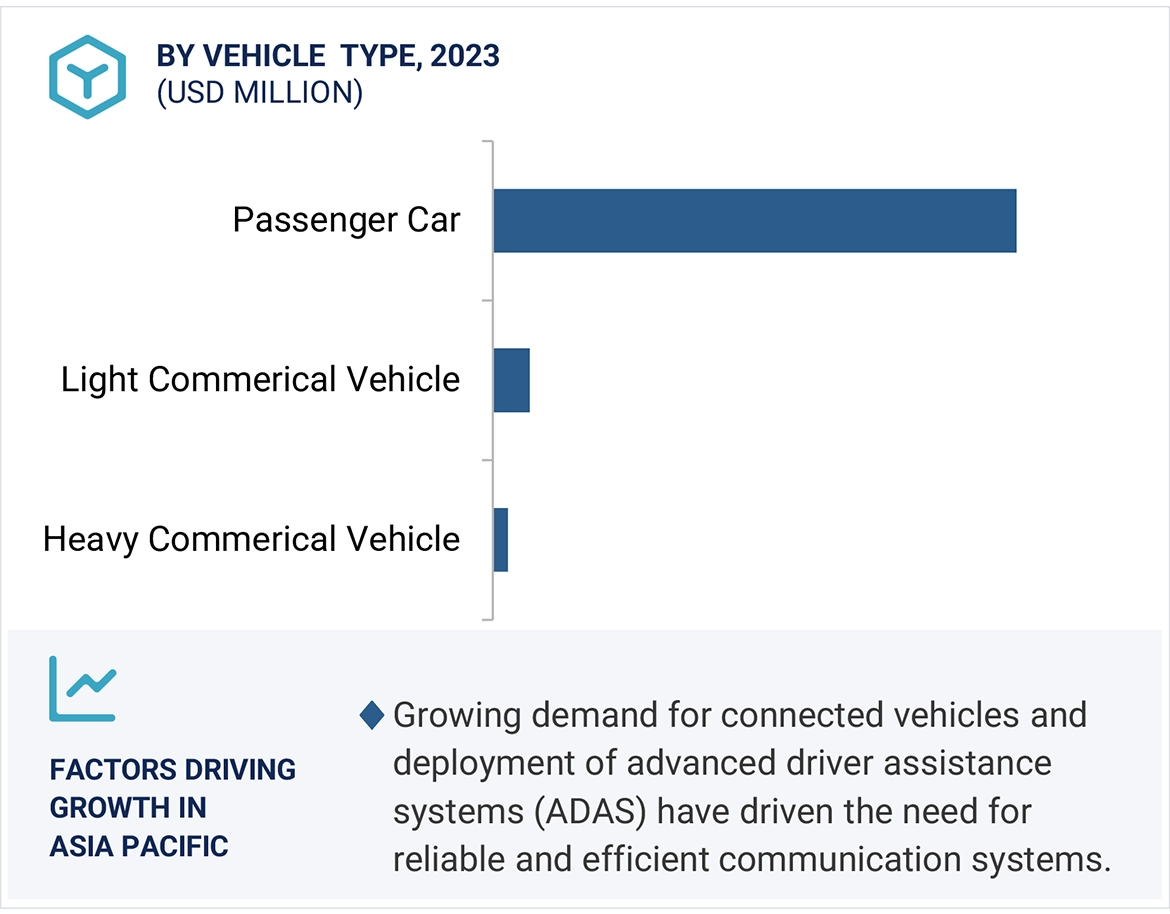
  • Vehicle Type ((Passenger Car, Light Commercial Vehicle (LCV), and Heavy Commercial Vehicle (HCV))
  • Frequency (High, Very High, and Ultra High)
  • Type (Shark-Fin Antenna and Fixed Mast Antenna)
  • Component Type ((Transceiver, Electronic Control Unit (ECU), and Others (Connector, Wire Harness, and Digital Bus))
  • Sales Channel (OEMs and Aftermarket) (qualitative data only)
  • Electric Vehicle (EV) Type (Battery Electric Vehicle (BEV), Plug-in Hybrid Vehicle (PHEV), and Fuel-cell Electric Vehicle (FCEV))
  • Region ((Asia Pacific, Europe, North America, and Rest of the World (RoW))
  • To understand the market dynamics (Drivers, Restraints, Opportunities, and Challenges) and conduct Patent Analysis, Pricing Analysis, Recession Impact, Key Buying Criteria, Trade Analysis, Technology Analysis, ASP Analysis, Trades and Conferences, Case Study Analysis, Supply Chain Analysis, Regulatory Analysis, Key Conference and Events, and Ecosystem Mapping
  • To understand the dynamics of the market players and distinguish them into stars, emerging leaders, pervasive players, and participants according to their product portfolio strength and business strategies.
  • To strategically analyze markets with respect to individual growth trends, prospects, and contributions to the total market
  • To analyze recent developments, such as partnerships, supply agreements, joint ventures/mergers and acquisitions, geographic expansions, and product developments of key players in the market

Available Customizations

Along with the market data, MarketsandMarkets offers customizations in accordance with company-specific needs.

The following customization options are available for the report:

Automotive Smart Antenna Market, By Frequency And Country

  • Asia Pacific
  • North America
  • Europe
  • RoW

Note:- We can cover countries like US, Canada, and Mexico from North America; Germany, France, Italy, Spain, and UK from Europe; China, India, Japan, and South Korea from Asia Pacific region; and Brazil and Iran from Rest of the World.

Automotive Smart Antenna Market, By Type And Country

  • Asia Pacific
  • North America
  • Europe
  • RoW

Note:- We can cover countries like US, Canada, and Mexico from North America; Germany, France, Italy, Spain, and UK from Europe; China, India, Japan, and South Korea from Asia Pacific region; and Brazil and Iran from Rest of the World.

Detailed Analysis And Profiling Of Additional Market Players (Up To 3)

Custom Market Research Services

We will customize the research for you, in case the report listed above does not meet with your exact requirements. Our custom research will comprehensively cover the business information you require to help you arrive at strategic and profitable business decisions.

Request Customization
Report Code
AT 6721
Published ON
Jan, 2024
Choose License Type
BUY NOW
  • SHARE
X
Request Customization
Speak to Analyst
Speak to Analyst
OR FACE-TO-FACE MEETING
PERSONALIZE THIS RESEARCH
  • Triangulate with your Own Data
  • Get Data as per your Format and Definition
  • Gain a Deeper Dive on a Specific Application, Geography, Customer or Competitor
  • Any level of Personalization
REQUEST A FREE CUSTOMIZATION
LET US HELP YOU!
  • What are the Known and Unknown Adjacencies Impacting the Automotive Smart Antenna Market
  • What will your New Revenue Sources be?
  • Who will be your Top Customer; what will make them switch?
  • Defend your Market Share or Win Competitors
  • Get a Scorecard for Target Partners
CUSTOMIZED WORKSHOP REQUEST
+1-888-600-6441
  • Call Us
  • +1-888-600-6441 (Corporate office hours)
  • +1-888-600-6441 (US/Can toll free)
  • +44-800-368-9399 (UK office hours)
CONNECT WITH US
ABOUT TRUST ONLINE
©2024 MarketsandMarkets Research Private Ltd. All rights reserved
DMCA.com Protection Status Website Feedback