Biopsy Devices Market

Biopsy Devices Market by Product (Core Needle Biopsy, Aspiration Biopsy, Vacuum Assisted Biopsy), Application (Breast Biopsy, Lung Biopsy, Prostate Biopsy), Guidance (Stereotactic, Ultrasound), End User (Hospital) & Region - Global Forecast to 2028

Report Code: MD 5504 Oct, 2023, by marketsandmarkets.com

Updated on : Aug 22, 2024

The global biopsy devices market in terms of revenue was estimated to be worth $6.6 billion in 2023 and is poised to reach $12.6 billion by 2028, growing at a CAGR of 14.0% from 2023 to 2028. The new research study consists of an industry trend analysis of the market. The new research study consists of industry trends, pricing analysis, patent analysis, conference and webinar materials, key stakeholders, and buying behaviour in the market. The increasing patient population, rising prevalence of target diseases, and rising focus on accurate procedures are expected to drive the market during the forecast period.

Global Biopsy Devices Market Trends

Biopsy Devices Market

To know about the assumptions considered for the study, Request for Free Sample Report

Biopsy Devices Market

e- Estimated; p- Projected

Biopsy devices Market Dynamics

Driver: Rising prevalence of cancer

Globally, there has been a significant increase in the number of people suffering from cancer. According to the GLOBOCAN’s estimates, the number of people suffering from cancer is expected to increase to 19.3 million by 2025 from 19.3 million in 2020. Cancer is the second leading cause of death in the US and accounts for nearly 1 in every 4 deaths. According to the American Cancer Society, in the US, 1,688,780 new cancer cases (excluding carcinoma in situ of any site) are expected to be diagnosed in 2017, and the total number of cancer-related deaths is expected to be 600,920 in the same year; this figure corresponds to ~1,650 deaths per day.

The incidence rates of cancer remain highest in the more-developed regions; however, the mortality is relatively higher in the less-developed countries due to limited access to treatment facilities and lack of awareness regarding the benefits of early detection. According to the GLOBOCAN 2012, about 56.8% of all new cancer cases and 10 million of all cancer deaths in 2020 occurred worldwide. GLOBOCAN predicts that the number of cancer cases will increase to 28.4 million in 2040. The mortality ratio was the highest in China (70.2%), followed by India (69.1%). These proportions are expected to increase further by 2025. The increasing number of cancer patients will lead to an increase in the number of biopsy procedures to diagnose malignant and benign cancer which is expected to drive the growth of market.

In 2022, the geriatric population affected with cancer accounted for 47.5% of cancer cases; this percentage is expected to reach 54.6% in 2030. The rapid growth in the geriatric population and the growing prevalence of cancer in this population is expected to increase the demand for biopsy procedures subsequently. The global shift towards an aging population is poised to exert a significant impact on cancer control efforts worldwide, given the higher incidence of cancer among elderly individuals. The pace of population aging is accelerating, with a current count of more than 703 million individuals worldwide aged 65 and above, constituting 9.1% of the global populace. This demographic transformation underscores the increasing importance of addressing cancer as a critical public health concern, particularly in the context of an aging society. By the year 2050, it is projected that the incidence of cancer among individuals aged 85 and above will experience a fourfold rise. ( Source:ons.org)

Restraint: Risk of infections

Biopsy procedures assist radiologists and surgeons in examining abnormalities at a particular site. However, patients can be infected during these procedures as they involve cuts and incisions for removing tissue samples. According to an article published in The Journal of Urology 2014 (Official Journal of the American Urology Association), the incidence of severe post-prostate biopsy infections is on the rise in Sweden. As per this study, the incidence of urinary tract infections was approximately 2%, which increased to 6% after 30 days of biopsy and 1% were hospitalized. The high risk of infections post biopsy procedures can hinder the growth of this market.

Opportunity: Technological Advancements

Continued innovation in biopsy device technology, such as improved imaging capabilities, robotics, and precision-guided biopsy tools, offers opportunities for more accurate and less invasive procedures. Advanced imaging techniques such as ultrasound, magnetic resonance imaging (MRI), and computed tomography (CT) scans have become integral in guiding biopsy procedures. For instance, real-time ultrasound imaging allows healthcare professionals to precisely target and extract tissue samples, minimizing the risk of complications.

  • Medtronic has introduced the StealthStation iO navigation system, a cutting-edge image-guided surgery platform suitable for a range of procedures, including image-guided biopsy. Leveraging artificial intelligence (AI), the StealthStation iO system enhances the precision and effectiveness of image-guided surgical interventions, significantly improving their accuracy and efficiency.
  • Hologic, a prominent provider of women's health and imaging solutions, unveiled its latest offering, the Affirm Breast Biopsy System, in September 2022. This advanced system is designed for minimally invasive breast biopsies and leverages 3D tomosynthesis for precise needle placement guidance. The Affirm system incorporates several innovative elements, such as an intelligent needle guide that automatically retracts upon tissue acquisition, thereby mitigating the potential for patient discomfort and procedural complications

The growth of liquid biopsy technologies, which enable the detection of cancer-related biomarkers in blood or other bodily fluids, presents significant growth potential for non-invasive cancer diagnosis and monitoring. Several companies are actively engaged in advancing liquid biopsy technologies. For instance, TrovaGene is in the process of developing a novel liquid biopsy test aimed at early colorectal cancer detection, while Natera is working on a liquid biopsy test for the early detection of ovarian cancer. These advancements have the capacity to enhance the precision, safety, and effectiveness of liquid biopsy tests. The realm of liquid biopsy is marked by continuous innovation, with new breakthroughs regularly emerging. This dynamic environment presents an exciting opportunity for those involved in the field, and I eagerly anticipate witnessing the future developments in liquid biopsy technology.

Challenge: Underdeveloped healthcare infrastructure and dearth of resources in developing countries

With the growing awareness about different types of cancers, the demand for biopsy procedures in developing countries is expected to increase in the coming years. Due to limited healthcare resources and underdeveloped infrastructure, alternative strategies for diagnosis of breast cancer are widely used in the region. Mortality caused due to breast cancer is also higher in low- and middle-income countries as compared to high-income countries. This is mainly due to the lack of early detection in these countries.

Although the incidence of cervical cancer has been increasing, the screening coverage in this region is very low. In Sub-Saharan Africa, it has been estimated that only 5% of the women at risk are screened for cancer. Likewise, in India, guidelines for population-based screening programs for cervical cancer have been established based on visual inspection tests. Despite these guidelines, the screening coverage in this country is very low. Various factors such as lack of trained practitioners, inadequate laboratory supplies, inappropriate physical access to treatment, and ethical and religious beliefs are negatively impacting the diagnosis of this condition. Inadequate healthcare resources and underdeveloped healthcare infrastructure thus present challenges to the growth of the market in developing countries.

Market Ecosystem

Biopsy Devices Market Ecosystem

By product, the Needle based biopsy instruments segment accounted for the largest share of the biopsy devices industry in 2022

Based on technology, the global biopsy devices market is segmented into needle-based biopsy instruments, localization wire, procedure tray, biopsy forceps, biopsy tables and others. In 2022, the needle-based biopsy instruments segment accounted for the largest market share. Needle biopsies are minimally invasive procedures that can be performed quickly and with relatively low patient discomfort, making them preferable for both patients and healthcare providers. Secondly, the rising incidence of cancer and the need for early diagnosis have increased the demand for tissue sampling, particularly for lesions that are difficult to access through traditional means.

By application, the breast biopsy applications segment of the biopsy devices industry to register significant growth in the near future

Based on application, the biopsy devices market is divided into breast, bone marrow, colorectal, lung, prostate and other applications. Major share of the segment is attributed to the increasing number of cancer cases and the growing use of biopsy devices for diagnosis purpose.

By end user, the hospitals and breast care centers segment accounted for the largest share of the biopsy devices industry in 2022

On the basis of end user, the biopsy devices market has been segmented into hospitals and breast care centers, diagnostic imaging centers; research and academic institutes; and other end users. However, the diagnostic imaging center segment is estimated to grow at the highest CAGR during the forecast period.

By region, North America is expected to be the largest market of the biopsy devices industry during the forecast period

North America, comprising the US and Canada, accounted for the largest market share of the biopsy devices industry in 2022. The faster growth of the biopsy devices imaging market in North America can be attributed to its technological leadership, robust healthcare infrastructure, high market demand driven by prevalent chronic diseases and an aging population, ample financial resources for advanced medical equipment investment, established regulatory frameworks ensuring safety and quality, active research collaboration, insurance coverage for advanced diagnostics, patient expectations for comprehensive care, and a competitive market environment fostering innovation.

Biopsy Devices Market by Region

To know about the assumptions considered for the study, download the pdf brochure

As of 2022, prominent players in the biopsy devices market are Becton, Dickinson and Company (US), Cook Group Incorporated (US), Devicor Medical Products, Inc., (Leica Biosystems) (Germany), Hologic, Inc. (US), Argon Medical Devices (US), B. Braun Melsungen AG (Germany), Cardinal Health, Inc. (US), Olympus Corporation (Japan), Boston Scientific Corporation (US), FUJIFILM Holdings Corporation (Japan), INRAD, Inc. (US), and Medtronic plc (Ireland).

Scope of the Biopsy Devices Industry:

Report Metric

Details

Market Revenue in 2023

$6.6 billion

Estimated Value by 2028

$12.6 billion

Revenue Rate

Poised to grow at a CAGR of 14.0%

Market Driver

Rising prevalence of cancer

Market Opportunity

Technological Advancements

This report has segmented the global biopsy devices market to forecast revenue and analyze trends in each of the following submarkets:

By Product

  • Needle Based Biopsy Instruments
  • Liquid Biopsy Instruments
  • Localization Wire
  • Biopsy Forceps
  • Procedure Tray
  • Biopsy Table
  • Other Biopsy Products

By Guidance Technique

  • Image Guided Biopsy
    • Ultrasound Guided Biopsy
    • Stereotactic Guided Biopsy
    • MRI Guided Biopsy
    • Other Biopsy
  • Non-Image Guided Biopsy
    • Liquid Biopsy
    • General Biopsy

By Application

  • Breast Cancer
  • Lung Cancer
  • Kidney Cancer
  • Prostate Cancer
  • Bone Marrow Biopsy
  • Other Applications

By End User

  • Hospitals and Breast Care Centers
  • Diagnostic Imaging Centers
  • Research and Academic Institutes
  • Other End Users

By Region

  • North America
    • US
    • Canada
  • Europe
    • Germany
    • France
    • UK
    • Italy
    • Spain
    • Rest of Europe
  • Asia Pacific
    • Japan
    • China
    • India
    • Australia
    • South Korea
    • Rest of Asia Pacific
  • Latin America
    • Brazil
    • Mexico
    • Rest of Latin America
  • Middle East and Africa

Recent Developments of Biopsy Devices Industry

  • In December 2022, Olympus entered into a definitive agreement, subsequently finalizing the acquisition of all outstanding shares of Odin Medical Ltd., a cloud-AI endoscopy company based in the UK. This acquisition was conducted through Olympus' UK subsidiary, Keymed (Medical & Industrial Equipment) Ltd.
  • In November 2021, B. Braun and REVA Medical announced the strategic partnership for the distribution of Fantom Encore - a bioresorbable scaffold for coronary interventions, manufactured with REVA's patented material Tyrocore. B. Braun will start active distribution of the products in Germany and Switzerland in November 2021, with additional countries to follow afterwards.

Frequently Asked Questions (FAQ):

To speak to our analyst for a discussion on the above findings, click Speak to Analyst

TABLE OF CONTENTS
 
1 INTRODUCTION (Page No. - 28)
    1.1 STUDY OBJECTIVES 
    1.2 MARKET DEFINITION 
           1.2.1 INCLUSIONS AND EXCLUSIONS
           1.2.2 MARKET SEGMENTATION
           1.2.3 YEARS CONSIDERED
           1.2.4 CURRENCY CONSIDERED
    1.3 STAKEHOLDERS 
    1.4 SUMMARY OF CHANGES 
    1.5 RECESSION IMPACT 
 
2 RESEARCH METHODOLOGY (Page No. - 32)
    2.1 RESEARCH DATA 
          FIGURE 1 RESEARCH DESIGN
           2.1.1 SECONDARY RESEARCH
           2.1.2 PRIMARY RESEARCH
                    2.1.2.1 Primary sources
                    2.1.2.2 Key industry insights
                    2.1.2.3 Breakdown of primaries
                                FIGURE 2 BREAKDOWN OF PRIMARY INTERVIEWS: SUPPLY AND DEMAND-SIDE PARTICIPANTS
                                FIGURE 3 BREAKDOWN OF PRIMARY INTERVIEWS: BY COMPANY TYPE, DESIGNATION,  AND REGION
    2.2 MARKET SIZE ESTIMATION METHODOLOGY 
          FIGURE 4 RESEARCH METHODOLOGY: HYPOTHESIS BUILDING
           2.2.1 BOTTOM-UP APPROACH
                    2.2.1.1 Approach 1: Company revenue estimation approach
                                FIGURE 5 MARKET SIZE ESTIMATION FOR NEEDLE-BASED BIOPSY DEVICES AND ACCESSORY MARKET
          FIGURE 6 MARKET SIZE ESTIMATION FOR LIQUID BIOPSY APPROACH 1  (COMPANY REVENUE ESTIMATION)
                                FIGURE 7 REVENUE SHARE ANALYSIS: ILLUSTRATIVE EXAMPLE OF BECTON, DICKINSON, AND COMPANY
                    2.2.1.2 Approach 2: Customer-based market estimation
                    2.2.1.3 Top-down approach of biopsy devices market
                    2.2.1.4 Approach 3: CAGR projections
                               FIGURE 8 CAGR PROJECTIONS: SUPPLY-SIDE ANALYSIS
           2.2.2 END USER-BASED MARKET SIZE ESTIMATION
                    FIGURE 9 BIOPSY DEVICES MARKET: END USER-BASED ESTIMATION
    2.3 MARKET BREAKDOWN AND DATA TRIANGULATION 
          FIGURE 10 DATA TRIANGULATION METHODOLOGY
           2.3.1 MARKET SHARE ASSESSMENT
    2.4 RESEARCH ASSUMPTIONS 
    2.5 GROWTH RATE ASSUMPTIONS 
    2.6 RESEARCH LIMITATIONS 
           2.6.1 SCOPE-RELATED LIMITATIONS
           2.6.2 METHODOLOGY-RELATED LIMITATIONS
    2.7 RISK ASSESSMENT 
           2.7.1 RISK ASSESSMENT ANALYSIS
    2.8 RECESSION IMPACT ANALYSIS 
 
3 EXECUTIVE SUMMARY (Page No. - 46)
    FIGURE 11 BIOPSY DEVICES MARKET, BY PRODUCT, 2023 VS. 2028 (USD MILLION)
    FIGURE 12 BIOPSY DEVICES MARKET, BY APPLICATION, 2023 VS. 2028 (USD MILLION)
    FIGURE 13 BIOPSY DEVICES MARKET, BY END USER, 2023 VS. 2028 (USD MILLION)
    FIGURE 14 GEOGRAPHICAL SNAPSHOT: BIOPSY DEVICES MARKET
 
4 PREMIUM INSIGHTS (Page No. - 49)
    4.1 BIOPSY DEVICES MARKET OVERVIEW 
          FIGURE 15 GROWING DEMAND FOR MINIMALLY INVASIVE SURGERY TO DRIVE MARKET
    4.2 NORTH AMERICA: BIOPSY DEVICES MARKET,  BY PRODUCT, 2023 VS. 2028 (USD MILLION) 
          FIGURE 16 LIQUID BIOPSY INSTRUMENTS TO DOMINATE NORTH AMERICAN MARKET IN 2023
    4.3 ASIA PACIFIC: BIOPSY DEVICES MARKET,  BY END USER, 2023 VS. 2028 (USD MILLION) 
          FIGURE 17 HOSPITALS & BREAST CARE CENTERS TO DOMINATE ASIA PACIFIC MARKET IN 2023
    4.4 EUROPE: BIOPSY DEVICES MARKET, BY GUIDANCE TECHNIQUE, 2023 VS. 2028 (USD MILLION) 
          FIGURE 18 NON-IMAGE-GUIDED BIOPSY SEGMENT TO DOMINATE EUROPEAN MARKET DURING FORECAST PERIOD
    4.5 BIOPSY DEVICES MARKET: GEOGRAPHIC GROWTH OPPORTUNITIES 
          FIGURE 19 US TO WITNESS HIGHEST GROWTH DURING FORECAST PERIOD
 
5 MARKET OVERVIEW (Page No. - 52)
    5.1 INTRODUCTION 
    5.2 MARKET DYNAMICS 
          FIGURE 20 DRIVERS, RESTRAINTS, OPPORTUNITIES, AND CHALLENGES: BIOPSY DEVICES MARKET
           5.2.1 DRIVERS
                    5.2.1.1 Rising prevalence of cancer
                    5.2.1.2 Increasing preference for minimally invasive surgeries
                    5.2.1.3 Initiatives undertaken by governments and global health organizations
                    5.2.1.4 Increased number of hospitals and diagnostic centers
                    5.2.1.5 Improved reimbursement scenario
           5.2.2 RESTRAINTS
                    5.2.2.1 Increasing product recalls
                                TABLE 1 INDICATIVE LIST OF FDA PRODUCT RECALLS FOR BIOPSY DEVICES (2020–2021)
                    5.2.2.2 High risk of infections for patients
           5.2.3 OPPORTUNITIES
                    5.2.3.1 Technological innovations in biopsy devices
                    5.2.3.2 Growing investments in emerging economies
           5.2.4 CHALLENGES
                    5.2.4.1 Underdeveloped healthcare infrastructure in emerging economies
    5.3 PORTER’S FIVE FORCES ANALYSIS 
          TABLE 2 PORTER’S FIVE FORCES ANALYSIS: BIOPSY DEVICES MARKET
           5.3.1 THREAT OF NEW ENTRANTS
           5.3.2 THREAT OF SUBSTITUTES
           5.3.3 BARGAINING POWER OF SUPPLIERS
           5.3.4 BARGAINING POWER OF BUYERS
           5.3.5 INTENSITY OF COMPETITIVE RIVALRY
    5.4 REGULATORY ANALYSIS 
           5.4.1 REGULATORY BODIES, GOVERNMENT AGENCIES, AND OTHER ORGANIZATIONS
                    5.4.1.1 North America
                               5.4.1.1.1 US
                                              TABLE 3 BIOPSY DEVICES UNDER 21 CFR 876.1075 WITH PRODUCT CODES
                    5.4.1.2 Europe
                                FIGURE 21 EUROPE: CE MARK APPROVAL PROCESS FOR BIOPSY DEVICES
                    5.4.1.3 Asia Pacific
                               5.4.1.3.1 Japan
                                              TABLE 4 JAPAN: CLASSIFICATION OF MEDICAL DEVICES AND REVIEWING BODIES
                                              TABLE 5 NOMENCLATURE OF APPLICABLE MEDICAL DEVICES WITH CODES
                               5.4.1.3.2 China
                               5.4.1.3.3 India
                                              TABLE 6 INDIA: REGULATORY CLASSIFICATION FOR MEDICAL DEVICES
                    5.4.1.4 Latin America
                               5.4.1.4.1 Brazil
                                              FIGURE 22 BRAZIL: REGULATORY PROCESS FOR MEDICAL DEVICES
                                              TABLE 7 BRAZIL: TIME, COST, AND COMPLEXITY OF REGISTRATION PROCESS
                               5.4.1.4.2 Mexico
                                              FIGURE 23 MEXICO: REGULATORY PROCESS FOR MEDICAL DEVICES
                                              TABLE 8 MEXICO: TIME, COST, AND COMPLEXITY OF REGISTRATION PROCESS
           5.4.2 REGULATORY TRENDS FOR BIOPSY DEVICES MARKET
    5.5 REIMBURSEMENT SCENARIO ANALYSIS 
          TABLE 9 MEDICAL REIMBURSEMENT CPT CODES FOR BIOPSY DEVICE PROCEDURES IN US (2021)
    5.6 ECOSYSTEM/MARKET MAP 
    5.7 VALUE CHAIN ANALYSIS 
           5.7.1 RESEARCH & PRODUCT DEVELOPMENT
           5.7.2 RAW MATERIAL PROCUREMENT AND MANUFACTURING
           5.7.3 SHIPMENT, MARKETING & SALES, AND POST-SALES SERVICES
                    FIGURE 24 VALUE CHAIN ANALYSIS—MAXIMUM VALUE ADDED DURING MANUFACTURING PHASE
    5.8 SUPPLY CHAIN ANALYSIS 
           5.8.1 PROMINENT COMPANIES
           5.8.2 SMALL AND MEDIUM-SIZED ENTERPRISES
           5.8.3 END USERS
                    TABLE 10 ROLE IN ECOSYSTEM: BIOPSY DEVICES MARKET
                    FIGURE 25 SUPPLY CHAIN ANALYSIS: BIOPSY DEVICES MARKET
    5.9 PATENT ANALYSIS 
          FIGURE 26 PATENT DETAILS FOR NEEDLE-BASED BIOPSY INSTRUMENTS  (JANUARY 2013–AUGUST 2023)
          FIGURE 27 PATENTS FOR BIOPSY LOCALIZATION WIRES (JANUARY 2013–AUGUST 2023)
          FIGURE 28 PATENTS FOR BIOPSY FORCEPS (JANUARY 2013–AUGUST 2023)
    5.10 TRADE ANALYSIS 
           TABLE 11 IMPORT DATA FOR BIOPSY DEVICES (HS CODE 901839), BY COUNTRY, 2018–2022 (USD)
           TABLE 12 EXPORT DATA FOR BIOPSY DEVICES (HS CODE 901839), BY COUNTRY, 2018–2022 (USD)
    5.11 KEY STAKEHOLDERS & BUYING CRITERIA 
           5.11.1 KEY STAKEHOLDERS IN BIOPSY DEVICES MARKET
                     FIGURE 29 INFLUENCE OF STAKEHOLDERS ON BUYING PROCESS OF BIOPSY DEVICES
                     TABLE 13 INFLUENCE OF STAKEHOLDERS ON BUYING PROCESS OF BIOPSY DEVICES
           5.11.2 BUYING CRITERIA FOR BIOPSY DEVICES
                     FIGURE 30 KEY BUYING CRITERIA FOR BIOPSY DEVICES
                     TABLE 14 KEY BUYING CRITERIA FOR BIOPSY DEVICES
    5.12 KEY CONFERENCES & EVENTS (2023–2025) 
           TABLE 15 LIST OF KEY CONFERENCES & EVENTS, 2023–2025
    5.13 TECHNOLOGY ANALYSIS 
    5.14 CASE STUDY ANALYSIS 
           TABLE 16 CASE STUDY 1: MAINTAINING STRONG FOCUS ON TECHNOLOGICAL INNOVATION AND ADDRESSING REGULATORY COMPLIANCE
           TABLE 17 CASE STUDY 2: PROVIDING COMPREHENSIVE TRAINING PROGRAMS FOR EVOLVING BIOPSY TECHNIQUES
    5.15 PRICING ANALYSIS 
           TABLE 18 REGION-WISE PRICE RANGE FOR BIOPSY DEVICES INSTRUMENTS, 2023
 
6 BIOPSY DEVICES MARKET, BY PRODUCT (Page No. - 80)
    6.1 INTRODUCTION 
          TABLE 19 BIOPSY DEVICES MARKET, BY PRODUCT TYPE, 2021–2028 (USD MILLION)
    6.2 LIQUID BIOPSY INSTRUMENTS 
           6.2.1 ONGOING RESEARCH AND CLINICAL TRIALS TO DELIVER NOVEL SOLUTIONS IN MARKET
          TABLE 20 LIQUID BIOPSY INSTRUMENTS MARKET, BY REGION, 2021–2028 (USD MILLION)
          TABLE 21 LIQUID BIOPSY INSTRUMENTS MARKET, BY APPLICATION, 2021–2028 (USD MILLION)
          TABLE 22 LIQUID BIOPSY INSTRUMENTS MARKET, BY END USER, 2021–2028 (USD MILLION)
    6.3 NEEDLE-BASED BIOPSY INSTRUMENTS 
          TABLE 23 NEEDLE-BASED BIOPSY INSTRUMENTS MARKET, BY TYPE, 2021–2028 (USD MILLION)
          TABLE 24 NEEDLE-BASED BIOPSY INSTRUMENTS MARKET, BY REGION, 2021–2028 (USD MILLION)
          TABLE 25 NEEDLE-BASED BIOPSY INSTRUMENTS MARKET, BY APPLICATION,  2021–2028 (USD MILLION)
          TABLE 26 NEEDLE-BASED BIOPSY INSTRUMENTS MARKET, BY END USER,  2021–2028 (USD MILLION)
           6.3.1 CORE BIOPSY DEVICES
                    TABLE 27 CORE BIOPSY DEVICES MARKET, BY TYPE, 2021–2028 (USD MILLION)
                    TABLE 28 CORE BIOPSY DEVICES MARKET, BY REGION, 2021–2028 (USD MILLION)
                    6.3.1.1 Core biopsy needles
                               6.3.1.1.1 Greater diagnostic accuracy and improved imaging capabilities to boost demand
                                              TABLE 29 CORE BIOPSY NEEDLES MARKET, BY REGION, 2021–2028 (USD MILLION)
                    6.3.1.2 Core biopsy guns
                               6.3.1.2.1 Rapidity, efficiency, and accuracy to support adoption
                                              TABLE 30 CORE BIOPSY GUNS MARKET, BY REGION, 2021–2028 (USD MILLION)
           6.3.2 ASPIRATION BIOPSY NEEDLES
                    6.3.2.1 Innovations in needle design, including thinner profiles and improved tip configurations, to drive market
                                TABLE 31 ASPIRATION BIOPSY NEEDLES MARKET, BY REGION, 2021–2028 (USD MILLION)
           6.3.3 VACUUM-ASSISTED BIOPSY DEVICES
                    TABLE 32 VACUUM-ASSISTED BIOPSY DEVICES MARKET, BY TYPE, 2021–2028 (USD MILLION)
                    TABLE 33 VACUUM-ASSISTED BIOPSY DEVICES MARKET, BY REGION, 2021–2028 (USD MILLION)
                    6.3.3.1 Vacuum-assisted biopsy systems
                               6.3.3.1.1 Increasing demand for early and accurate cancer detection, particularly in breast cancer, to drive market
                                              TABLE 34 VACUUM-ASSISTED BIOPSY SYSTEMS MARKET, BY REGION, 2021–2028 (USD MILLION)
                    6.3.3.2 Vacuum-assisted biopsy needles
                               6.3.3.2.1 Innovative design and ability to retrieve larger specimens to support adoption
                                              TABLE 35 VACUUM-ASSISTED BIOPSY NEEDLES MARKET, BY REGION, 2021–2028 (USD MILLION)
    6.4 PROCEDURE TRAYS 
           6.4.1 DEMAND FOR EARLY CANCER DETECTION AND MINIMALLY INVASIVE TECHNIQUES TO DRIVE MARKET
                    TABLE 36 PROCEDURE TRAYS MARKET, BY REGION, 2021–2028 (USD MILLION)
                    TABLE 37 PROCEDURE TRAYS MARKET, BY APPLICATION, 2021–2028 (USD MILLION)
                    TABLE 38 PROCEDURE TRAYS MARKET, BY END USER, 2021–2028 (USD MILLION)
    6.5 LOCALIZATION WIRES 
           6.5.1 ABILITY TO DETECT PRECISE TARGET LOCATIONS TO DRIVE MARKET
                    TABLE 39 LOCALIZATION WIRES MARKET, BY REGION, 2021–2028 (USD MILLION)
                    TABLE 40 LOCALIZATION WIRES MARKET, BY APPLICATION, 2021–2028 (USD MILLION)
                    TABLE 41 LOCALIZATION WIRES MARKET, BY END USER, 2021–2028 (USD MILLION)
    6.6 BIOPSY TABLES 
           6.6.1 EASE OF POSITIONING TO DRIVE DEMAND FOR BIOPSY TABLES
                    TABLE 42 BIOPSY TABLES MARKET, BY REGION, 2021–2028 (USD MILLION)
                    TABLE 43 BIOPSY TABLES MARKET, BY APPLICATION, 2021–2028 (USD MILLION)
                    TABLE 44 BIOPSY TABLES MARKET, BY END USER, 2021–2028 (USD MILLION)
    6.7 BIOPSY FORCEPS 
          TABLE 45 BIOPSY FORCEPS MARKET, BY TYPE, 2021–2028 (USD MILLION)
          TABLE 46 BIOPSY FORCEPS MARKET, BY REGION, 2021–2028 (USD MILLION)
          TABLE 47 BIOPSY FORCEPS MARKET, BY APPLICATION, 2021–2028 (USD MILLION)
          TABLE 48 BIOPSY FORCEPS MARKET, BY END USER, 2021–2028 (USD MILLION)
           6.7.1 GENERAL BIOPSY FORCEPS
                    6.7.1.1 Demand for minimally invasive procedures and precise diagnostics continues to surge market growth
                                TABLE 49 GENERAL BIOPSY FORCEPS MARKET, BY REGION, 2021–2028 (USD MILLION)
           6.7.2 HOT BIOPSY FORCEPS
                    6.7.2.1 Unique ability to cut and coagulate tissue simultaneously to support adoption
                                TABLE 50 HOT BIOPSY FORCEPS MARKET, BY REGION, 2021–2028 (USD MILLION)
    6.8 OTHER PRODUCTS 
          TABLE 51 OTHER BIOPSY PRODUCTS MARKET, BY REGION, 2021–2028 (USD MILLION)
          TABLE 52 OTHER BIOPSY PRODUCTS MARKET, BY APPLICATION, 2021–2028 (USD MILLION)
          TABLE 53 OTHER BIOPSY PRODUCTS MARKET, BY END USER, 2021–2028 (USD MILLION)
 
7 BIOPSY DEVICES MARKET, BY GUIDANCE TECHNIQUE (Page No. - 104)
    7.1 INTRODUCTION 
          TABLE 54 BIOPSY DEVICES MARKET, BY GUIDANCE TECHNIQUE, 2021–2028 (USD MILLION)
    7.2 NON-IMAGE-GUIDED BIOPSY 
           7.2.1 WIDE USAGE IN SITUATIONS WHERE IMAGING TECHNOLOGY IS INACCESSIBLE TO DRIVE MARKET
                    TABLE 55 NON-IMAGE-GUIDED BIOPSY MARKET, BY REGION, 2021–2028 (USD MILLION)
    7.3 IMAGE-GUIDED BIOPSY 
          TABLE 56 IMAGE-GUIDED BIOPSY MARKET, BY TYPE, 2021–2028 (USD MILLION)
          TABLE 57 IMAGE-GUIDED BIOPSY MARKET, BY REGION, 2021–2028 (USD MILLION)
           7.3.1 ULTRASOUND-GUIDED BIOPSY
                    7.3.1.1 Advantages of technique to boost usage
                                TABLE 58 ULTRASOUND-GUIDED BIOPSY MARKET, BY REGION, 2021–2028 (USD MILLION)
           7.3.2 STEREOTACTIC-GUIDED BIOPSY
                    7.3.2.1 Efficiency and accuracy to support adoption
                                TABLE 59 STEREOTACTIC-GUIDED BIOPSY MARKET, BY REGION, 2021–2028 (USD MILLION)
           7.3.3 MRI-GUIDED BIOPSY
                    7.3.3.1 High cost and low specificity to affect demand
                                TABLE 60 MRI-GUIDED BIOPSY MARKET, BY REGION, 2021–2028 (USD MILLION)
           7.3.4 OTHER IMAGE-GUIDED BIOPSY TECHNIQUES
                    TABLE 61 OTHER IMAGE-GUIDED BIOPSY TECHNIQUES MARKET, BY REGION,  2021–2028 (USD MILLION)
 
8 BIOPSY DEVICES MARKET, BY APPLICATION (Page No. - 110)
    8.1 INTRODUCTION 
          TABLE 62 BIOPSY DEVICES MARKET, BY APPLICATION, 2021–2028 (USD MILLION)
    8.2 LUNG CANCER 
           8.2.1 LUNG CANCER TO HOLD LARGEST MARKET SHARE
                    TABLE 63 BIOPSY DEVICES MARKET FOR LUNG CANCER, BY REGION, 2021–2028 (USD MILLION)
    8.3 BREAST CANCER 
           8.3.1 INCREASING DEMAND FOR EARLY AND ACCURATE DIAGNOSIS AND RISING PREVALENCE TO DRIVE MARKET
                    TABLE 64 BIOPSY DEVICES MARKET FOR BREAST CANCER, BY REGION, 2021–2028 (USD MILLION)
    8.4 COLORECTAL CANCER 
           8.4.1 RISING EMPHASIS ON EARLY DETECTION AND SCREENING TO SUPPORT MARKET GROWTH
                    TABLE 65 BIOPSY DEVICES MARKET FOR COLORECTAL CANCER, BY REGION,  2021–2028 (USD MILLION)
    8.5 KIDNEY CANCER 
           8.5.1 ADVANCEMENTS IN DIAGNOSTICS AND GROWING EMPHASIS ON CANCER THERAPEUTICS TO DRIVE MARKET
                    TABLE 66 BIOPSY DEVICES MARKET FOR KIDNEY CANCER, BY REGION, 2021–2028 (USD MILLION)
    8.6 PROSTATE CANCER 
           8.6.1 RISING INCIDENCE OF PROSTATE CANCER AND GROWING AGING POPULATION TO SUPPORT DEMAND FOR BIOPSY DEVICES
                    TABLE 67 BIOPSY DEVICES MARKET FOR PROSTATE CANCER, BY REGION,  2021–2028 (USD MILLION)
    8.7 BONE MARROW BIOPSY 
           8.7.1 RISING EMPHASIS ON BONE MARROW BIOPSIES TO SUPPORT MARKET GROWTH
                    TABLE 68 BIOPSY DEVICES MARKET FOR BONE MARROW BIOPSY, BY REGION,  2021–2028 (USD MILLION)
    8.8 OTHER APPLICATIONS 
          TABLE 69 BIOPSY DEVICES MARKET FOR OTHER APPLICATIONS, BY REGION,  2021–2028 (USD MILLION)
 
9 BIOPSY DEVICES MARKET, BY END USER (Page No. - 118)
    9.1 INTRODUCTION 
          TABLE 70 BIOPSY DEVICES MARKET, BY END USER, 2021–2028 (USD MILLION)
    9.2 HOSPITALS & BREAST CARE CENTERS 
           9.2.1 HIGH PROCEDURAL VOLUMES TO ENSURE SUSTAINED DEMAND FOR BIOPSY DEVICES
                    TABLE 71 BIOPSY DEVICES MARKET FOR HOSPITALS & BREAST CARE CENTERS, BY REGION,  2021–2028 (USD MILLION)
    9.3 DIAGNOSTIC IMAGING CENTERS 
           9.3.1 INCREASING NUMBER OF PRIVATE IMAGING CENTERS TO SUPPORT MARKET GROWTH
                    TABLE 72 BIOPSY DEVICES MARKET FOR DIAGNOSTIC IMAGING CENTERS, BY REGION,  2021–2028 (USD MILLION)
    9.4 ACADEMIC & RESEARCH INSTITUTES 
           9.4.1 GROWING AVAILABILITY OF RESEARCH GRANTS AND FUNDING TO DRIVE MARKET
                    TABLE 73 BIOPSY DEVICES MARKET FOR ACADEMIC & RESEARCH INSTITUTES, BY REGION,  2021–2028 (USD MILLION)
    9.5 OTHER END USERS 
          TABLE 74 BIOPSY DEVICES MARKET FOR OTHER END USERS, BY REGION,  2021–2028 (USD MILLION)
 
10 BIOPSY DEVICES MARKET, BY REGION (Page No. - 124)
     10.1 INTRODUCTION 
             TABLE 75 BIOPSY DEVICES MARKET, BY REGION, 2021–2028 (USD MILLION)
     10.2 NORTH AMERICA 
             10.2.1 RECESSION IMPACT
                        FIGURE 31 NORTH AMERICA: BIOPSY DEVICES MARKET SNAPSHOT
                        TABLE 76 NORTH AMERICA: BIOPSY DEVICES MARKET, BY COUNTRY, 2021–2028 (USD MILLION)
                        TABLE 77 NORTH AMERICA: BIOPSY DEVICES MARKET, BY PRODUCT, 2021–2028 (USD MILLION)
                        TABLE 78 NORTH AMERICA: NEEDLE-BASED BIOPSY INSTRUMENTS MARKET, BY TYPE,  2021–2028 (USD MILLION)
                        TABLE 79 NORTH AMERICA: CORE BIOPSY DEVICES MARKET, BY TYPE, 2021–2028 (USD MILLION)
                        TABLE 80 NORTH AMERICA: VACUUM-ASSISTED BIOPSY DEVICES MARKET, BY TYPE,  2021–2028 (USD MILLION)
                        TABLE 81 NORTH AMERICA: BIOPSY FORCEPS MARKET, BY TYPE, 2021–2028 (USD MILLION)
                        TABLE 82 NORTH AMERICA: BIOPSY DEVICES MARKET, BY APPLICATION,  2021–2028 (USD MILLION)
                        TABLE 83 NORTH AMERICA: BIOPSY DEVICES MARKET, BY END USER, 2021–2028 (USD MILLION)
             10.2.2 US
                        10.2.2.1 Rising geriatric population to drive market
                                      TABLE 84 US: BIOPSY DEVICES MARKET, BY PRODUCT, 2021–2028 (USD MILLION)
             10.2.3 CANADA
                        10.2.3.1 Government investments to support market growth
                                      TABLE 85 CANADA: BIOPSY DEVICES MARKET, BY PRODUCT, 2021–2028 (USD MILLION)
     10.3 EUROPE 
             10.3.1 RECESSION IMPACT
                        TABLE 86 EUROPE: BIOPSY DEVICES MARKET, BY COUNTRY, 2021–2028 (USD MILLION)
                        TABLE 87 EUROPE: BIOPSY DEVICES MARKET, BY PRODUCT, 2021–2028 (USD MILLION)
                        TABLE 88 EUROPE: NEEDLE-BASED BIOPSY INSTRUMENTS MARKET, BY TYPE,  2021–2028 (USD MILLION)
                        TABLE 89 EUROPE: CORE BIOPSY DEVICES MARKET, BY TYPE, 2021–2028 (USD MILLION)
                        TABLE 90 EUROPE: VACUUM-ASSISTED BIOPSY DEVICES MARKET, BY TYPE,  2021–2028 (USD MILLION)
                        TABLE 91 EUROPE: BIOPSY FORCEPS MARKET, BY TYPE, 2021–2028 (USD MILLION)
                        TABLE 92 EUROPE: BIOPSY DEVICES MARKET, BY APPLICATION, 2021–2028 (USD MILLION)
                        TABLE 93 EUROPE: BIOPSY DEVICES MARKET, BY END USER, 2021–2028 (USD MILLION)
             10.3.2 GERMANY
                        10.3.2.1 Increasing prevalence of chronic diseases to propel market
                                      TABLE 94 GERMANY: BIOPSY DEVICES MARKET, BY PRODUCT, 2021–2028 (USD MILLION)
             10.3.3 FRANCE
                        10.3.3.1 Rising number of diagnostic imaging centers to drive market
                                      TABLE 95 FRANCE: BIOPSY DEVICES MARKET, BY PRODUCT, 2021–2028 (USD MILLION)
             10.3.4 UK
                        10.3.4.1 Government initiatives to support market growth
                                      TABLE 96 UK: BIOPSY DEVICES MARKET, BY PRODUCT, 2021–2028 (USD MILLION)
             10.3.5 ITALY
                        10.3.5.1 Availability of reimbursement coverage to support market growth
                                      TABLE 97 ITALY: BIOPSY DEVICES MARKET, BY PRODUCT, 2021–2028 (USD MILLION)
             10.3.6 SPAIN
                        10.3.6.1 Increasing focus on cancer research to propel market
                                      TABLE 98 SPAIN: BIOPSY DEVICES MARKET, BY PRODUCT, 2021–2028 (USD MILLION)
             10.3.7 REST OF EUROPE
                        TABLE 99 REST OF EUROPE: BIOPSY DEVICES MARKET, BY PRODUCT, 2021–2028 (USD MILLION)
     10.4 ASIA PACIFIC 
             10.4.1 RECESSION IMPACT
                        FIGURE 32 ASIA PACIFIC: BIOPSY DEVICES MARKET SNAPSHOT
                        TABLE 100 ASIA PACIFIC: BIOPSY DEVICES MARKET, BY COUNTRY, 2021–2028 (USD MILLION)
                        TABLE 101 ASIA PACIFIC: BIOPSY DEVICES MARKET, BY PRODUCT, 2021–2028 (USD MILLION)
                        TABLE 102 ASIA PACIFIC: NEEDLE-BASED BIOPSY INSTRUMENTS MARKET, BY TYPE,  2021–2028 (USD MILLION)
                        TABLE 103 ASIA PACIFIC: CORE BIOPSY DEVICES MARKET, BY TYPE, 2021–2028 (USD MILLION)
                        TABLE 104 ASIA PACIFIC: VACUUM-ASSISTED BIOPSY DEVICES MARKET, BY TYPE,  2021–2028 (USD MILLION)
                        TABLE 105 ASIA PACIFIC: BIOPSY FORCEPS MARKET, BY TYPE, 2021–2028 (USD MILLION)
                        TABLE 106 ASIA PACIFIC: BIOPSY DEVICES MARKET, BY APPLICATION, 2021–2028 (USD MILLION)
                        TABLE 107 ASIA PACIFIC: BIOPSY DEVICES MARKET, BY END USER, 2021–2028 (USD MILLION)
             10.4.2 CHINA
                        10.4.2.1 Rapidly growing geriatric population to propel market
                                      TABLE 108 CHINA: BIOPSY DEVICES MARKET, BY PRODUCT, 2021–2028 (USD MILLION)
             10.4.3 JAPAN
                        10.4.3.1 High adoption of advanced technologies to support market growth
                                      TABLE 109 JAPAN: BIOPSY DEVICES MARKET, BY PRODUCT, 2021–2028 (USD MILLION)
             10.4.4 INDIA
                        10.4.4.1 Rising prevalence of chronic diseases to drive market
                                      TABLE 110 INDIA: BIOPSY DEVICES MARKET, BY PRODUCT, 2021–2028 (USD MILLION)
             10.4.5 AUSTRALIA
                        10.4.5.1 Increasing investments in research to provide opportunities for market growth
                                      TABLE 111 AUSTRALIA: BIOPSY DEVICES MARKET, BY PRODUCT, 2021–2028 (USD MILLION)
             10.4.6 SOUTH KOREA
                        10.4.6.1 Presence of well-developed healthcare system to propel market
                                      TABLE 112 SOUTH KOREA: BIOPSY DEVICES MARKET, BY PRODUCT, 2021–2028 (USD MILLION)
             10.4.7 REST OF ASIA PACIFIC
                        TABLE 113 REST OF ASIA PACIFIC: BIOPSY DEVICES MARKET, BY PRODUCT, 2021–2028 (USD MILLION)
     10.5 LATIN AMERICA 
             10.5.1 RECESSION IMPACT
                        TABLE 114 LATIN AMERICA: BIOPSY DEVICES MARKET, BY COUNTRY, 2021–2028 (USD MILLION)
                        TABLE 115 LATIN AMERICA: BIOPSY DEVICES MARKET, BY PRODUCT, 2021–2028 (USD MILLION)
                        TABLE 116 LATIN AMERICA: NEEDLE-BASED BIOPSY INSTRUMENTS MARKET, BY TYPE,  2021–2028 (USD MILLION)
                        TABLE 117 LATIN AMERICA: CORE BIOPSY DEVICES MARKET, BY TYPE, 2021–2028 (USD MILLION)
                        TABLE 118 LATIN AMERICA: VACUUM-ASSISTED BIOPSY DEVICES MARKET, BY TYPE,  2021–2028 (USD MILLION)
                        TABLE 119 LATIN AMERICA: BIOPSY FORCEPS MARKET, BY TYPE, 2021–2028 (USD MILLION)
                        TABLE 120 LATIN AMERICA: BIOPSY DEVICES MARKET, BY APPLICATION, 2021–2028 (USD MILLION)
                        TABLE 121 LATIN AMERICA: BIOPSY DEVICES MARKET, BY END USER, 2021–2028 (USD MILLION)
             10.5.2 BRAZIL
                        10.5.2.1 Favorable demographic conditions to drive market
                                      TABLE 122 BRAZIL: BIOPSY DEVICES MARKET, BY PRODUCT, 2021–2028 (USD MILLION)
             10.5.3 MEXICO
                        10.5.3.1 Increased medical tourism and better government healthcare initiatives to drive market
                                      TABLE 123 MEXICO: BIOPSY DEVICES MARKET, BY PRODUCT, 2021–2028 (USD MILLION)
             10.5.4 REST OF LATIN AMERICA
                        TABLE 124 REST OF LATIN AMERICA: BIOPSY DEVICES MARKET, BY PRODUCT,  2021–2028 (USD MILLION)
     10.6 MIDDLE EAST & AFRICA 
             10.6.1 GROWING MEDICAL TOURISM TO DRIVE MARKET
             10.6.2 RECESSION IMPACT
                        TABLE 125 MIDDLE EAST & AFRICA: BIOPSY DEVICES MARKET, BY PRODUCT,  2021–2028 (USD MILLION)
                        TABLE 126 MIDDLE EAST & AFRICA: NEEDLE-BASED BIOPSY INSTRUMENTS MARKET, BY TYPE, 2021–2028 (USD MILLION)
                        TABLE 127 MIDDLE EAST & AFRICA: CORE BIOPSY DEVICES MARKET, BY TYPE,  2021–2028 (USD MILLION)
                        TABLE 128 MIDDLE EAST & AFRICA: VACUUM-ASSISTED BIOPSY DEVICES MARKET, BY TYPE,  2021–2028 (USD MILLION)
                        TABLE 129 MIDDLE EAST & AFRICA: BIOPSY FORCEPS MARKET, BY TYPE, 2021–2028 (USD MILLION)
                        TABLE 130 MIDDLE EAST & AFRICA: BIOPSY DEVICES MARKET, BY APPLICATION,  2021–2028 (USD MILLION)
                        TABLE 131 MIDDLE EAST & AFRICA: BIOPSY DEVICES MARKET, BY END USER,  2021–2028 (USD MILLION)
 
11 COMPETITIVE LANDSCAPE (Page No. - 162)
     11.1 OVERVIEW 
     11.2 KEY PLAYERS STRATEGIES 
             11.2.1 OVERVIEW OF STRATEGIES ADOPTED BY PLAYERS IN BIOPSY DEVICES MARKET
     11.3 REVENUE SHARE ANALYSIS 
            FIGURE 33 TOP FIVE PLAYERS HAVE DOMINATED MARKET IN LAST FIVE YEARS
     11.4 MARKET SHARE ANALYSIS 
             11.4.1 NEEDLE-BASED BIOPSY DEVICES MARKET
                        FIGURE 34 MARKET SHARE ANALYSIS OF TOP PLAYERS IN BIOPSY DEVICES MARKET (2022)
                        TABLE 132 INTENSITY OF COMPETITIVE RIVALRY FOR NEEDLE-BASED DEVICES AND ACCESSORIES MARKET PLAYERS
             11.4.2 LIQUID BIOPSY MARKET
                        FIGURE 35 MARKET SHARE ANALYSIS OF TOP PLAYERS IN LIQUID BIOPSY MARKET (2022)
                        TABLE 133 INTENSITY OF COMPETITIVE RIVALRY FOR LIQUID BIOPSY MARKET PLAYERS
     11.5 COMPANY EVALUATION MATRIX FOR KEY PLAYERS (2022) 
             11.5.1 STARS
             11.5.2 EMERGING LEADERS
             11.5.3 PERVASIVE PLAYERS
             11.5.4 PARTICIPANTS
                        FIGURE 36 BIOPSY DEVICES MARKET: COMPANY EVALUATION MATRIX FOR KEY PLAYERS (2022)
             11.5.5 COMPETITIVE BENCHMARKING
                        TABLE 134 BIOPSY DEVICES MARKET: PRODUCT AND REGIONAL FOOTPRINT ANALYSIS OF COMPANIES
                        TABLE 135 BIOPSY DEVICES MARKET-PRODUCT FOOTPRINT ANALYSIS OF COMPANIES  FOR KEY PLAYERS
                        TABLE 136 BIOPSY DEVICES MARKET- REGIONAL FOOTPRINT ANALYSIS OF KEY COMPANIES
     11.6 START-UP/SME EVALUATION MATRIX (2022) 
             11.6.1 PROGRESSIVE COMPANIES
             11.6.2 RESPONSIVE COMPANIES
             11.6.3 DYNAMIC COMPANIES
             11.6.4 STARTING BLOCKS
                        FIGURE 37 BIOPSY DEVICES MARKET: COMPANY EVALUATION MATRIX FOR START-UPS/SMES (2022)
             11.6.5 COMPETITIVE BENCHMARKING FOR START-UPS/SMES
                        TABLE 137 BIOPSY DEVICES MARKET: PRODUCT & REGIONAL FOOTPRINT ANALYSIS OF COMPANIES
                        TABLE 138 BIOPSY DEVICES MARKET-PRODUCT FOOTPRINT ANALYSIS OF COMPANIES  FOR START-UP/SME PLAYERS
                        TABLE 139 BIOPSY DEVICES MARKET- REGIONAL FOOTPRINT ANALYSIS  OF START-UP/SME COMPANIES
     11.7 COMPETITIVE SCENARIOS AND TRENDS 
             TABLE 140 BIOPSY DEVICES MARKET: PRODUCT LAUNCHES (JANUARY 2020–AUGUST 2023)
             TABLE 141 BIOPSY DEVICES MARKET: DEALS (JANUARY 2020–AUGUST 2023)
             TABLE 142 BIOPSY DEVICES MARKET: OTHER DEVELOPMENTS (JANUARY 2020–AUGUST 2023)
 
12 COMPANY PROFILES (Page No. - 177)
     12.1 KEY PLAYERS 
(Business overview, Products offered, Recent developments, MnM view, Key strengths/Right to win, Strategic choices made, and Weaknesses and Competitive threats)*
             12.1.1 BECTON, DICKINSON AND COMPANY
                        TABLE 143 BECTON, DICKINSON AND COMPANY: BUSINESS OVERVIEW
                        FIGURE 38 BECTON, DICKINSON AND COMPANY: COMPANY SNAPSHOT (2022)
             12.1.2 DEVICOR MEDICAL PRODUCTS, INC. (PART OF DANAHER CORPORATION)
                        TABLE 144 DANAHER CORPORATION: BUSINESS OVERVIEW
                        FIGURE 39 DANAHER CORPORATION: COMPANY SNAPSHOT (2022)
             12.1.3 B. BRAUN MELSUNGEN AG
                        TABLE 145 B. BRAUN MELSUNGEN AG: BUSINESS OVERVIEW
                        FIGURE 40 B. BRAUN MELSUNGEN AG: COMPANY SNAPSHOT (2022)
             12.1.4 CARDINAL HEALTH, INC.
                        TABLE 146 CARDINAL HEALTH, INC.: BUSINESS OVERVIEW
                        FIGURE 41 CARDINAL HEALTH, INC.: COMPANY SNAPSHOT (2022)
             12.1.5 HOLOGIC, INC.
                        TABLE 147 HOLOGIC, INC.: BUSINESS OVERVIEW
                        FIGURE 42 HOLOGIC, INC.: COMPANY SNAPSHOT (2022)
             12.1.6 OLYMPUS CORPORATION
                        TABLE 148 OLYMPUS CORPORATION: BUSINESS OVERVIEW
                        FIGURE 43 OLYMPUS CORPORATION: COMPANY SNAPSHOT (2022)
             12.1.7 BOSTON SCIENTIFIC CORPORATION
                        TABLE 149 BOSTON SCIENTIFIC CORPORATION: BUSINESS OVERVIEW
                        FIGURE 44 BOSTON SCIENTIFIC CORPORATION: COMPANY SNAPSHOT (2022)
             12.1.8 FUJIFILM CORPORATION
                        TABLE 150 FUJIFILM CORPORATION: BUSINESS OVERVIEW
                        FIGURE 45 FUJIFILM CORPORATION: COMPANY SNAPSHOT (2022)
             12.1.9 MEDTRONIC PLC
                        TABLE 151 MEDTRONIC PLC: BUSINESS OVERVIEW
                        FIGURE 46 MEDTRONIC PLC: COMPANY SNAPSHOT (2022)
             12.1.10 STRYKER CORPORATION
                        TABLE 152 STRYKER CORPORATION: BUSINESS OVERVIEW
                        FIGURE 47 STRYKER: COMPANY SNAPSHOT (2022)
             12.1.11 COOK GROUP INCORPORATED
                        TABLE 153 COOK GROUP INCORPORATED: BUSINESS OVERVIEW
             12.1.12 ARGON MEDICAL DEVICES
                        TABLE 154 ARGON MEDICAL DEVICES: BUSINESS OVERVIEW
             12.1.13 INRAD, INC.
                        TABLE 155 INRAD, INC.: BUSINESS OVERVIEW
             12.1.14 CONMED CORPORATION
                        TABLE 156 CONMED CORPORATION: BUSINESS OVERVIEW
             12.1.15 TELEFLEX INCORPORATED
                        TABLE 157 TELEFLEX INCORPORATED.: BUSINESS OVERVIEW
                        FIGURE 48 TELEFLEX INCORPORATED: COMPANY SNAPSHOT (2022)
             12.1.16 QIAGEN N.V.
                        TABLE 158 QIAGEN N.V.: BUSINESS OVERVIEW
                        FIGURE 49 QIAGEN N.V.: COMPANY SNAPSHOT (2022)
             12.1.17 THERMO FISHER SCIENTIFIC, INC.
                        TABLE 159 THERMO FISHER SCIENTIFIC, INC.: BUSINESS OVERVIEW
                        FIGURE 50 THERMO FISHER SCIENTIFIC, INC.: COMPANY SNAPSHOT (2022)
     12.2 OTHER PLAYERS 
             12.2.1 SUMMIT MEDICAL LLC
             12.2.2 HILL-ROM HOLDINGS, INC.
             12.2.3 GALLINI S.R.L
             12.2.4 TRANSMED7, LLC
             12.2.5 TSK LABORATORY INTERNATIONAL
             12.2.6 MERIT MEDICAL SYSTEMS, INC.
             12.2.7 DR. JAPAN CO., LTD.
             12.2.8 IZI MEDICAL PRODUCTS
             12.2.9 PLANMED OY
             12.2.10 ADVIN HEALTH CARE
             12.2.11 F. HOFFMANN-LA ROCHE LTD.
             12.2.12 BIO-RAD LABORATORIES, INC.
             12.2.13 ILLUMINA, INC.
 
*Details on Business overview, Products offered, Recent developments, MnM view, Key strengths/Right to win, Strategic choices made, and Weaknesses and Competitive threats might not be captured in case of unlisted companies.
 
13 APPENDIX (Page No. - 229)
     13.1 DISCUSSION GUIDE 
     13.2 KNOWLEDGESTORE: MARKETSANDMARKETS’  SUBSCRIPTION PORTAL 
     13.3 CUSTOMIZATION OPTIONS 
     13.4 RELATED REPORTS 
     13.5 AUTHOR DETAILS 

The study involved four major activities in estimating the current size of the biopsy devices market. Exhaustive secondary research was done to collect information on the market, peer, and parent markets. The next step was to validate these findings, assumptions, and sizing with industry experts across the value chain through primary research. Both top-down and bottom-up approaches were employed to estimate the complete market size. After that, market breakdown and data triangulation were used to estimate the market size of segments and subsegments.

Secondary Research

The secondary research process involves the widespread use of secondary sources, directories, databases (such as Bloomberg Businessweek, Factiva, and D&B Hoovers), white papers, annual reports, company house documents, investor presentations, and SEC filings of companies. Secondary research was used to identify and collect information useful for the extensive, technical, market-oriented, and commercial biopsy devices market study. It was also used to obtain important information about the key players and market classification & segmentation according to industry trends to the bottom-most level, and key developments related to market and technology perspectives. A database of the key industry leaders was also prepared using secondary research.

Primary Research

In the primary research process, various supply and demand sources were interviewed to obtain qualitative and quantitative information for this report. The primary sources from the supply side include industry experts such as CEOs, vice presidents, marketing and sales directors, technology & innovation directors, and related key executives from various key companies and organizations in the biopsy devices market. The primary sources from the demand side include hospitals, clinics, research labs, and pharmaceutical and biotechnology companies. Primary research was conducted to validate the market segmentation, identify key players, and gather insights on key industry trends & key market dynamics.

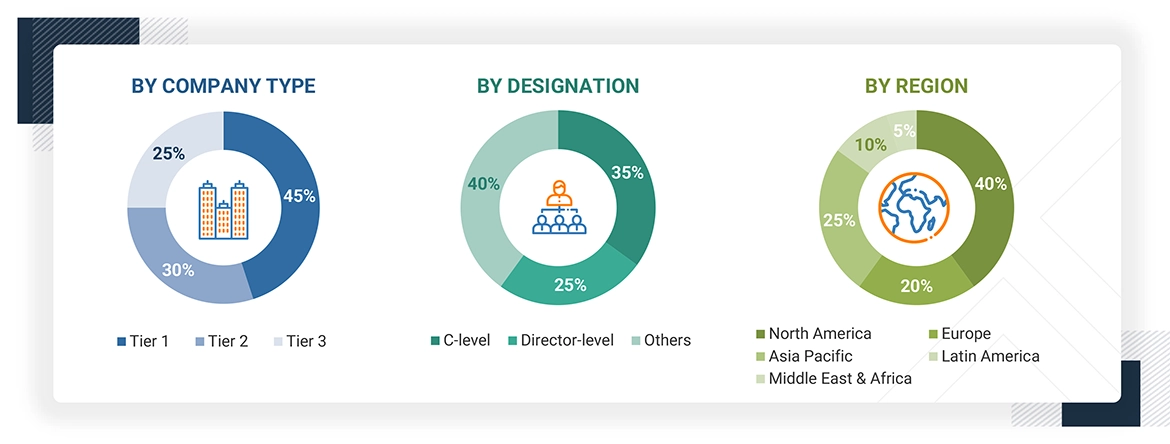
A breakdown of the primary respondents is provided below:
Biopsy Devices Market Size, and Share

*Others include sales managers, marketing managers, business development managers, product managers, distributors, and suppliers.

The tiers of the companies are defined based on their total revenue. As of 2022: Tier 1 => USD 1 billion, Tier 2 = USD 200-500 million to USD 1 billion, and Tier 3 =< USD 200 million

To know about the assumptions considered for the study, download the pdf brochure

Market Estimation Methodology

In this report, the biopsy devices market’s size was determined using the revenue share analysis of leading players. For this purpose, key players in the market were identified, and their revenues from the market business were determined through various insights gathered during the primary and secondary research phases. Secondary research included the study of the annual and financial reports of the top market players. In contrast, primary research included extensive interviews with key opinion leaders, such as CEOs, directors, and key marketing executives.

Segmental revenues were calculated based on the revenue mapping of major solution/service providers to calculate the global market value. This process involved the following steps:

  • Generating a list of major global players operating in the biopsy devices market.
  • Mapping annual revenues generated by major global players from the product segment (or nearest reported business unit/product category)
  • Revenue mapping of major players to cover a major share of the global market share, as of 2022
  • Extrapolating the global value of the biopsy devices market industry

Bottom-up approach

In this report, the size of the global biopsy devices market was determined using the revenue share analysis of leading players. For this purpose, key players in the market were identified, and their revenues from the biopsy devices business were determined through various insights gathered during the primary and secondary research phases. Secondary research included the study of the annual and financial reports of the top market players. In contrast, primary research included extensive interviews with key opinion leaders, such as CEOs, directors, and marketing executives.

Approach 1: Company revenue estimation approach

To calculate the global market value, segmental revenues were calculated based on the revenue mapping of major solution/product providers. This process involved the following steps:

  • Generating a list of major global players operating in the biopsy devices market
  • Mapping the annual revenues generated by major global players from the biopsy devices segment (or the nearest reported business unit/product category)
  • Mapping the revenues of major players to cover at least 80–85% of the global market share as of 2022
  • Extrapolating the global value of the biopsy devices industry

Market Size Estimation For Biopsy Devices: Approach 1 (Company Revenue Estimation)

Biopsy Devices Market Size, and Share

To know about the assumptions considered for the study, Request for Free Sample Report

Approach 2: Customer-based market estimation

During preliminary secondary research, the total sales revenue of biopsy devices was estimated and validated at the regional and country level, triangulated, and validated to estimate the global market value. This process involved the following steps:

  • Generating a list of major customer facilities across each region and country
  • Identifying the average number of biopsy devices product supplies used by major customer facilities across each product type at the regional/country level, annually
  • Identifying the percentage contribution of major customer facilities to the overall biopsy devices expenditure and usage at the regional/country level, annually
  • Extrapolating the annual usage patterns for various products across major customer facilities to estimate the size of each product segment at the regional/country level, annually
  • Identifying the percentage contributions of individual market segments and subsegments to the overall biopsy devices market at the regional/country level

Biopsy Devices Market Size Estimation: Bottom-Up Approach

Biopsy Devices Market Size, and Share

Source: MarketsandMarkets Analysis

Data Triangulation

After arriving at the overall market size from the market size estimation process explained above, the global biopsy devices market was split into segments and subsegments. Data triangulation and market breakdown procedures were employed to complete the overall market engineering process and arrive at the exact statistics for all segments and subsegments. The data was triangulated by studying various factors and trends from both the demand and supply sides. Additionally, the biopsy devices market was validated using top-down and bottom-up approaches.

Market Definition

Biopsy devices encompass a diverse range of medical instruments designed for the precise collection and extraction of tissue samples from the human body for diagnostic and research purposes. These devices play a pivotal role in modern healthcare, aiding in the detection, characterization, and monitoring of various medical conditions, especially cancer. They come in various forms, including needle-based biopsy tools, endoscopic devices, and surgical instruments, each tailored to specific clinical scenarios and anatomical locations. Over the years, biopsy device technologies have evolved significantly, with a focus on enhancing accuracy, reducing patient discomfort, and improving diagnostic yield. These innovations, combined with increasing cancer incidence rates and the need for early disease detection, have driven the growth of the biopsy devices market, making it an integral component of the broader healthcare landscape. As healthcare continues to advance, biopsy devices continue to be at the forefront of diagnostic and therapeutic interventions, contributing to improved patient outcomes and the advancement of medical knowledge.

Key Stakeholders

  • Biopsy devices product manufacturers
  • Original equipment manufacturers (OEMs)
  • Suppliers, distributors, and channel partners
  • Healthcare service providers
  • Hospitals and academic medical centers
  • Radiologists
  • Research laboratories
  • Health insurance providers
  • Government bodies/organizations
  • Regulatory bodies
  • Medical research institutes
  • Business research and consulting service providers
  • Venture capitalists and other public-private funding agencies
  • Market research and consulting firms

Objectives of the Study

  • To define, describe, and forecast the biopsy devices market based on product, guidance technique, application, end user, and region
  • To provide detailed information regarding the major factors influencing the growth of the market (drivers, restraints, opportunities, and challenges)
  • To strategically analyze micro markets with respect to individual growth trends, prospects, and contributions to the total market
  • To analyze opportunities in the market for stakeholders and provide details of the competitive landscape for market leaders
  • To forecast the revenue of the market segments with respect to four regions, namely, North America, Europe, the Asia Pacific, Latin America, Middle East and Africa
  • To profile the key players and comprehensively analyze their market ranking and core competencies
  • To benchmark players within the market using a proprietary competitive leadership mapping framework, which analyzes market players on various parameters within the broad categories of  market share and product footprint

Available Customizations

With the given market data, MarketsandMarkets offers customizations per the company’s specific needs. The following customization options are available for the present global biopsy devices market report:

Product Analysis

  • Product matrix, which gives a detailed comparison of the product portfolios of the top five companies

Company Information

  • Detailed analysis and profiling of additional market players (up to five)

Geographic Analysis

  • Further breakdown of the Rest of Europe biopsy devices market into Russia, Belgium, the Netherlands, Switzerland, Austria, Finland, Sweden, Poland, and Portugal, among others
  • Further breakdown of the Rest of Asia Pacific biopsy devices market into Singapore, Taiwan, New Zealand, Philippines, Malaysia, and other APAC countries
  • Further breakdown of the Rest of Latin America (RoLATAM), which comprises Argentina, Chile, Peru, Colombia, and Cuba
  • Further breakdown of the RoW market into Latin America and MEA regions
Custom Market Research Services

We will customize the research for you, in case the report listed above does not meet with your exact requirements. Our custom research will comprehensively cover the business information you require to help you arrive at strategic and profitable business decisions.

Request Customization

Instant Answers with GPT - Ask Now!

Ask real questions. Get complete answers !
Report Code
MD 5504
Published ON
Oct, 2023
Choose License Type
BUY NOW
  • SHARE
X
Request Customization
Speak to Analyst
Speak to Analyst
OR FACE-TO-FACE MEETING
PERSONALIZE THIS RESEARCH
  • Triangulate with your Own Data
  • Get Data as per your Format and Definition
  • Gain a Deeper Dive on a Specific Application, Geography, Customer or Competitor
  • Any level of Personalization
REQUEST A FREE CUSTOMIZATION
LET US HELP YOU!
  • What are the Known and Unknown Adjacencies Impacting the Biopsy Devices Market
  • What will your New Revenue Sources be?
  • Who will be your Top Customer; what will make them switch?
  • Defend your Market Share or Win Competitors
  • Get a Scorecard for Target Partners
CUSTOMIZED WORKSHOP REQUEST
  • Call Us
  • +1-888-600-6441 (Corporate office hours)
  • +1-888-600-6441 (US/Can toll free)
  • +44-800-368-9399 (UK office hours)
CONNECT WITH US
ABOUT TRUST ONLINE
©2024 MarketsandMarkets Research Private Ltd. All rights reserved
DMCA.com Protection Status Website Feedback