Carbon Footprint Management Market

Carbon Footprint Management Market Component (Solutions, and Services), Deployment Mode (On-premises, and Cloud), Organization Size (Corporates/Enterprises, Mid-Tier Enterprises, Small Businesses), Vertical & Region - Global Forecast to 2028

Report Code: EP 8589 Mar, 2023, by marketsandmarkets.com

[273 Pages Report] The global carbon footprint management market is projected to reach USD 30.8 billion by 2028 from an estimated USD 11.3 billion in 2023, at a CAGR of 22.2% during the forecast period. The market for carbon footprint management is primarily driven by rising energy demand by industries, the implementation of COP27 targets to limit global warming. Additionally, an increase in initiatives by governments to reduce carbon emissions is aiding the growth of the carbon footprint management market.

Carbon Footprint Management Market

To know about the assumptions considered for the study, Request for Free Sample Report

Carbon Footprint Management Market Dynamics

Driver: Increase in government initiatives for low carbon policy

Carbon footprint management systems can help in tracking, monitoring, and reducing emissions generated by homes and businesses and are supported by government initiatives. Policies and amends to reduce greenhouse gases and emission levels in the environment are made continuously by several governments and stakeholders across the world that are focusing on climate change. According to World Energy Outlook-2021, more than 120 countries announced new targets for emission reductions by 2030, and governments representing approximately 70% global CO2 emissions have pledged to bring emissions to net zero by 2050. To attain these targets, initiatives have been taken globally such as the Carbon Action Initiative and Net-Zero Government Initiative.

Restraints: High Initial Investment

The benefits of the economic progress with an associated energy consumption increase for undeveloped and developing countries are high. Carbon emission concerns people in these countries as well; however, when asked to rank issues it comes out to be the last and below security, food, education, health, and energy and transport related issues. It is considered near the bottom of the list in most countries, except for the most highly developing ones. The industries contributing to carbon emissions are transportation, electricity production, industry, commercial and residential, agriculture, land use and forestry. Deploying carbon footprint management solutions and working on mitigation measures requires some capital investment, which restricts companies in emerging countries with limited capital from investing in such solutions.

Opportunities: The shift Towards Cloud Computing and Paperless Economy

Cloud computing and paperless economy is being implemented on a large scale across global economies. Countries such as China, India, and the Middle East offer several subsidies for industries using these methods and sustainable platforms to prevent the release of GCG and other carbon gases Their implementation may require steps which involve using tools and filtration caps in factories and industries to decrease carbon emissions. Before using these tools, the carbon footprint management software is used to determine the emission levels and document data through the cloud or on-premises deployment, pushing the overall sales of carbon footprint management software.

Challenges: Challenges in comprehensively measuring, monitoring, and reporting Scope 3 emissions

Scope 3 emissions consist of all indirect emissions that occur in the value chain of a company. Scope 3 greenhouse gas (GHG) emissions are a critical component of overall emissions in the financial services industry. A growing body of research shows that scope 3 emissions can account for many times the impact of a company’s scope 1 and 2 emissions. For financial institutions, almost all emissions stem from the value chain. Several industries and investor initiatives are calling for the disclosure of scope 3 emissions. While scope 3 emissions are increasingly understood as an important risk indicator, it is also worth acknowledging that there are challenges involved in determining scope 3 emissions.

Carbon Footprint Management Market Size, and Share

To know about the assumptions considered for the study, download the pdf brochure

The services segment, by component, is expected to grow at the fastest rate during the forecast period

The carbon footprint management market, by component, is segmented into solutions and services. The effective provision of services is essential since it boosts operational effectiveness, system dependability, and cost savings for businesses. Consulting, integration and deployment, as well as support and maintenance are included in the services segment. Many firms and companies lack the technical expertise in carbon footprint management and hence there is a need for professional service providers. The urgency to integrate solutions in carbon footprint management by companies and businesses has increased the growth of the market for services at a faster pace.

The cloud segment, by  deployment mode, is expected to dominate the carbon footprint management market

By deployment mode, the cloud segment is estimated to be the largest in the carbon footprint management market during the forecast period. The deployment of a carbon footprint management software over cloud is cost-effective, highly scalable and provides easier execution, maintenance, and upgradation. Moreover, it offers benefits like security, control over data, speed, and all-time support making it the primary choice of customers.

By organization size, the small businesses segment is expected to lodge the highest growth rate in the carbon footprint management market during the forecast period

Carbon footprint management software can serve corporates/enterprises, mid-tier enterprises, and small businesses. Large enterprises like the corporate enterprises are among the early adopters of carbon management solutions due to the large sizes of their facilities and increased pressure from stakeholders. Small businesses, on the other hand, have traditionally not had regulatory/stakeholder pressure for emission/ESG disclosures due to the smaller scale of their emissions. However, anticipated binding regulations in several developed economies around the world and increasing pressure from investors on emissions disclosure is expected to drive the fast growth of this segment during the forecast period.

The manufacturing segment, by vertical, is expected to be the largest in the carbon footprint management market during the forecast period

The manufacturing industry has been identified amongst the top sources of carbon emissions globally. Some manufacturing companies have accepted the reality of carbon emissions, and a significant number of businesses are still looking for ways to reduce carbon emissions during the manufacturing process. The majority of manufacturing companies that are adopting low-carbon practices are not doing so merely for the benefit of the environment; rather, they are driven by a recognition of the risks (such as regulatory risk, competitive risk, litigation risk, reputation, and brand value risk) and other elements that are connected to non-compliance. The need to minimize these risks and ensure compliance is expected to drive the demand for carbon footprint management software during the forecast period.

Carbon Footprint Management Market Size, and Share

Key Players

IBM (US), Schneider Electric (France), Salesforce (US), SAP (Germany), ENGIE (France), Enviance (US), Isometrix (South Africa), ESP (New Zealand), Dakota Software (US), Accuvio (US), ProcessMap (US), Locus Technologies (US), NativeEnergy (US), EnergyCap (US), Carbon Footprint Ltd (UK), EcoTrack (US), Carbon Trust (UK), Envirosoft (Canada), Intelex (Canada), Enablon (France), and Trinity Consultants (US).

Get online access to the report on the World's First Market Intelligence Cloud

  • Easy to Download Historical Data & Forecast Numbers
  • Company Analysis Dashboard for high growth potential opportunities
  • Research Analyst Access for customization & queries
  • Competitor Analysis with Interactive dashboard
  • Latest News, Updates & Trend analysis
Request Sample

Scope of the Report

Report Metric

Details

Market Size available for years

2017–2028

Base year considered

2022

Forecast period

2023–2028

Forecast units

Value (USD Million/USD Billion)

Segments covered

By Component, By Deployment Mode, By Organization Size, By Vertical,  and Region

Geographies covered

Asia Pacific, North America, Europe, Middle East & Africa, and South America

Companies covered

Schneider Electric (France), SAP (Germany), IBM (US), Salesforce (US) and ENGIE (France), Isometrix (South Africa), Enviance (US), Dakota Software (US), ESP (New Zealand), Accuvio (US), Locus Technologies (US). ProcessMap (US), NativeEnergy (US), EcoTrack (UK), EnergyCap. (US), Carbon Trust (UK), Envirosoft (Canada), Intelex (Canada), Carbon Footprint Ltd (UK), Enablon (France), and Trinity Consultants (US).

This research report categorizes the carbon footprint management market based on Component, Deployment Mode, Organization Size, Vertical, and Region.

Based on Component:
  • Solutions
  • Services
    • Consulting
    • Integration & Deployment
    • Support & Maintenance
Based on deployment mode:
  • Cloud
  • On-premises
Based on organization size:
  • Corporates/Enterprises
  • Mid-Tier Enterprises
  • Small Businesses
Based on vertical:
  • Manufacturing
    • Food & Beverages
    • Metals & Mining
    • Chemical & Materials
    • Electronics & Consumer Goods
    • Automotive
    • Pharmaceutical & Healthcare
    • Others
  • Energy and Utilities
  • Residential and Commercial Buildings
  • Transportation and Logistics
  • IT and Telecom
  • Financial Servies
  • Government
Based on region:
  • North America
  • Europe
  • Asia Pacific
  • Middle East & Africa
  • South America

Recent Developments

  • In February 2023, Enablon and Makersite announced strategic collaboration to help enterprises reach ESG goals. The two industry leaders will help organizations manage Net Zero ambitions through decarbonizing supply chains. This involves data collection, modeling, reporting, planning, forecasting, and operational execution across all three Scopes of greenhouse gas (GHG) emissions.
  • In September 2022, Enviance acquired an ESG performance software platform and consultancy, Reporting 21. The Reporting 21 solution will be incorporated into Enviance/Cority’s Sustainability Cloud to better support customers in managing, reporting, and actioning their sustainability and ESG initiatives.
  • In July 2022, Trinity Consultants acquired an aquatic environmental consulting firm, Ecofish Research. This acquisition brings Trinity’s water ecology and aquatic sciences consulting service teams to approximately 250 professionals, with the ability to deliver a wide range of water ecology-related services.

Frequently Asked Questions (FAQ):

To speak to our analyst for a discussion on the above findings, click Speak to Analyst

TABLE OF CONTENTS
 
1 INTRODUCTION (Page No. - 44)
    1.1 STUDY OBJECTIVES 
    1.2 MARKET DEFINITION 
    1.3 INCLUSIONS AND EXCLUSIONS 
           TABLE 1 CARBON FOOTPRINT MANAGEMENT MARKET, BY COMPONENT
           TABLE 2 MARKET, BY DEPLOYMENT MODE
           TABLE 3 MARKET, BY ORGANIZATION SIZE
           TABLE 4 MARKET, BY VERTICAL
           TABLE 5 MARKET, BY REGION
    1.4 CARBON FOOTPRINT MANAGEMENT MARKET SEGMENTATION 
           1.4.1 GEOGRAPHIC SCOPE
           1.4.2 YEARS CONSIDERED
    1.5 CURRENCY CONSIDERED 
    1.6 LIMITATIONS 
    1.7 STAKEHOLDERS 
    1.8 SUMMARY OF CHANGES 
 
2 RESEARCH METHODOLOGY (Page No. - 50)
    2.1 RESEARCH DATA 
           FIGURE 1 RESEARCH DESIGN
    2.2 MARKET BREAKDOWN AND DATA TRIANGULATION 
           FIGURE 2 DATA TRIANGULATION
           2.2.1 SECONDARY DATA
                    2.2.1.1 Key data from secondary sources
           2.2.2 PRIMARY DATA
                    2.2.2.1 Breakdown of primaries
                    2.2.2.2 Key data from primary sources
                               FIGURE 3 BREAKDOWN OF PRIMARY INTERVIEWS: BY COMPANY TYPE, DESIGNATION,  AND REGION
                               FIGURE 4 MAIN METRICS CONSIDERED FOR ANALYZING AND ASSESSING DEMAND FOR CARBON FOOTPRINT MANAGEMENT
    2.3 MARKET SIZE ESTIMATION 
           2.3.1 BOTTOM-UP APPROACH
                    FIGURE 5 MARKET SIZE ESTIMATION METHODOLOGY: BOTTOM-UP APPROACH
           2.3.2 TOP-DOWN APPROACH
                    FIGURE 6 MARKET SIZE ESTIMATION METHODOLOGY: TOP-DOWN APPROACH
           2.3.3 DEMAND-SIDE ANALYSIS
                    2.3.3.1 Regional analysis
                    2.3.3.2 Country analysis
                    2.3.3.3 Demand-side assumptions
                    2.3.3.4 Demand-side calculations
           2.3.4 SUPPLY-SIDE ANALYSIS
                    FIGURE 7 KEY STEPS CONSIDERED FOR ASSESSING SUPPLY OF CARBON FOOTPRINT MANAGEMENT
                    FIGURE 8 SUPPLY-SIDE ANALYSIS
                    2.3.4.1 Supply-side calculations
                    2.3.4.2 Supply-side assumptions
           2.3.5 FORECAST
           2.3.6 IMPACT OF RECESSION
 
3 EXECUTIVE SUMMARY (Page No. - 62)
    TABLE 6 CARBON FOOTPRINT MANAGEMENT MARKET SNAPSHOT 
    FIGURE 9 NORTH AMERICA LED MARKET IN 2022 
    FIGURE 10 SOLUTIONS SEGMENT TO LEAD MARKET,  BY COMPONENT, FROM 2023 TO 2028 
    FIGURE 11 BY DEPLOYMENT MODE, CLOUD SEGMENT TO COMMAND MARKET THROUGHOUT FORECAST PERIOD 
    FIGURE 12 CORPORATES/ENTERPRISES SEGMENT TO DRIVE MARKET, BY ORGANIZATION SIZE, DURING FORECAST PERIOD 
    FIGURE 13 MANUFACTURING SEGMENT TO DOMINATE MARKET, BY VERTICAL, THROUGHOUT FORECAST PERIOD 
 
4 PREMIUM INSIGHTS (Page No. - 66)
    4.1 ATTRACTIVE OPPORTUNITIES FOR KEY PLAYERS IN CARBON FOOTPRINT MANAGEMENT MARKET 
           FIGURE 14 REGULATIONS FOR REDUCTION OF CARBON EMISSIONS TO BOOST MARKET BETWEEN 2023 AND 2028
    4.2 MARKET, BY REGION 
           FIGURE 15 ASIA PACIFIC TO GROW AT HIGHEST CAGR IN MARKET DURING FORECAST PERIOD
    4.3 NORTH AMERICA: MARKET, BY DEPLOYMENT MODE AND COUNTRY, 2022 
           FIGURE 16 CLOUD SEGMENT AND US ACCOUNTED FOR LARGEST MARKET SHARES IN NORTH AMERICA IN 2022
    4.4 MARKET, BY COMPONENT 
           FIGURE 17 SOLUTIONS SEGMENT TO DOMINATE MARKET IN 2028
    4.5 MARKET, BY SERVICES 
           FIGURE 18 CONSULTING SEGMENT TO LEAD MARKET IN 2028
    4.6 MARKET, BY DEPLOYMENT MODE 
           FIGURE 19 CLOUD SEGMENT TO ACCOUNT FOR LARGER SHARE OF MARKET IN 2028
    4.7 MARKET,  BY ORGANIZATION SIZE 
           FIGURE 20 CORPORATES/ENTERPRISES SEGMENT TO ACCOUNT FOR LARGEST MARKET SHARE IN 2028
    4.8 MARKET, BY VERTICAL 
           FIGURE 21 MANUFACTURING SEGMENT TO DOMINATE MARKET, BY VERTICAL, IN 2028
    4.9 MARKET,  BY MANUFACTURING VERTICAL 
           FIGURE 22 METALS & MINING SEGMENT TO LEAD MARKET, BY MANUFACTURING TYPE, IN 2028
 
5 MARKET OVERVIEW (Page No. - 71)
    5.1 INTRODUCTION 
    5.2 MARKET DYNAMICS 
           FIGURE 23 MARKET DYNAMICS FOR MARKET
           5.2.1 DRIVERS
                    5.2.1.1 Increasing government initiatives to reduce carbon emissions
                    5.2.1.2 Rising demand for energy consumption by industries
                    5.2.1.3 COP27 implementation to limit global warming
           5.2.2 RESTRAINTS
                    5.2.2.1 High initial investment
           5.2.3 OPPORTUNITIES
                    5.2.3.1 Shift toward cloud computing and paperless economy
           5.2.4 CHALLENGES
                    5.2.4.1 Challenges in comprehensively measuring, monitoring, and reporting Scope 3 emissions
    5.3 TECHNOLOGY ANALYSIS 
           5.3.1 BLOCKCHAIN-BASED CARBON FOOTPRINT MANAGEMENT DEVELOPMENT
    5.4 MARKET MAP 
           FIGURE 24 MARKET MAP: CARBON FOOTPRINT MANAGEMENT
           TABLE 7 ROLE OF CARBON FOOTPRINT MANAGEMENT IN ECOSYSTEM
    5.5 VALUE CHAIN ANALYSIS 
           FIGURE 25 VALUE CHAIN ANALYSIS
           5.5.1 CARBON FOOTPRINT MANAGEMENT SOFTWARE VENDORS
           5.5.2 SYSTEM INTEGRATORS AND SERVICE PROVIDERS
           5.5.3 END USERS
           5.5.4 POST-SALES SERVICES
    5.6 PRICING ANALYSIS 
           5.6.1 AVERAGE SELLING PRICE OF CARBON FOOTPRINT SOFTWARE SUBSCRIPTIONS, BY COMPANY
                    TABLE 8 AVERAGE SELLING PRICES OF CARBON FOOTPRINT SUBSCRIPTIONS, 2022
                    TABLE 9 INDICATIVE SELLING PRICE OF CARBON FOOTPRINT SOFTWARE SUBSCRIPTIONS, 2022
    5.7 KEY CONFERENCES & EVENTS, 2022–2024 
           TABLE 10 DETAILED LIST OF CONFERENCES & EVENTS
    5.8 REGULATORY BODIES, GOVERNMENT AGENCIES, AND OTHER ORGANIZATIONS 
           TABLE 11 NORTH AMERICA: LIST OF REGULATORY BODIES, GOVERNMENT AGENCIES, AND OTHER ORGANIZATIONS
           TABLE 12 EUROPE: LIST OF REGULATORY BODIES, GOVERNMENT AGENCIES, AND OTHER ORGANIZATIONS
           TABLE 13 ASIA PACIFIC: LIST OF REGULATORY BODIES, GOVERNMENT AGENCIES, AND OTHER ORGANIZATIONS
           TABLE 14 REST OF THE WORLD: LIST OF REGULATORY BODIES, GOVERNMENT AGENCIES, AND OTHER ORGANIZATIONS
    5.9 REGULATIONS RELATED TO CARBON FOOTPRINT MANAGEMENT 
           TABLE 15 REGULATIONS FOR CARBON FOOTPRINT MANAGEMENT
    5.10 STANDARDS RELATED TO CARBON FOOTPRINT MANAGEMENT 
           TABLE 16 STANDARDS FOR CARBON FOOTPRINT MANAGEMENT
    5.11 INNOVATIONS AND PATENT REGISTRATIONS 
                    TABLE 17 INNOVATIONS AND PATENT REGISTRATIONS, APRIL 2019–AUGUST 2022
    5.12 PORTER’S FIVE FORCES ANALYSIS 
                    FIGURE 26 PORTER’S FIVE FORCES ANALYSIS FOR MARKET
                    TABLE 18 PORTER’S FIVE FORCES ANALYSIS
           5.12.1 THREAT OF SUBSTITUTES
           5.12.2 BARGAINING POWER OF SUPPLIERS
           5.12.3 BARGAINING POWER OF BUYERS
           5.12.4 THREAT OF NEW ENTRANTS
           5.12.5 INTENSITY OF COMPETITIVE RIVALRY
    5.13 KEY STAKEHOLDERS AND BUYING CRITERIA 
           5.13.1 KEY STAKEHOLDERS IN BUYING PROCESS
                    FIGURE 27 INFLUENCE OF KEY STAKEHOLDERS ON BUYING PROCESS FOR TOP THREE END USERS
                    TABLE 19 INFLUENCE OF KEY STAKEHOLDERS ON BUYING PROCESS FOR TOP THREE END USERS
    5.14 BUYING CRITERIA 
                    FIGURE 28 INFLUENCE OF KEY STAKEHOLDERS ON BUYING PROCESS FOR TOP THREE  END USERS
                    TABLE 20 KEY BUYING CRITERIA FOR TOP THREE END USERS
    5.15 CASE STUDY ANALYSIS 
           5.15.1 SASFIN BANK LTD UTILIZES ISOMETRIX SOFTWARE TO MITIGATE RISK
                    5.15.1.1 Problem statement: 2022 – Risk mitigation
                    5.15.1.2 Solution
           5.15.2 BEN & JERRY’S OFFSET PROVIDES SEED FUNDING FOR MORE SUSTAINABLE AGRICULTURE
                    5.15.2.1 Problem statement: 2021 – Sustainable agriculture
                    5.15.2.2 Solution
 
6 CARBON FOOTPRINT MANAGEMENT MARKET, BY COMPONENT (Page No. - 97)
    6.1 INTRODUCTION 
           FIGURE 29 MARKET, BY COMPONENT, 2022
           TABLE 21 MARKET, BY COMPONENT,  2017–2021 (USD MILLION)
           TABLE 22 MARKET, BY COMPONENT,  2022–2028 (USD MILLION)
    6.2 SOLUTIONS 
           6.2.1 INCREASING FOCUS ON EMISSION REDUCTION PLANS
                    TABLE 23 SOLUTIONS: MARKET, BY REGION,  2017–2021 (USD MILLION)
                    TABLE 24 SOLUTIONS: MARKET, BY REGION,  2022–2028 (USD MILLION)
    6.3 SERVICES 
           6.3.1 NEED FOR HIGH EXPERTISE AND KNOWLEDGE ABOUT CARBON FOOTPRINT MANAGEMENT
                    TABLE 25 SERVICES: MARKET, BY REGION,  2017–2021 (USD MILLION)
                    TABLE 26 SERVICES: MARKET, BY REGION,  2022–2028 (USD MILLION)
                    TABLE 27 MARKET, BY SERVICES, 2017–2021 (USD MILLION)
                    TABLE 28 MARKET, BY SERVICES, 2022–2028 (USD MILLION)
           6.3.2 CONSULTING
                    TABLE 29 CONSULTING: MARKET, BY REGION,  2017–2021 (USD MILLION)
                    TABLE 30 CONSULTING: MARKET, BY REGION,  2022–2028 (USD MILLION)
           6.3.3 INTEGRATION AND DEPLOYMENT
                    TABLE 31 INTEGRATION AND DEPLOYMENT: MARKET,  BY REGION, 2017–2021 (USD MILLION)
                    TABLE 32 INTEGRATION AND DEPLOYMENT: MARKET,  BY REGION, 2022–2028 (USD MILLION)
           6.3.4 SUPPORT AND MAINTENANCE
                    TABLE 33 SUPPORT AND MAINTENANCE: MARKET, BY REGION, 2017–2021 (USD MILLION)
                    TABLE 34 SUPPORT AND MAINTENANCE: MARKET, BY REGION, 2022–2028 (USD MILLION)
 
7 CARBON FOOTPRINT MANAGEMENT MARKET,  BY DEPLOYMENT MODE (Page No. - 105)
    7.1 INTRODUCTION 
           FIGURE 30 MARKET, BY DEPLOYMENT MODE, 2022
           TABLE 35 MARKET, BY DEPLOYMENT MODE,  2017–2021 (USD MILLION)
           TABLE 36 MARKET, BY DEPLOYMENT MODE,  2022–2028 (USD MILLION)
    7.2 CLOUD 
           7.2.1 EASE OF EXECUTION AND INCREASED DATA SECURITY
                    TABLE 37 CLOUD: MARKET, BY REGION,  2017–2021 (USD MILLION)
                    TABLE 38 CLOUD: MARKET, BY REGION,  2022–2028 (USD MILLION)
    7.3 ON-PREMISES 
           7.3.1 LOWER ADOPTION RATES DUE TO INCREASING AUTOMATION
                    TABLE 39 ON-PREMISES: MARKET, BY REGION,  2017–2021 (USD MILLION)
                    TABLE 40 ON-PREMISES: MARKET, BY REGION,  2022–2028 (USD MILLION)
 
8 CARBON FOOTPRINT MANAGEMENT MARKET,  BY ORGANIZATION SIZE (Page No. - 109)
    8.1 INTRODUCTION 
           FIGURE 31 MARKET, BY ORGANIZATION SIZE, 2022
           TABLE 41 MARKET, BY ORGANIZATION SIZE,  2017–2021 (USD MILLION)
           TABLE 42 MARKET, BY ORGANIZATION SIZE,  2022–2028 (USD MILLION)
    8.2 CORPORATES/ENTERPRISES 
           8.2.1 RISING PRESSURE TO ADOPT SOLUTIONS
                    TABLE 43 CORPORATES/ENTERPRISES: MARKET, BY REGION, 2017–2021 (USD MILLION)
                    TABLE 44 CORPORATES/ENTERPRISES: MARKET, BY REGION, 2022–2028 (USD MILLION)
    8.3 MID-TIER ENTERPRISES 
           8.3.1 STAKEHOLDER SUPPORT TO GOVERN ADOPTION
                    TABLE 45 MID-TIER ENTERPRISES: MARKET, BY REGION, 2017–2021 (USD MILLION)
                    TABLE 46 MID-TIER ENTERPRISES: MARKET, BY REGION, 2022–2028 (USD MILLION)
    8.4 SMALL BUSINESSES 
           8.4.1 LACK OF AWARENESS AMONG SMALL BUSINESSES
                    TABLE 47 SMALL BUSINESSES: MARKET, BY REGION,  2017–2021 (USD MILLION)
                    TABLE 48 SMALL BUSINESSES: MARKET, BY REGION,  2022–2028 (USD MILLION)
 
9 CARBON FOOTPRINT MANAGEMENT MARKET, BY VERTICAL (Page No. - 114)
    9.1 INTRODUCTION 
           FIGURE 32 MARKET, BY VERTICAL, 2022
           TABLE 49 MARKET, BY VERTICAL, 2017–2021 (USD MILLION)
           TABLE 50 MARKET, BY VERTICAL, 2022–2028 (USD MILLION)
    9.2 MANUFACTURING 
           9.2.1 RISKS RELATED TO NON-COMPLIANCE TO INCREASE IMPLEMENTATION
                    TABLE 51 MANUFACTURING: MARKET, BY REGION,  2017–2021 (USD MILLION)
                    TABLE 52 MANUFACTURING: MARKET, BY REGION,  2022–2028 (USD MILLION)
                    TABLE 53 MARKET, BY MANUFACTURING,  2017–2021 (USD MILLION)
                    TABLE 54 MARKET, BY MANUFACTURING,  2022–2028 (USD MILLION)
           9.2.2 FOOD & BEVERAGES
                    9.2.2.1 Elimination of waste and inefficiency in production, distribution, and consumption
                               TABLE 55 FOOD & BEVERAGES: MARKET, BY REGION,  2017–2021 (USD MILLION)
                               TABLE 56 FOOD & BEVERAGES: MARKET,  BY REGION, 2022–2028 (USD MILLION)
           9.2.3 METALS & MINING
                    9.2.3.1 Significant role in reducing global carbon footprint
                               TABLE 57 METALS & MINING: MARKET, BY REGION,  2017–2021 (USD MILLION)
                               TABLE 58 METALS & MINING: MARKET, BY REGION,  2022–2028 (USD MILLION)
           9.2.4 CHEMICAL & MATERIALS
                    9.2.4.1 Importance of Scope 3 emission reporting
                               TABLE 59 CHEMICAL & MATERIALS: MARKET, BY REGION, 2017–2021 (USD MILLION)
                               TABLE 60 CHEMICAL & MATERIALS: MARKET, BY REGION, 2022–2028 (USD MILLION)
           9.2.5 ELECTRONICS & CONSUMER GOODS
                    9.2.5.1 Solutions to help set near-term and long-term carbon emission targets
                               TABLE 61 ELECTRONICS & CONSUMER GOODS: MARKET,  BY REGION, 2017–2021 (USD MILLION)
                               TABLE 62 ELECTRONICS & CONSUMER GOODS: MARKET,  BY REGION, 2022–2028 (USD MILLION)
           9.2.6 AUTOMOTIVE
                    9.2.6.1 Rising demand due to pressure from investors and government
                               TABLE 63 AUTOMOTIVE: MARKET, BY REGION,  2017–2021 (USD MILLION)
                               TABLE 64 AUTOMOTIVE: MARKET, BY REGION,  2022–2028 (USD MILLION)
           9.2.7 PHARMACEUTICAL & HEALTHCARE
                    9.2.7.1 Automation to increase adoption
                               TABLE 65 PHARMACEUTICAL & HEALTHCARE: MARKET,  BY REGION, 2017–2021 (USD MILLION)
                               TABLE 66 PHARMACEUTICAL & HEALTHCARE: MARKET,  BY REGION, 2022–2028 (USD MILLION)
           9.2.8 OTHERS
                    TABLE 67 OTHERS: MARKET, BY REGION,  2017–2021 (USD MILLION)
                    TABLE 68 OTHERS: MARKET, BY REGION,  2022–2028 (USD MILLION)
    9.3 ENERGY & UTILITIES 
           9.3.1 RISING DEMAND FOR ENERGY TO LEAD TO INCREASING EMISSIONS
                    TABLE 69 ENERGY & UTILITIES: MARKET, BY REGION,  2017–2021 (USD MILLION)
                    TABLE 70 ENERGY & UTILITIES: MARKET, BY REGION,  2022–2028 (USD MILLION)
    9.4 RESIDENTIAL & COMMERCIAL BUILDINGS 
           9.4.1 BENEFITS OF SIMULATION IN BUILDING ENERGY EFFICIENCY TO DRIVE MARKET
                    TABLE 71 RESIDENTIAL & COMMERCIAL BUILDINGS: MARKET, BY REGION, 2017–2021 (USD MILLION)
                    TABLE 72 RESIDENTIAL & COMMERCIAL BUILDINGS: MARKET, BY REGION, 2022–2028 (USD MILLION)
    9.5 TRANSPORTATION & LOGISTICS 
           9.5.1 IMPROVING EFFICIENCY AND REDUCING COMPLEXITY TO DRIVE DEMAND
                    TABLE 73 TRANSPORTATION & LOGISTICS: MARKET,  BY REGION, 2017–2021 (USD MILLION)
                    TABLE 74 TRANSPORTATION & LOGISTICS: MARKET,  BY REGION, 2022–2028 (USD MILLION)
    9.6 IT & TELECOM 
           9.6.1 FRAMEWORKS LESSENING IMPACT TO DRIVE MARKET
                    TABLE 75 IT & TELECOM: MARKET, BY REGION,  2017–2021 (USD MILLION)
                    TABLE 76 IT & TELECOM: MARKET, BY REGION,  2022–2028 (USD MILLION)
    9.7 FINANCIAL SERVICES 
           9.7.1 HIGH EMPHASIS ON LOWERING CARBON EMISSIONS
                    TABLE 77 FINANCIAL SERVICES: MARKET, BY REGION,  2017–2021 (USD MILLION)
                    TABLE 78 FINANCIAL SERVICES: MARKET, BY REGION,  2022–2028 (USD MILLION)
    9.8 GOVERNMENT 
           9.8.1 HIGHER CONTRIBUTION TOWARD CARBON REDUCTION OBJECTIVES
                    TABLE 79 GOVERNMENT: MARKET, BY REGION,  2017–2021 (USD MILLION)
                    TABLE 80 GOVERNMENT: MARKET, BY REGION,  2022–2028 (USD MILLION)
 
10 GEOGRAPHIC ANALYSIS (Page No. - 132)
     10.1 INTRODUCTION 
               FIGURE 33 MARKET IN ASIA PACIFIC TO GROW AT HIGHEST CAGR FROM 2023 TO 2028
               FIGURE 34 MARKET SHARE OF EACH  REGION, 2022 (%)
               TABLE 81 MARKET, BY REGION, 2017–2021 (USD MILLION)
               TABLE 82 MARKET, BY REGION, 2022–2028 (USD MILLION)
     10.2 NORTH AMERICA 
             10.2.1 IMPACT OF RECESSION
                       FIGURE 35 SNAPSHOT: NORTH AMERICA MARKET
             10.2.2 BY COMPONENT
                       TABLE 83 NORTH AMERICA: MARKET, BY COMPONENT,  2017–2021 (USD MILLION)
                       TABLE 84 NORTH AMERICA: MARKET, BY COMPONENT,  2022–2028 (USD MILLION)
             10.2.3 BY SERVICES
                       TABLE 85 NORTH AMERICA: MARKET, BY SERVICES,  2017–2021 (USD MILLION)
                       TABLE 86 NORTH AMERICA: MARKET, BY SERVICES,  2022–2028 (USD MILLION)
             10.2.4 BY DEPLOYMENT MODE
                       TABLE 87 NORTH AMERICA: MARKET, BY DEPLOYMENT MODE, 2017–2021 (USD MILLION)
                       TABLE 88 NORTH AMERICA: MARKET, BY DEPLOYMENT MODE, 2022–2028 (USD MILLION)
             10.2.5 BY ORGANIZATION SIZE
                       TABLE 89 NORTH AMERICA: MARKET, BY ORGANIZATION SIZE, 2017–2021 (USD MILLION)
                       TABLE 90 NORTH AMERICA: MARKET, BY ORGANIZATION SIZE, 2022–2028 (USD MILLION)
             10.2.6 BY VERTICAL
                       TABLE 91 NORTH AMERICA: MARKET, BY VERTICAL,  2017–2021 (USD MILLION)
                       TABLE 92 NORTH AMERICA: MARKET, BY VERTICAL,  2022–2028 (USD MILLION)
             10.2.7 BY MANUFACTURING VERTICAL
                       TABLE 93 NORTH AMERICA: MARKET, BY MANUFACTURING VERTICAL, 2017–2021 (USD MILLION)
                       TABLE 94 NORTH AMERICA: MARKET, BY MANUFACTURING VERTICAL,  2022–2028 (USD MILLION)
             10.2.8 BY COUNTRY
                       TABLE 95 NORTH AMERICA: MARKET, BY COUNTRY,  2017–2021 (USD MILLION)
                       TABLE 96 NORTH AMERICA: MARKET, BY COUNTRY,  2022–2028 (USD MILLION)
                       10.2.8.1 US
                                   10.2.8.1.1 Regulations on ESG disclosure and NDC targets to drive market
                                   10.2.8.1.2 By component
                                                 TABLE 97 US: MARKET, BY COMPONENT,  2017–2021 (USD MILLION)
                                                 TABLE 98 US: MARKET, BY COMPONENT,  2022–2028 (USD MILLION)
                                   10.2.8.1.3 By services
                                                 TABLE 99 US: MARKET, BY SERVICES,  2017–2021 (USD MILLION)
                                                 TABLE 100 US: MARKET, BY SERVICES,  2022–2028 (USD MILLION)
                                   10.2.8.1.4 By deployment mode
                                                 TABLE 101 US: MARKET, BY DEPLOYMENT MODE,  2017–2021 (USD MILLION)
                                                 TABLE 102 US: MARKET, BY DEPLOYMENT MODE,  2022–2028 (USD MILLION)
                                   10.2.8.1.5 By organization size
                                                 TABLE 103 US: MARKET, BY ORGANIZATION SIZE,  2017–2021 (USD MILLION)
                                                 TABLE 104 US: MARKET, BY ORGANIZATION SIZE,  2022–2028 (USD MILLION)
                       10.2.8.2 Canada
                                   10.2.8.2.1 Sector-wise emission reduction strategy to boost demand
                                   10.2.8.2.2 By component
                                                 TABLE 105 CANADA: MARKET, BY COMPONENT,  2017–2021 (USD MILLION)
                                                 TABLE 106 CANADA: MARKET, BY COMPONENT,  2022–2028 (USD MILLION)
                                   10.2.8.2.3 By services
                                                 TABLE 107 CANADA: MARKET, BY SERVICES,  2017–2021 (USD MILLION)
                                                 TABLE 108 CANADA: MARKET, BY SERVICES,  2022–2028 (USD MILLION)
                                   10.2.8.2.4 By deployment mode
                                                 TABLE 109 CANADA: MARKET, BY DEPLOYMENT MODE,  2017–2021 (USD MILLION)
                                                 TABLE 110 CANADA: MARKET, BY DEPLOYMENT MODE,  2022–2028 (USD MILLION)
                                   10.2.8.2.5 By organization size
                                                 TABLE 111 CANADA: MARKET, BY ORGANIZATION SIZE,  2017–2021 (USD MILLION)
                                                 TABLE 112 CANADA: MARKET, BY ORGANIZATION SIZE,  2022–2028 (USD MILLION)
                       10.2.8.3 Mexico
                                   10.2.8.3.1 Move toward energy efficient and low-carbon footprint sustainable buildings and cities
                                   10.2.8.3.2 By component
                                                 TABLE 113 MEXICO: MARKET, BY COMPONENT,  2017–2021 (USD MILLION)
                                                 TABLE 114 MEXICO: MARKET, BY COMPONENT,  2022–2028 (USD MILLION)
                                   10.2.8.3.3 By services
                                                 TABLE 115 MEXICO: MARKET, BY SERVICES,  2017–2021 (USD MILLION)
                                                 TABLE 116 MEXICO: MARKET, BY SERVICES,  2022–2028 (USD MILLION)
                                   10.2.8.3.4 By deployment mode
                                                 TABLE 117 MEXICO: MARKET, BY DEPLOYMENT MODE,  2017–2021 (USD MILLION)
                                                 TABLE 118 MEXICO: MARKET, BY DEPLOYMENT MODE,  2022–2028 (USD MILLION)
                                   10.2.8.3.5 By organization size
                                                 TABLE 119 MEXICO: MARKET, BY ORGANIZATION SIZE,  2017–2021 (USD MILLION)
                                                 TABLE 120 MEXICO: MARKET, BY ORGANIZATION SIZE,  2022–2028 (USD MILLION)
     10.3 EUROPE 
             10.3.1 IMPACT OF RECESSION
                       FIGURE 36 SNAPSHOT: EUROPE MARKET
             10.3.2 BY COMPONENT
                       TABLE 121 EUROPE: MARKET, BY COMPONENT,  2017–2021 (USD MILLION)
                       TABLE 122 EUROPE: MARKET, BY COMPONENT,  2022–2028 (USD MILLION)
             10.3.3 BY SERVICES
                       TABLE 123 EUROPE: MARKET, BY SERVICES,  2017–2021 (USD MILLION)
                       TABLE 124 EUROPE: MARKET, BY SERVICES,  2022–2028 (USD MILLION)
             10.3.4 BY DEPLOYMENT MODE
                       TABLE 125 EUROPE: MARKET, BY DEPLOYMENT MODE,  2017–2021 (USD MILLION)
                       TABLE 126 EUROPE: MARKET, BY DEPLOYMENT MODE,  2022–2028 (USD MILLION)
             10.3.5 BY ORGANIZATION SIZE
                       TABLE 127 EUROPE: MARKET, BY ORGANIZATION SIZE,  2017–2021 (USD MILLION)
                       TABLE 128 EUROPE: MARKET, BY ORGANIZATION SIZE,  2022–2028 (USD MILLION)
             10.3.6 BY VERTICAL
                       TABLE 129 EUROPE: MARKET, BY VERTICAL,  2017–2021 (USD MILLION)
                       TABLE 130 EUROPE: MARKET, BY VERTICAL,  2022–2028 (USD MILLION)
             10.3.7 BY MANUFACTURING VERTICAL
                       TABLE 131 EUROPE: MARKET, BY MANUFACTURING VERTICAL, 2017–2021 (USD MILLION)
                       TABLE 132 EUROPE: MARKET, BY MANUFACTURING VERTICAL,  2022–2028 (USD MILLION)
             10.3.8 BY COUNTRY
                       TABLE 133 EUROPE: MARKET, BY COUNTRY,  2017–2021 (USD MILLION)
                       TABLE 134 EUROPE: MARKET, BY COUNTRY,  2022–2028 (USD MILLION)
                       10.3.8.1 Germany
                                   10.3.8.1.1 Federal carbon and GHG neutrality act to boost deployment
                                   10.3.8.1.2 By component
                                                 TABLE 135 GERMANY: MARKET, BY COMPONENT,  2017–2021 (USD MILLION)
                                                 TABLE 136 GERMANY: MARKET, BY COMPONENT,  2022–2028 (USD MILLION)
                                   10.3.8.1.3 By services
                                                 TABLE 137 GERMANY: MARKET, BY SERVICES,  2017–2021 (USD MILLION)
                                                 TABLE 138 GERMANY: MARKET, BY SERVICES,  2022–2028 (USD MILLION)
                                   10.3.8.1.4 By deployment mode
                                                 TABLE 139 GERMANY: MARKET, BY DEPLOYMENT MODE,  2017–2021 (USD MILLION)
                                                 TABLE 140 GERMANY: MARKET, BY DEPLOYMENT MODE,  2022–2028 (USD MILLION)
                                   10.3.8.1.5 By organization size
                                                 TABLE 141 GERMANY: MARKET, BY ORGANIZATION SIZE,  2017–2021 (USD MILLION)
                                                 TABLE 142 GERMANY: MARKET, BY ORGANIZATION SIZE,  2022–2028 (USD MILLION)
                       10.3.8.2 France
                                   10.3.8.2.1 Initiatives to support decarbonization of emission-intensive sectors to boost market
                                   10.3.8.2.2 By component
                                                 TABLE 143 FRANCE: MARKET, BY COMPONENT,  2017–2021 (USD MILLION)
                                                 TABLE 144 FRANCE: MARKET, BY COMPONENT,  2022–2028 (USD MILLION)
                                   10.3.8.2.3 By services
                                                 TABLE 145 FRANCE: MARKET, BY SERVICES,  2017–2021 (USD MILLION)
                                                 TABLE 146 FRANCE: MARKET, BY SERVICES,  2022–2028 (USD MILLION)
                                   10.3.8.2.4 By deployment mode
                                                 TABLE 147 FRANCE: MARKET, BY DEPLOYMENT MODE,  2017–2021 (USD MILLION)
                                                 TABLE 148 FRANCE: MARKET, BY DEPLOYMENT MODE,  2022–2028 (USD MILLION)
                                   10.3.8.2.5 By organization size
                                                 TABLE 149 FRANCE: MARKET, BY ORGANIZATION SIZE,  2017–2021 (USD MILLION)
                                                 TABLE 150 FRANCE: MARKET, BY ORGANIZATION SIZE,  2022–2028 (USD MILLION)
                       10.3.8.3 UK
                                   10.3.8.3.1 Focus on reducing emissions from power, transport, and buildings sectors to propel market
                                   10.3.8.3.2 By component
                                                 TABLE 151 UK: MARKET, BY COMPONENT,  2017–2021 (USD MILLION)
                                                 TABLE 152 UK: MARKET, BY COMPONENT,  2022–2028 (USD MILLION)
                                   10.3.8.3.3 By services
                                                 TABLE 153 UK: MARKET, BY SERVICES,  2017–2021 (USD MILLION)
                                                 TABLE 154 UK: MARKET, BY SERVICES,  2022–2028 (USD MILLION)
                                   10.3.8.3.4 By deployment mode
                                                 TABLE 155 UK: MARKET, BY DEPLOYMENT MODE,  2017–2021 (USD MILLION)
                                                 TABLE 156 UK: MARKET, BY DEPLOYMENT MODE,  2022–2028 (USD MILLION)
                                   10.3.8.3.5 By organization size
                                                 TABLE 157 UK: MARKET, BY ORGANIZATION SIZE,  2017–2021 (USD MILLION)
                                                 TABLE 158 UK: MARKET, BY ORGANIZATION SIZE,  2022–2028 (USD MILLION)
                       10.3.8.4 Rest of Europe
                                   10.3.8.4.1 By component
                                                 TABLE 159 REST OF EUROPE: MARKET, BY COMPONENT,  2017–2021 (USD MILLION)
                                                 TABLE 160 REST OF EUROPE: MARKET, BY COMPONENT,  2022–2028 (USD MILLION)
                                   10.3.8.4.2 By services
                                                 TABLE 161 REST OF EUROPE: MARKET, BY SERVICES,  2017–2021 (USD MILLION)
                                                 TABLE 162 REST OF EUROPE: MARKET, BY SERVICES,  2022–2028 (USD MILLION)
                                   10.3.8.4.3 By deployment mode
                                                 TABLE 163 REST OF EUROPE: MARKET, BY DEPLOYMENT MODE, 2017–2021 (USD MILLION)
                                                 TABLE 164 REST OF EUROPE: MARKET, BY DEPLOYMENT MODE, 2022–2028 (USD MILLION)
                                   10.3.8.4.4 By organization size
                                                 TABLE 165 REST OF EUROPE: MARKET, BY ORGANIZATION SIZE, 2017–2021 (USD MILLION)
                                                 TABLE 166 REST OF EUROPE: MARKET, BY ORGANIZATION SIZE, 2022–2028 (USD MILLION)
     10.4 ASIA PACIFIC 
             10.4.1 IMPACT OF RECESSION
             10.4.2 BY COMPONENT
                       TABLE 167 ASIA PACIFIC: MARKET, BY COMPONENT,  2017–2021 (USD MILLION)
                       TABLE 168 ASIA PACIFIC: MARKET, BY COMPONENT,  2022–2028 (USD MILLION)
             10.4.3 BY SERVICES
                       TABLE 169 ASIA PACIFIC: MARKET, BY SERVICES,  2017–2021 (USD MILLION)
                       TABLE 170 ASIA PACIFIC: MARKET, BY SERVICES,  2022–2028 (USD MILLION)
             10.4.4 BY DEPLOYMENT MODE
                       TABLE 171 ASIA PACIFIC: MARKET, BY DEPLOYMENT MODE, 2017–2021 (USD MILLION)
                       TABLE 172 ASIA PACIFIC: MARKET, BY DEPLOYMENT MODE, 2022–2028 (USD MILLION)
             10.4.5 BY ORGANIZATION SIZE
                       TABLE 173 ASIA PACIFIC: MARKET, BY ORGANIZATION SIZE, 2017–2021 (USD MILLION)
                       TABLE 174 ASIA PACIFIC: MARKET, BY ORGANIZATION SIZE, 2022–2028 (USD MILLION)
             10.4.6 BY VERTICAL
                       TABLE 175 ASIA PACIFIC: MARKET, BY VERTICAL,  2017–2021 (USD MILLION)
                       TABLE 176 ASIA PACIFIC: MARKET, BY VERTICAL,  2022–2028 (USD MILLION)
             10.4.7 BY MANUFACTURING VERTICAL
                       TABLE 177 ASIA PACIFIC: MARKET, BY MANUFACTURING VERTICAL, 2017–2021 (USD MILLION)
                       TABLE 178 ASIA PACIFIC: MARKET, BY MANUFACTURING VERTICAL,  2022–2028 (USD MILLION)
             10.4.8 BY COUNTRY
                       TABLE 179 ASIA PACIFIC: MARKET, BY COUNTRY,  2017–2021 (USD MILLION)
                       TABLE 180 ASIA PACIFIC: MARKET, BY COUNTRY,  2022–2028 (USD MILLION)
                       10.4.8.1 China
                                   10.4.8.1.1 High returns associated with development and production of low-carbon technologies to drive market
                                   10.4.8.1.2 By component
                                                 TABLE 181 CHINA: MARKET, BY COMPONENT,  2017–2021 (USD MILLION)
                                                 TABLE 182 CHINA: MARKET, BY COMPONENT,  2022–2028 (USD MILLION)
                                   10.4.8.1.3 By services
                                                 TABLE 183 CHINA: MARKET, BY SERVICES,  2017–2021 (USD MILLION)
                                                 TABLE 184 CHINA: MARKET, BY SERVICES,  2022–2028 (USD MILLION)
                                   10.4.8.1.4 By deployment mode
                                                 TABLE 185 CHINA: MARKET, BY DEPLOYMENT MODE,  2017–2021 (USD MILLION)
                                                 TABLE 186 CHINA: MARKET, BY DEPLOYMENT MODE,  2022–2028 (USD MILLION)
                                   10.4.8.1.5 By organization size
                                                 TABLE 187 CHINA: MARKET, BY ORGANIZATION SIZE,  2017–2021 (USD MILLION)
                                                 TABLE 188 CHINA: MARKET, BY ORGANIZATION SIZE,  2022–2028 (USD MILLION)
                       10.4.8.2 India
                                   10.4.8.2.1 Goals to reduce carbon emissions by 1 billion tons by 2030 to fuel market growth
                                   10.4.8.2.2 By component
                                                 TABLE 189 INDIA: MARKET, BY COMPONENT,  2017–2021 (USD MILLION)
                                                 TABLE 190 INDIA: MARKET, BY COMPONENT,  2022–2028 (USD MILLION)
                                   10.4.8.2.3 By services
                                                 TABLE 191 INDIA: MARKET, BY SERVICES,  2017–2021 (USD MILLION)
                                                 TABLE 192 INDIA: MARKET, BY SERVICES,  2022–2028 (USD MILLION)
                                   10.4.8.2.4 By deployment mode
                                                 TABLE 193 INDIA: MARKET, BY DEPLOYMENT MODE,  2017–2021 (USD MILLION)
                                                 TABLE 194 INDIA: MARKET, BY DEPLOYMENT MODE,  2022–2028 (USD MILLION)
                                   10.4.8.2.5 By organization size
                                                 TABLE 195 INDIA: CARBON FOOTPRINT MANAGEMENT MARKET, BY ORGANIZATION SIZE,  2017–2021 (USD MILLION)
                                                 TABLE 196 INDIA: CARBON FOOTPRINT MANAGEMENT MARKET, BY ORGANIZATION SIZE,  2022–2028 (USD MILLION)
                       10.4.8.3 Japan
                                   10.4.8.3.1 Active participation by companies to achieve carbon neutrality goals to propel market
                                   10.4.8.3.2 By component
                                                 TABLE 197 JAPAN: CARBON FOOTPRINT MANAGEMENT MARKET, BY COMPONENT,  2017–2021 (USD MILLION)
                                                 TABLE 198 JAPAN: CARBON FOOTPRINT MANAGEMENT MARKET, BY COMPONENT,  2022–2028 (USD MILLION)
                                   10.4.8.3.3 By services
                                                 TABLE 199 JAPAN: CARBON FOOTPRINT MANAGEMENT MARKET, BY SERVICES,  2017–2021 (USD MILLION)
                                                 TABLE 200 JAPAN: CARBON FOOTPRINT MANAGEMENT MARKET, BY SERVICES,  2022–2028 (USD MILLION)
                                   10.4.8.3.4 By deployment mode
                                                 TABLE 201 JAPAN: CARBON FOOTPRINT MANAGEMENT MARKET, BY DEPLOYMENT MODE,  2017–2021 (USD MILLION)
                                                 TABLE 202 JAPAN: CARBON FOOTPRINT MANAGEMENT MARKET, BY DEPLOYMENT MODE,  2022–2028 (USD MILLION)
                                   10.4.8.3.5 By organization size
                                                 TABLE 203 JAPAN: CARBON FOOTPRINT MANAGEMENT MARKET, BY ORGANIZATION SIZE,  2017–2021 (USD MILLION)
                                                 TABLE 204 JAPAN: CARBON FOOTPRINT MANAGEMENT MARKET, BY ORGANIZATION SIZE,  2022–2028 (USD MILLION)
                       10.4.8.4 Singapore
                                   10.4.8.4.1 Active participation in multinational emission control efforts to drive market
                                   10.4.8.4.2 By component
                                                 TABLE 205 SINGAPORE: CARBON FOOTPRINT MANAGEMENT MARKET, BY COMPONENT,  2017–2021 (USD MILLION)
                                                 TABLE 206 SINGAPORE: CARBON FOOTPRINT MANAGEMENT MARKET, BY COMPONENT,  2022–2028 (USD MILLION)
                                   10.4.8.4.3 By services
                                                 TABLE 207 SINGAPORE: CARBON FOOTPRINT MANAGEMENT MARKET, BY SERVICES,  2017–2021 (USD MILLION)
                                                 TABLE 208 SINGAPORE: CARBON FOOTPRINT MANAGEMENT MARKET, BY SERVICES,  2022–2028 (USD MILLION)
                                   10.4.8.4.4 By deployment mode
                                                 TABLE 209 SINGAPORE: CARBON FOOTPRINT MANAGEMENT MARKET, BY DEPLOYMENT MODE, 2017–2021 (USD MILLION)
                                                 TABLE 210 SINGAPORE: CARBON FOOTPRINT MANAGEMENT MARKET, BY DEPLOYMENT MODE, 2022–2028 (USD MILLION)
                                   10.4.8.4.5 By organization size
                                                 TABLE 211 SINGAPORE: CARBON FOOTPRINT MANAGEMENT MARKET, BY ORGANIZATION SIZE, 2017–2021 (USD MILLION)
                                                 TABLE 212 SINGAPORE: CARBON FOOTPRINT MANAGEMENT MARKET, BY ORGANIZATION SIZE, 2022–2028 (USD MILLION)
                       10.4.8.5 Australia
                                   10.4.8.5.1 National framework on greenhouse gases and energy reporting to boost market growth
                                   10.4.8.5.2 By component
                                                 TABLE 213 AUSTRALIA: CARBON FOOTPRINT MANAGEMENT MARKET, BY COMPONENT,  2017–2021 (USD MILLION)
                                                 TABLE 214 AUSTRALIA: CARBON FOOTPRINT MANAGEMENT MARKET, BY COMPONENT,  2022–2028 (USD MILLION)
                                   10.4.8.5.3 By services
                                                 TABLE 215 AUSTRALIA: CARBON FOOTPRINT MANAGEMENT MARKET, BY SERVICES,  2017–2021 (USD MILLION)
                                                 TABLE 216 AUSTRALIA: CARBON FOOTPRINT MANAGEMENT MARKET, BY SERVICES,  2022–2028 (USD MILLION)
                                   10.4.8.5.4 By deployment mode
                                                 TABLE 217 AUSTRALIA: CARBON FOOTPRINT MANAGEMENT MARKET, BY DEPLOYMENT MODE, 2017–2021 (USD MILLION)
                                                 TABLE 218 AUSTRALIA: CARBON FOOTPRINT MANAGEMENT MARKET, BY DEPLOYMENT MODE, 2022–2028 (USD MILLION)
                                   10.4.8.5.5 By organization size
                                                 TABLE 219 AUSTRALIA: CARBON FOOTPRINT MANAGEMENT MARKET, BY ORGANIZATION SIZE, 2017–2021 (USD MILLION)
                                                 TABLE 220 AUSTRALIA: CARBON FOOTPRINT MANAGEMENT MARKET, BY ORGANIZATION SIZE, 2022–2028 (USD MILLION)
                       10.4.8.6 Rest of Asia Pacific
                                   10.4.8.6.1 By component
                                                 TABLE 221 REST OF ASIA PACIFIC: CARBON FOOTPRINT MANAGEMENT MARKET, BY COMPONENT, 2017–2021 (USD MILLION)
                                                 TABLE 222 REST OF ASIA PACIFIC: CARBON FOOTPRINT MANAGEMENT MARKET, BY COMPONENT, 2022–2028 (USD MILLION)
                                   10.4.8.6.2 By services
                                                 TABLE 223 REST OF ASIA PACIFIC: CARBON FOOTPRINT MANAGEMENT MARKET, BY SERVICES, 2017–2021 (USD MILLION)
                                                 TABLE 224 REST OF ASIA PACIFIC: CARBON FOOTPRINT MANAGEMENT MARKET, BY SERVICES, 2022–2028 (USD MILLION)
                                   10.4.8.6.3 By deployment mode
                                                 TABLE 225 REST OF ASIA PACIFIC: CARBON FOOTPRINT MANAGEMENT MARKET, BY DEPLOYMENT MODE, 2017–2021 (USD MILLION)
                                                 TABLE 226 REST OF ASIA PACIFIC: CARBON FOOTPRINT MANAGEMENT MARKET, BY DEPLOYMENT MODE, 2022–2028 (USD MILLION)
                                   10.4.8.6.4 By organization size
                                                 TABLE 227 REST OF ASIA PACIFIC: CARBON FOOTPRINT MANAGEMENT MARKET, BY ORGANIZATION SIZE, 2017–2021 (USD MILLION)
                                                 TABLE 228 REST OF ASIA PACIFIC: CARBON FOOTPRINT MANAGEMENT MARKET, BY ORGANIZATION SIZE, 2022–2028 (USD MILLION)
     10.5 MIDDLE EAST & AFRICA 
             10.5.1 IMPACT OF RECESSION
             10.5.2 BY COMPONENT
                       TABLE 229 MIDDLE EAST & AFRICA: CARBON FOOTPRINT MANAGEMENT MARKET, BY COMPONENT, 2017–2021 (USD MILLION)
                       TABLE 230 MIDDLE EAST & AFRICA: CARBON FOOTPRINT MANAGEMENT MARKET, BY COMPONENT, 2022–2028 (USD MILLION)
             10.5.3 BY SERVICES
                       TABLE 231 MIDDLE EAST & AFRICA: CARBON FOOTPRINT MANAGEMENT MARKET, BY SERVICES, 2017–2021 (USD MILLION)
                       TABLE 232 MIDDLE EAST & AFRICA: CARBON FOOTPRINT MANAGEMENT MARKET, BY SERVICES, 2022–2028 (USD MILLION)
             10.5.4 BY DEPLOYMENT MODE
                       TABLE 233 MIDDLE EAST & AFRICA: CARBON FOOTPRINT MANAGEMENT MARKET, BY DEPLOYMENT MODE, 2017–2021 (USD MILLION)
                       TABLE 234 MIDDLE EAST & AFRICA: CARBON FOOTPRINT MANAGEMENT MARKET, BY DEPLOYMENT MODE, 2022–2028 (USD MILLION)
             10.5.5 BY ORGANIZATION SIZE
                       TABLE 235 MIDDLE EAST & AFRICA: CARBON FOOTPRINT MANAGEMENT MARKET, BY ORGANIZATION SIZE, 2017–2021 (USD MILLION)
                       TABLE 236 MIDDLE EAST & AFRICA: CARBON FOOTPRINT MANAGEMENT MARKET, BY ORGANIZATION SIZE, 2022–2028 (USD MILLION)
             10.5.6 BY VERTICAL
                       TABLE 237 MIDDLE EAST & AFRICA: CARBON FOOTPRINT MANAGEMENT MARKET, BY VERTICAL, 2017–2021 (USD MILLION)
                       TABLE 238 MIDDLE EAST & AFRICA: CARBON FOOTPRINT MANAGEMENT MARKET, BY VERTICAL, 2022–2028 (USD MILLION)
             10.5.7 BY MANUFACTURING VERTICAL
                       TABLE 239 MIDDLE EAST & AFRICA: CARBON FOOTPRINT MANAGEMENT MARKET,  BY MANUFACTURING VERTICAL, 2017–2021 (USD MILLION)
                       TABLE 240 MIDDLE EAST & AFRICA: CARBON FOOTPRINT MANAGEMENT MARKET,  BY MANUFACTURING VERTICAL, 2022–2028 (USD MILLION)
             10.5.8 BY COUNTRY
                       TABLE 241 MIDDLE EAST & AFRICA: CARBON FOOTPRINT MANAGEMENT MARKET, BY COUNTRY, 2017–2021 (USD MILLION)
                       TABLE 242 MIDDLE EAST & AFRICA: CARBON FOOTPRINT MANAGEMENT MARKET, BY COUNTRY, 2022–2028 (USD MILLION)
                       10.5.8.1 Saudi Arabia
                                   10.5.8.1.1 Launch of government initiatives to tackle emissions to propel market
                                   10.5.8.1.2 By component
                                                 TABLE 243 SAUDI ARABIA: CARBON FOOTPRINT MANAGEMENT MARKET, BY COMPONENT,  2017–2021 (USD MILLION)
                                                 TABLE 244 SAUDI ARABIA: CARBON FOOTPRINT MANAGEMENT MARKET, BY COMPONENT,  2022–2028 (USD MILLION)
                                   10.5.8.1.3 By services
                                                 TABLE 245 SAUDI ARABIA: CARBON FOOTPRINT MANAGEMENT MARKET, BY SERVICES,  2017–2021 (USD MILLION)
                                                 TABLE 246 SAUDI ARABIA: CARBON FOOTPRINT MANAGEMENT MARKET, BY SERVICES,  2022–2028 (USD MILLION)
                                   10.5.8.1.4 By deployment mode
                                                 TABLE 247 SAUDI ARABIA: CARBON FOOTPRINT MANAGEMENT MARKET, BY DEPLOYMENT MODE, 2017–2021 (USD MILLION)
                                                 TABLE 248 SAUDI ARABIA: CARBON FOOTPRINT MANAGEMENT MARKET, BY DEPLOYMENT MODE, 2022–2028 (USD MILLION)
                                   10.5.8.1.5 By organization size
                                                 TABLE 249 SAUDI ARABIA: CARBON FOOTPRINT MANAGEMENT MARKET, BY ORGANIZATION SIZE, 2017–2021 (USD MILLION)
                                                 TABLE 250 SAUDI ARABIA: CARBON FOOTPRINT MANAGEMENT MARKET, BY ORGANIZATION SIZE, 2022–2028 (USD MILLION)
                       10.5.8.2 UAE
                                   10.5.8.2.1 Initiatives to improve quality of environment to boost market growth
                                   10.5.8.2.2 By component
                                                 TABLE 251 UAE: CARBON FOOTPRINT MANAGEMENT MARKET, BY COMPONENT,  2017–2021 (USD MILLION)
                                                 TABLE 252 UAE: CARBON FOOTPRINT MANAGEMENT MARKET, BY COMPONENT,  2022–2028 (USD MILLION)
                                   10.5.8.2.3 By services
                                                 TABLE 253 UAE: CARBON FOOTPRINT MANAGEMENT MARKET, BY SERVICES,  2017–2021 (USD MILLION)
                                                 TABLE 254 UAE: CARBON FOOTPRINT MANAGEMENT MARKET, BY SERVICES,  2022–2028 (USD MILLION)
                                   10.5.8.2.4 By deployment mode
                                                 TABLE 255 UAE: CARBON FOOTPRINT MANAGEMENT MARKET, BY DEPLOYMENT MODE,  2017–2021 (USD MILLION)
                                                 TABLE 256 UAE: CARBON FOOTPRINT MANAGEMENT MARKET, BY DEPLOYMENT MODE,  2022–2028 (USD MILLION)
                                   10.5.8.2.5 By organization size
                                                 TABLE 257 UAE: CARBON FOOTPRINT MANAGEMENT MARKET, BY ORGANIZATION SIZE,  2017–2021 (USD MILLION)
                                                 TABLE 258 UAE: CARBON FOOTPRINT MANAGEMENT MARKET, BY ORGANIZATION SIZE,  2022–2028 (USD MILLION)
                       10.5.8.3 Rest of Middle East & Africa
                                   10.5.8.3.1 By component
                                                 TABLE 259 REST OF MIDDLE EAST & AFRICA: CARBON FOOTPRINT MANAGEMENT MARKET,  BY COMPONENT, 2017–2021 (USD MILLION)
                                                 TABLE 260 REST OF MIDDLE EAST & AFRICA: CARBON FOOTPRINT MANAGEMENT MARKET,  BY COMPONENT, 2022–2028 (USD MILLION)
                                   10.5.8.3.2 By services
                                                 TABLE 261 REST OF MIDDLE EAST & AFRICA: CARBON FOOTPRINT MANAGEMENT MARKET,  BY SERVICES, 2017–2021 (USD MILLION)
                                                 TABLE 262 REST OF MIDDLE EAST & AFRICA: CARBON FOOTPRINT MANAGEMENT MARKET,  BY SERVICES, 2022–2028 (USD MILLION)
                                   10.5.8.3.3 By deployment mode
                                                 TABLE 263 REST OF MIDDLE EAST & AFRICA: CARBON FOOTPRINT MANAGEMENT MARKET,  BY DEPLOYMENT MODE, 2017–2021 (USD MILLION)
                                                 TABLE 264 REST OF MIDDLE EAST & AFRICA: CARBON FOOTPRINT MANAGEMENT MARKET,  BY DEPLOYMENT MODE, 2022–2028 (USD MILLION)
                                   10.5.8.3.4 By organization size
                                                 TABLE 265 REST OF MIDDLE EAST & AFRICA: CARBON FOOTPRINT MANAGEMENT MARKET,  BY ORGANIZATION SIZE, 2017–2021 (USD MILLION)
                                                 TABLE 266 REST OF MIDDLE EAST & AFRICA: CARBON FOOTPRINT MANAGEMENT MARKET,  BY ORGANIZATION SIZE, 2022–2028 (USD MILLION)
     10.6 SOUTH AMERICA 
             10.6.1 IMPACT OF RECESSION
             10.6.2 BY COMPONENT
                       TABLE 267 SOUTH AMERICA: CARBON FOOTPRINT MANAGEMENT MARKET, BY COMPONENT,  2017–2021 (USD MILLION)
                       TABLE 268 SOUTH AMERICA: CARBON FOOTPRINT MANAGEMENT MARKET, BY COMPONENT,  2022–2028 (USD MILLION)
             10.6.3 BY SERVICES
                       TABLE 269 SOUTH AMERICA: CARBON FOOTPRINT MANAGEMENT MARKET, BY SERVICES,  2017–2021 (USD MILLION)
                       TABLE 270 SOUTH AMERICA: CARBON FOOTPRINT MANAGEMENT MARKET, BY SERVICES,  2022–2028 (USD MILLION)
             10.6.4 BY DEPLOYMENT MODE
                       TABLE 271 SOUTH AMERICA: CARBON FOOTPRINT MANAGEMENT MARKET, BY DEPLOYMENT MODE, 2017–2021 (USD MILLION)
                       TABLE 272 SOUTH AMERICA: CARBON FOOTPRINT MANAGEMENT MARKET, BY DEPLOYMENT MODE, 2022–2028 (USD MILLION)
             10.6.5 BY ORGANIZATION SIZE
                       TABLE 273 SOUTH AMERICA: CARBON FOOTPRINT MANAGEMENT MARKET, BY ORGANIZATION SIZE, 2017–2021 (USD MILLION)
                       TABLE 274 SOUTH AMERICA: CARBON FOOTPRINT MANAGEMENT MARKET, BY ORGANIZATION SIZE, 2022–2028 (USD MILLION)
             10.6.6 BY VERTICAL
                       TABLE 275 SOUTH AMERICA: CARBON FOOTPRINT MANAGEMENT MARKET, BY VERTICAL,  2017–2021 (USD MILLION)
                       TABLE 276 SOUTH AMERICA: CARBON FOOTPRINT MANAGEMENT MARKET, BY VERTICAL,  2022–2028 (USD MILLION)
             10.6.7 BY MANUFACTURING VERTICAL
                       TABLE 277 SOUTH AMERICA: CARBON FOOTPRINT MANAGEMENT MARKET, BY MANUFACTURING VERTICAL, 2017–2021 (USD MILLION)
                       TABLE 278 SOUTH AMERICA: CARBON FOOTPRINT MANAGEMENT MARKET, BY MANUFACTURING VERTICAL, 2022–2028 (USD MILLION)
             10.6.8 BY COUNTRY
                       TABLE 279 SOUTH AMERICA: CARBON FOOTPRINT MANAGEMENT MARKET, BY COUNTRY,  2017–2021 (USD MILLION)
                       TABLE 280 SOUTH AMERICA: CARBON FOOTPRINT MANAGEMENT MARKET, BY COUNTRY,  2022–2028 (USD MILLION)
                       10.6.8.1 Brazil
                                   10.6.8.1.1 Focus on CO2 emission reduction to meet climate neutrality goals to drive demand
                                   10.6.8.1.2 By component
                                                 TABLE 281 BRAZIL: CARBON FOOTPRINT MANAGEMENT MARKET, BY COMPONENT,  2017–2021 (USD MILLION)
                                                 TABLE 282 BRAZIL: CARBON FOOTPRINT MANAGEMENT MARKET, BY COMPONENT,  2022–2028 (USD MILLION)
                                   10.6.8.1.3 By services
                                                 TABLE 283 BRAZIL: CARBON FOOTPRINT MANAGEMENT MARKET, BY SERVICES,  2017–2021 (USD MILLION)
                                                 TABLE 284 BRAZIL: CARBON FOOTPRINT MANAGEMENT MARKET, BY SERVICES,  2022–2028 (USD MILLION)
                                   10.6.8.1.4 By deployment mode
                                                 TABLE 285 BRAZIL: CARBON FOOTPRINT MANAGEMENT MARKET, BY DEPLOYMENT MODE,  2017–2021 (USD MILLION)
                                                 TABLE 286 BRAZIL: CARBON FOOTPRINT MANAGEMENT MARKET, BY DEPLOYMENT MODE,  2022–2028 (USD MILLION)
                                   10.6.8.1.5 By organization size
                                                 TABLE 287 BRAZIL: CARBON FOOTPRINT MANAGEMENT MARKET, BY ORGANIZATION SIZE,  2017–2021 (USD MILLION)
                                                 TABLE 288 BRAZIL: CARBON FOOTPRINT MANAGEMENT MARKET, BY ORGANIZATION SIZE,  2022–2028 (USD MILLION)
                       10.6.8.2 Rest of South America
                                   10.6.8.2.1 By component
                                                 TABLE 289 REST OF SOUTH AMERICA: CARBON FOOTPRINT MANAGEMENT MARKET,  BY COMPONENT, 2017–2021 (USD MILLION)
                                                 TABLE 290 REST OF SOUTH AMERICA: CARBON FOOTPRINT MANAGEMENT MARKET,  BY COMPONENT, 2022–2028 (USD MILLION)
                                   10.6.8.2.2 By services
                                                 TABLE 291 REST OF SOUTH AMERICA: CARBON FOOTPRINT MANAGEMENT MARKET, BY SERVICES, 2017–2021 (USD MILLION)
                                                 TABLE 292 REST OF SOUTH AMERICA: CARBON FOOTPRINT MANAGEMENT MARKET, BY SERVICES, 2022–2028 (USD MILLION)
                                   10.6.8.2.3 By deployment mode
                                                 TABLE 293 REST OF SOUTH AMERICA: CARBON FOOTPRINT MANAGEMENT MARKET, BY DEPLOYMENT MODE, 2017–2021 (USD MILLION)
                                                 TABLE 294 REST OF SOUTH AMERICA: CARBON FOOTPRINT MANAGEMENT MARKET, BY DEPLOYMENT MODE, 2022–2028 (USD MILLION)
                                   10.6.8.2.4 By organization size
                                                 TABLE 295 REST OF SOUTH AMERICA: CARBON FOOTPRINT MANAGEMENT MARKET,  BY ORGANIZATION SIZE, 2017–2021 (USD MILLION)
                                                 TABLE 296 REST OF SOUTH AMERICA: CARBON FOOTPRINT MANAGEMENT MARKET,  BY ORGANIZATION SIZE, 2022–2028 (USD MILLION)
 
11 COMPETITIVE LANDSCAPE (Page No. - 211)
     11.1 STRATEGIES ADOPTED BY KEY PLAYERS 
               TABLE 297 OVERVIEW OF KEY STRATEGIES ADOPTED BY TOP PLAYERS, AUGUST 2018 – APRIL 2022
     11.2 MARKET SHARE ANALYSIS OF TOP FIVE PLAYERS 
               TABLE 298 DEGREE OF COMPETITION
               FIGURE 37 CARBON FOOTPRINT MANAGEMENT MARKET SHARE ANALYSIS, 2021
     11.3 REVENUE ANALYSIS OF TOP FIVE PLAYERS 
               FIGURE 38 TOP PLAYERS IN CARBON FOOTPRINT MANAGEMENT MARKET  FROM 2017 TO 2021
     11.4 COMPANY EVALUATION QUADRANT 
             11.4.1 STARS
             11.4.2 PERVASIVE PLAYERS
             11.4.3 EMERGING LEADERS
             11.4.4 PARTICIPANTS
                       FIGURE 39 COMPETITIVE LEADERSHIP MAPPING, 2021
     11.5 STARTUP/SME EVALUATION QUADRANT, 2021 
             11.5.1 PROGRESSIVE COMPANIES
             11.5.2 RESPONSIVE COMPANIES
             11.5.3 DYNAMIC COMPANIES
             11.5.4 STARTING BLOCKS
                       FIGURE 40 STARTUP/SME EVALUATION QUADRANT, 2021
     11.6 COMPETITIVE BENCHMARKING 
               TABLE 299 DETAILED LIST OF KEY STARTUPS/SMES
               TABLE 300 COMPETITIVE BENCHMARKING OF KEY PLAYERS [STARTUPS/SMES]
     11.7 COMPANY FOOTPRINT 
               TABLE 301 BY COMPONENT: COMPANY FOOTPRINT
               TABLE 302 BY DEPLOYMENT MODE: COMPANY FOOTPRINT
               TABLE 303 BY VERTICAL: COMPANY FOOTPRINT
               TABLE 304 BY REGION: COMPANY FOOTPRINT
               TABLE 305 COMPANY FOOTPRINT
     11.8 COMPETITIVE SCENARIO 
               TABLE 306 PRODUCT LAUNCHES, MARCH 2019 – AUGUST 2021
               TABLE 307 DEALS, JANUARY 2020– FEBRUARY 2023
 
12 COMPANY PROFILES (Page No. - 230)
(Business overview, Products/Solutions/Services offered, Recent Developments, MNM view)*
     12.1 KEY PLAYERS 
             12.1.1 SAP
                       TABLE 308 SAP: COMPANY OVERVIEW
                       FIGURE 41 SAP: COMPANY SNAPSHOT (2021)
                       TABLE 309 SAP: PRODUCTS/SOLUTIONS/SERVICES OFFERED
                       TABLE 310 SAP: OTHERS
             12.1.2 SALESFORCE
                       TABLE 311 SALESFORCE: COMPANY OVERVIEW
                       FIGURE 42 SALESFORCE GROUP: COMPANY SNAPSHOT (2022)
                       TABLE 312 SALESFORCE: PRODUCTS/SOLUTIONS/SERVICES OFFERED
             12.1.3 ENGIE
                       TABLE 313 ENGIE: COMPANY OVERVIEW
                       FIGURE 43 ENGIE: COMPANY SNAPSHOT (2021)
                       TABLE 314 ENGIE: PRODUCTS/SOLUTIONS/SERVICES OFFERED
             12.1.4 SCHNEIDER ELECTRIC
                       TABLE 315 SCHNEIDER ELECTRIC: COMPANY OVERVIEW
                       FIGURE 44 SCHNEIDER ELECTRIC: COMPANY SNAPSHOT (2021)
                       TABLE 316 PRODUCTS/SOLUTIONS/SERVICES OFFERED
                       TABLE 317 SCHNEIDER ELECTRIC: DEALS
             12.1.5 IBM
                       TABLE 318 IBM: COMPANY OVERVIEW
                       FIGURE 45 IBM: COMPANY SNAPSHOT (2021)
                       TABLE 319 IBM: PRODUCTS/SOLUTIONS/SERVICES OFFERED
             12.1.6 CARBON FOOTPRINT
                       TABLE 320 CARBON FOOTPRINT: COMPANY OVERVIEW
                       TABLE 321 CARBON FOOTPRINT: PRODUCTS/SOLUTIONS/SERVICES OFFERED
             12.1.7 ISOMETRIX
                       TABLE 322 ISOMETRIX: ISOMETRIX: COMPANY OVERVIEW
                       TABLE 323 ISOMETRIX: PRODUCTS/SOLUTIONS/SERVICES OFFERED
                       TABLE 324 ISOMETRIX: PRODUCT LAUNCHES
                       TABLE 325 ISOMETRIX: OTHERS
             12.1.8 INTELEX
                       TABLE 326 INTELEX: COMPANY OVERVIEW
                       TABLE 327 INTELEX: PRODUCTS/SOLUTIONS/SERVICES OFFERED
                       TABLE 328 INTELEX: OTHERS
             12.1.9 TRINITY CONSULTANTS
                       TABLE 329 TRINITY CONSULTANTS: COMPANY OVERVIEW
                       TABLE 330 TRINITY CONSULTANTS: PRODUCTS/SOLUTIONS/SERVICES OFFERED
                       TABLE 331 TRINITY CONSULTANTS: OTHERS
             12.1.10 DAKOTA SOFTWARE
                       TABLE 332 DAKOTA SOFTWARE: COMPANY OVERVIEW
                       TABLE 333 DAKOTA SOFTWARE: PRODUCTS/SOLUTIONS/SERVICES OFFERED
                       TABLE 334 DAKOTA SOFTWARE: OTHERS
             12.1.11 ENABLON
                       TABLE 335 ENABLON: COMPANY OVERVIEW
                       TABLE 336 ENABLON: PRODUCTS/SOLUTIONS/SERVICES OFFERED
                       TABLE 337 ENABLON:OTHERS
             12.1.12 ENVIROSOFT
                       TABLE 338 ENVIROSOFT: COMPANY OVERVIEW
                       TABLE 339 ENVIROSOFT: PRODUCTS/SOLUTIONS/SERVICES OFFERED
             12.1.13 ENVIANCE
                       TABLE 340 ENVIANCE: COMPANY OVERVIEW
                       TABLE 341 ENVIANCE: PRODUCTS/SOLUTIONS/SERVICES OFFERED
                       TABLE 342 ENVIANCE: PRODUCT LAUNCHES
                       TABLE 343 ENVIANCE: OTHERS
             12.1.14 ACCUVIO
                       TABLE 344 ACCUVIO: COMPANY OVERVIEW
                       TABLE 345 ACCUVIO: PRODUCTS/SOLUTIONS/SERVICES OFFERED
                       TABLE 346 ACCUVIO: OTHERS
             12.1.15 ESP
                       TABLE 347 ESP: COMPANY OVERVIEW
                       TABLE 348 ESP: PRODUCTS/SOLUTIONS/SERVICES OFFERED
     12.2 OTHER PLAYERS 
             12.2.1 PROCESSMAP
             12.2.2 NATIVEENERGY
             12.2.3 ENERGYCAP
             12.2.4 LOCUS TECHNOLOGIES
             12.2.5 ECOTRACK
             12.2.6 CARBON TRUST
*Details on Business overview, Products/Solutions/Services offered, Recent Developments, MNM view might not be captured in case of unlisted companies.
 
13 APPENDIX (Page No. - 266)
     13.1 INSIGHTS FROM INDUSTRY EXPERTS 
     13.2 DISCUSSION GUIDE 
     13.3 KNOWLEDGESTORE: MARKETSANDMARKETS’ SUBSCRIPTION PORTAL 
     13.4 CUSTOMIZATION OPTIONS 
     13.5 RELATED REPORTS 
     13.6 AUTHOR DETAILS 

This study involved four major activities in estimating the current size of the carbon footprint management market. Exhaustive secondary research was done to collect information on the market, peer market, and parent market. The next step was to validate these findings, assumptions, and market sizing with industry experts across the value chain through primary research. Both top-down and bottom-up approaches were used to estimate the total market size. After that, the market breakdown and data triangulation were done to estimate the market size of the segments and sub-segments.

Secondary Research

This research study involved extensive secondary sources, directories, and databases, such as Hoover’s, Bloomberg BusinessWeek, Factiva, Magazine and OneSource, to identify and collect information useful for a technical, market-oriented, and commercial study of the global carbon footprint management market. The other secondary sources included annual reports, press releases & investor presentations of companies, white papers, certified publications, articles by recognized authors, manufacturer associations, trade directories, and databases. 

Primary Research

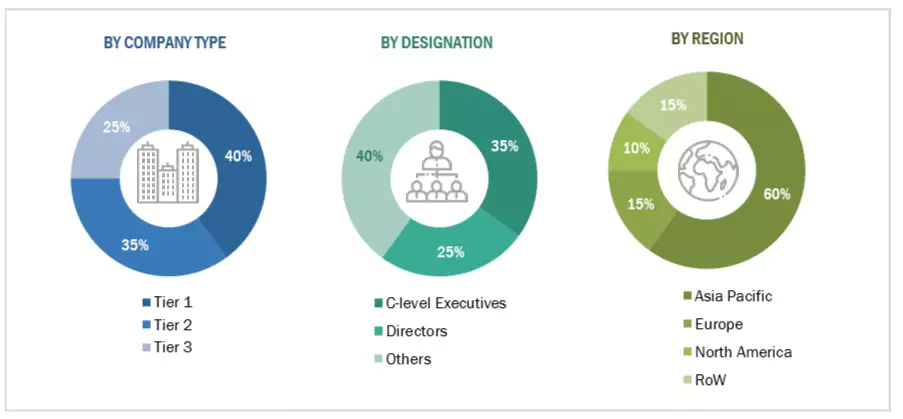
The carbon footprint management market comprises several stakeholders, such as end-product manufacturers, service providers, and end-users in the supply chain. This market's demand side is characterized by verticals, such as manufacturing, energy & utilities, residential & commercial buildings, transportation & logistics, IT & telecom, financial services and government. The supply-side is characterized by carbon footprint management manufacturers and others. Various primary sources from both the supply and demand sides of the market were interviewed to obtain qualitative and quantitative information. The breakdown of primary respondents is given below:
Carbon Footprint Management Market Size, and Share

To know about the assumptions considered for the study, download the pdf brochure

Market Size Estimation

Both top-down and bottom-up approaches have been used to estimate and validate the size of the global carbon footprint management market and its dependent submarkets. These methods were also used extensively to estimate the size of various sub-segments in the market. The research methodology used to estimate the market size includes the following:

  • The industry and market's key players have been identified through extensive secondary research, and their market share in the respective regions has been determined through both primary and secondary research.
  • In terms of value, the industry’s supply chain and market size have been determined through primary and secondary research processes.
  • All percentage shares, splits, and breakdowns have been determined using secondary sources and verified through primary sources.

Global Carbon Footprint Management Market Size: Bottom-Up Approach

Carbon Footprint Management Market Size, and Share

To know about the assumptions considered for the study, Request for Free Sample Report

Data Triangulation

After arriving at the overall market size—using the market size estimation processes as explained above—the market was split into several segments and subsegments. To complete the overall market engineering process and arrive at the exact statistics of each market segment and subsegment, data triangulation, and market breakdown procedures were employed, wherever applicable. The data was triangulated by studying various factors and trends from both the demand and supply sides.

Report Objectives

  • To define, describe, segment, and forecast the carbon footprint management market by component, deployment mode, organization size, vertical, and region, in terms of value.
  • To provide comprehensive information about the drivers, restraints, opportunities, and industry-specific challenges that affect the market growth
  • To strategically analyze the global carbon footprint management market with respect to individual growth trends, future expansions, and each segment's contribution to the market.
  • To analyze market opportunities for stakeholders and details of the competitive landscape for market leaders.
  • To forecast the growth of the global carbon footprint management market with respect to the main regions (Asia Pacific, North America, Europe, Middle East & Africa, and South America).
  • To profile and rank key players and comprehensively analyze their market share.
  • To analyze competitive developments such as acquisitions, contracts & agreements, product launches, and expansions in the carbon footprint management market.
  • This report covers the global carbon footprint management market size in terms of value and volume.

Available Customizations:

With the given market data, MarketsandMarkets offers customizations as per the client’s specific needs. The following customization options are available for this report:

Company Information

  • Detailed analyses and profiling of additional market players (up to 5)
Custom Market Research Services

We will customize the research for you, in case the report listed above does not meet with your exact requirements. Our custom research will comprehensively cover the business information you require to help you arrive at strategic and profitable business decisions.

Request Customization

Instant Answers with GPT - Ask Now!

Ask real questions. Get complete answers !
Report Code
EP 8589
Published ON
Mar, 2023
Choose License Type
BUY NOW
  • SHARE
X
Request Customization
Speak to Analyst
Speak to Analyst
OR FACE-TO-FACE MEETING
PERSONALIZE THIS RESEARCH
  • Triangulate with your Own Data
  • Get Data as per your Format and Definition
  • Gain a Deeper Dive on a Specific Application, Geography, Customer or Competitor
  • Any level of Personalization
REQUEST A FREE CUSTOMIZATION
LET US HELP YOU!
  • What are the Known and Unknown Adjacencies Impacting the Carbon Footprint Management Market
  • What will your New Revenue Sources be?
  • Who will be your Top Customer; what will make them switch?
  • Defend your Market Share or Win Competitors
  • Get a Scorecard for Target Partners
CUSTOMIZED WORKSHOP REQUEST
  • Call Us
  • +1-888-600-6441 (Corporate office hours)
  • +1-888-600-6441 (US/Can toll free)
  • +44-800-368-9399 (UK office hours)
CONNECT WITH US
ABOUT TRUST ONLINE
©2024 MarketsandMarkets Research Private Ltd. All rights reserved
DMCA.com Protection Status
Website Feedback