Carotenoids Market by Type (Astaxanthin, Beta-Carotene, Lutein, Lycopene, Canthaxanthin, Zeaxanthin), Application (Food & Beverage, Feed, Pharmaceuticals, Dietary Supplements, Cosmetics), Form, Nature, Function, and By Region - Global Forecast to 2031

icon1
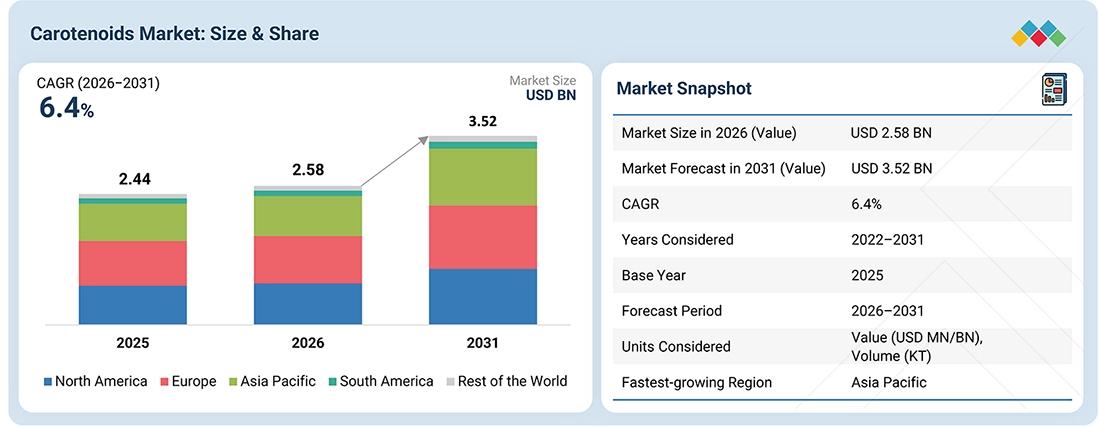
USD 3.52 BN
MARKET SIZE, 2031
icon2
CAGR 6.4%
(2026-2031)
icon3
280
REPORT PAGES
icon4
300
MARKET TABLES

OVERVIEW

carotenoid-market Overview

Source: Secondary Research, Interviews with Experts, MarketsandMarkets Analysis

The carotenoids market is projected to reach USD 3.52 billion by 2031 from USD 2.58 billion in 2026, at a CAGR of 6.4% from 2026 to 2031. The growth of this market is driven by increasing consumer demand for natural colorants and clean-label ingredients, rising awareness of the health benefits of carotenoids, growing adoption in dietary supplements and functional foods, expanding applications in animal feed and aquaculture, and increasing use of carotenoids in cosmetics and personal care products worldwide.

KEY TAKEAWAYS

  • BY REGION
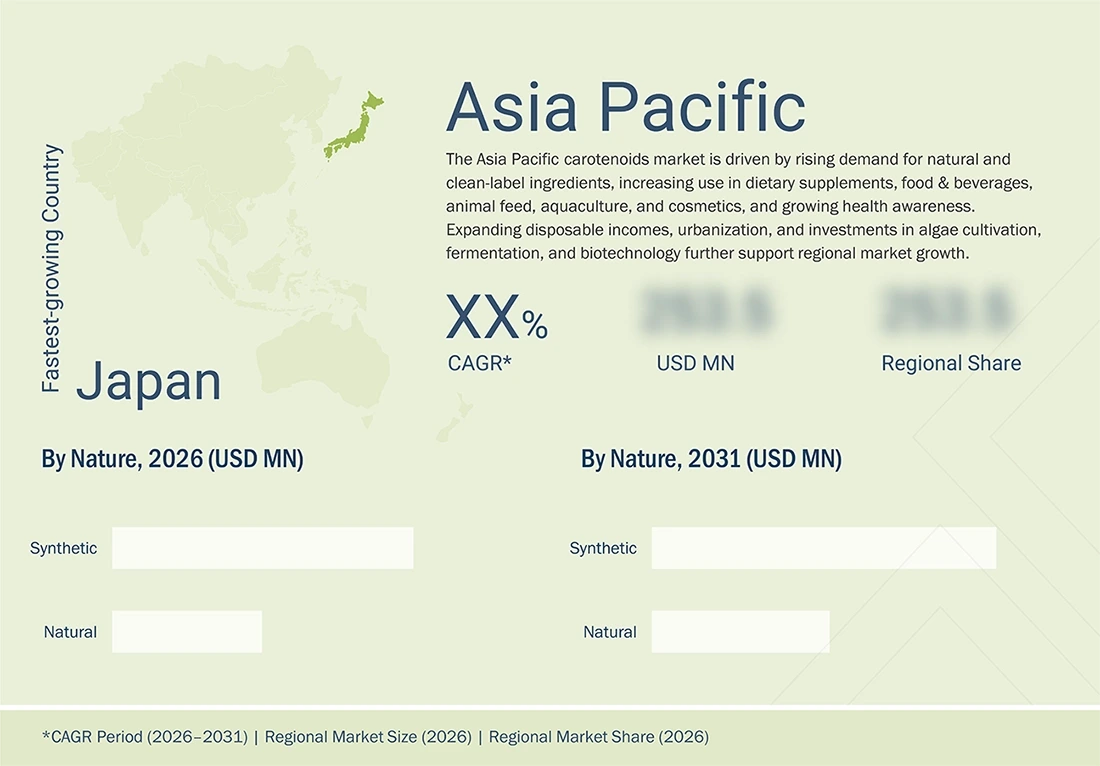
    The Asia Pacific region is estimated to account for 28.7% of the carotenoids market in 2026.
  • BY NATURE
    By nature, the synthetic carotenoids segment is estimated to dominate the market with a share of approx 66.0% in 2026.
  • BY TYPE
    By type, the astaxanthin segment is projected to witness the highest CAGR of 8.0% from 2026 to 2031.
  • BY APPLICATION
    By application, the animal feed segment is expected to lead the market share during the forecast period.
  • COMPETITIVE LANDSCAPE - KEY PLAYERS
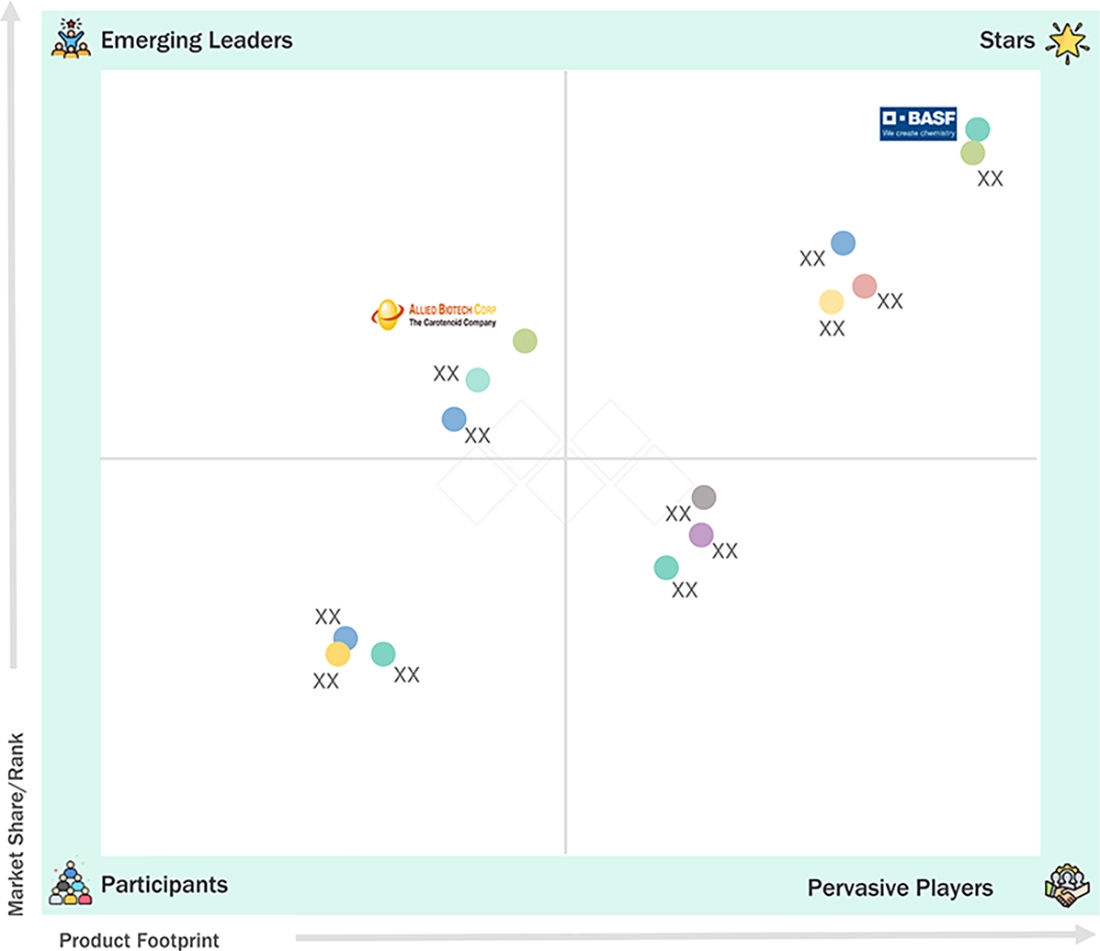
    BASF SE (Germany) and dsm-firmenich (Netherlands) were identified as some of the star players in the carotenoids market (global), given their global presence and strong product footprint.
  • COMPETITIVE LANDSCAPE - STARTUPS/SMEs
    Allied Biotech Corporation (Taiwan), among others, has distinguished itself among startups and SMEs by securing strong footholds in specialized niche areas, underscoring its potential as an emerging market leader.

The carotenoids market is experiencing steady growth, driven by increasing consumer preference for natural and clean-label ingredients, rising awareness of the health benefits of carotenoids, growing demand for dietary supplements and functional foods, expanding applications in animal feed and aquaculture, and increasing use of carotenoids in cosmetics and personal care products.

TRENDS & DISRUPTIONS IMPACTING CUSTOMERS' CUSTOMERS

Customer business in the carotenoids market is influenced by growing demand for natural, clean label, and functional ingredients, increasing adoption across food & beverages, dietary supplements, animal feed, aquaculture, cosmetics, and pharmaceuticals, and advances in algae- and fermentation-derived carotenoids, encapsulation, and stabilization technologies. These trends are driving innovation toward higher-value carotenoid solutions, improving product stability, functionality, sustainability, and consumer appeal, thereby influencing the revenues of carotenoid manufacturers, ingredient suppliers, formulators, distributors, and downstream product manufacturers.
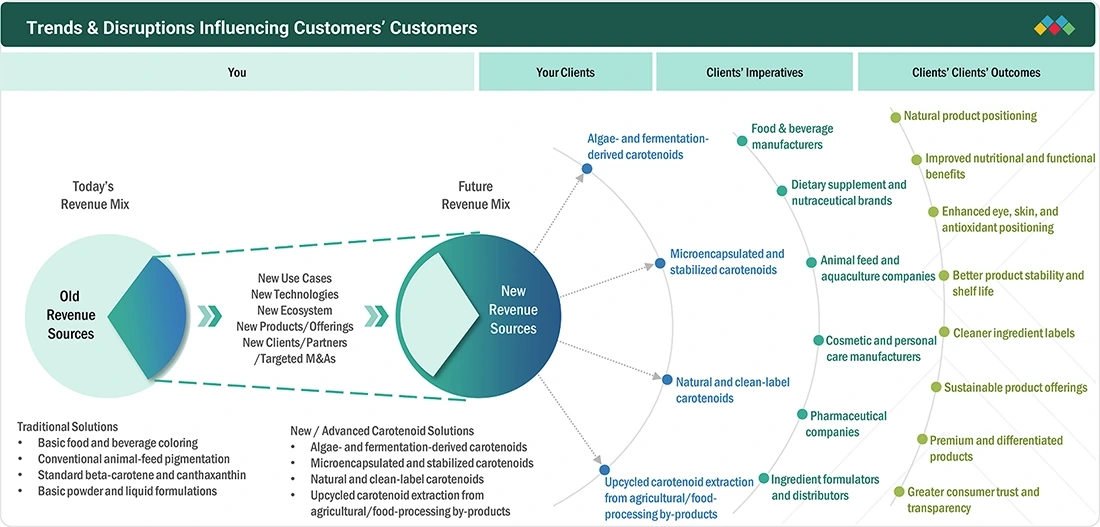
carotenoid-market Disruptions

Source: Secondary Research, Interviews with Experts, MarketsandMarkets Analysis

MARKET DYNAMICS

Drivers
Impact
Level
  • Growing consumer demand for natural colorants and clean-label ingredients
  • Increasing awareness of health benefits of carotenoids
RESTRAINTS
Impact
Level
  • High production costs of natural carotenoids
  • Sensitivity to oxidation, light, heat, and processing conditions
OPPORTUNITIES
Impact
Level
  • Expansion of sustainable algae- and microorganism-derived carotenoids
  • Development of biotechnology- and fermentation-based carotenoids
CHALLENGES
Impact
Level
  • Ensuring long-term stability and bioavailability during processing and storage
  • Balancing natural-source sustainability, scalability, and cost competitiveness

Source: Secondary Research, Interviews with Experts, MarketsandMarkets Analysis

Driver: Growing consumer demand for natural colorants and clean-label ingredients

Rising consumer preference for natural and clean-label carotenoids is increasing their use in food, beverages, supplements, and other functional applications.

Restraint: High production costs of natural carotenoids

Natural carotenoids require costly cultivation, extraction, purification, and processing, making them less cost-competitive than synthetic alternatives.

Opportunity: Expansion of sustainable algae- and microorganism-derived carotenoids

Growing investment in algae and microbial production is creating opportunities for sustainable and scalable natural carotenoid supply.

Challenge: Ensuring long-term stability and bioavailability during processing and storage

Carotenoids are sensitive to oxygen, heat, and light, requiring advanced stabilization and delivery technologies to maintain quality and bioavailability.

CAROTENOIDS MARKET: COMMERCIAL USE CASES ACROSS INDUSTRIES

COMPANY USE CASE DESCRIPTION BENEFITS
company logo
BASF supplies carotenoids such as beta-carotene, canthaxanthin, astaxanthin, and other pigments for food & beverages, dietary supplements, poultry, and aquaculture feed. Its Lucantin and Lucarotin products are used for pigmentation and nutritional supplementation. Reliable pigmentation | High bioavailability and stability | Nutritional and provitamin-A functionality
company logo
Kemin supplies carotenoid-based feed pigments such as ORO GLO, derived from marigolds and used in poultry nutrition to improve egg-yolk color and increase lutein levels. Consistent egg-yolk pigmentation | Improved product appearance | Increased lutein content in eggs

Logos and trademarks shown above are the property of their respective owners. Their use here is for informational and illustrative purposes only.

MARKET ECOSYSTEM

The carotenoids market ecosystem is categorized into carotenoid manufacturers, startups or SMEs, regulatory bodies, and end users such as food and beverage companies, dietary supplement brands, animal feed and aquaculture companies, cosmetics and pharmaceutical manufacturers, and other demand-side stakeholders. The market is characterized by diverse applications across food, nutrition, animal health, cosmetics, and pharmaceuticals. Established companies and emerging players are developing natural, clean-label, stable, and advanced carotenoid solutions to meet growing demand for functional ingredients, natural colorants, and health-oriented products.
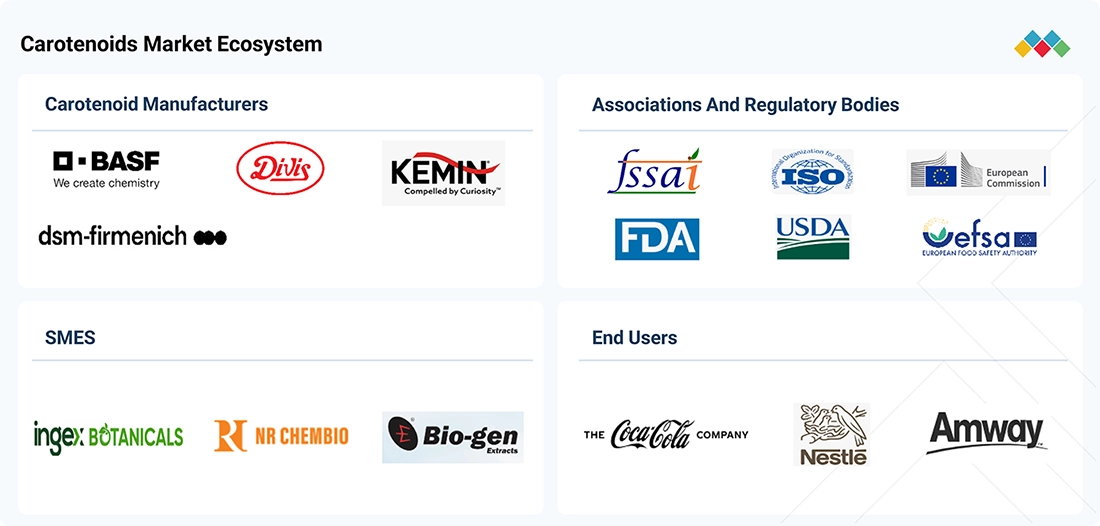
carotenoid-market Ecosystem

Logos and trademarks shown above are the property of their respective owners. Their use here is for informational and illustrative purposes only.

MARKET SEGMENTS
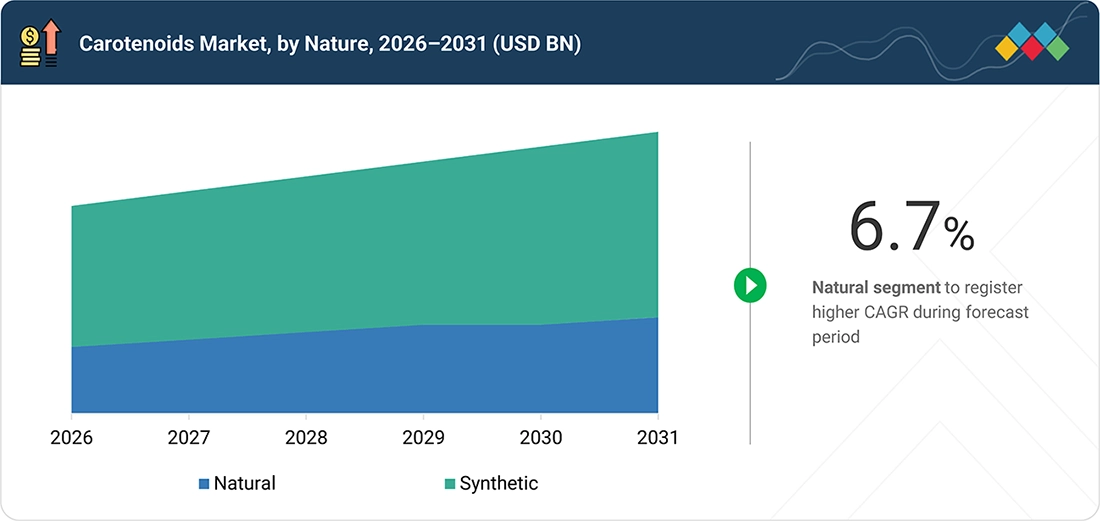
carotenoid-market Segments

Source: Secondary Research, Interviews with Experts, MarketsandMarkets Analysis

Carotenoids Market, By Type

Astaxanthin dominates the carotenoids market, supported by its broad use in aquaculture, animal feed, dietary supplements, and cosmetics due to its antioxidant and pigmentation properties.

Carotenoids Market, By Application

Animal feed dominates the market, driven by extensive carotenoid use for pigmentation, nutritional benefits, and animal health, particularly in poultry and aquaculture.

Carotenoids Market, By Nature

Synthetic carotenoids dominate due to their cost-effectiveness, consistent quality, scalability, and stable supply for large-volume food, feed, and pharmaceutical applications.

REGION

Asia Pacific to lead global carotenoids market

The Asia Pacific carotenoids market is driven by rising demand for natural and clean-label ingredients, increasing use in dietary supplements, food & beverages, animal feed, aquaculture, and cosmetics, and growing health awareness. Expanding disposable incomes, urbanization, and investments in algae cultivation, fermentation, and biotechnology further support regional market growth.
carotenoid-market Region

CAROTENOIDS MARKET: COMPANY EVALUATION MATRIX

In the carotenoids market matrix, BASF SE (Germany) and dsm-firmenich (Netherlands) (Stars) lead with a moderate market share and extensive product portfolios, driven by their strong global presence, strong global footprint, advanced processing capabilities, diversified application offerings, and continuous investments in innovation. Allied Biotech Corporation (Taiwan) (Emerging Leader) is gaining visibility through specialized solutions, strengthening its market position through innovation and expanding regional reach.
carotenoid-market Evaluation Metrics

Source: Secondary Research, Interviews with Experts, MarketsandMarkets Analysis

KEY MARKET PLAYERS

MARKET SCOPE

REPORT METRIC DETAILS
Market Size in 2026 (Value) USD 2.58 BN
Market Forecast in 2031 (Value) USD 3.52 BN
Growth Rate CAGR of 6.4% from 2026 to 2031
Years Considered 2022–2031
Base Year 2025
Forecast Period 2026–2031
Units Considered Value (USD Million/Billion), Volume (KT)
Report Coverage Revenue Forecast, Company Ranking, Competitive Landscape, Growth Factors, and Trends
Segments Covered
  • Type:
    • Beta Carotene
    • Astaxanthin
    • Lutein
    • Lycopene
    • Zeaxanthin
    • Canthaxanthin
    • Other Types
  • Application:
    • Animal Feed
    • Dietary Supplements
    • Food & Beverages
    • Cosmetics
    • Pharmaceuticals
  • Nature:
    • Synthetic
    • Natural
  • Form:
    • Beadlet
    • Powder
    • Oil Suspension
    • Emulsion
  • Function:
    • Coloring/Pigementation
    • Antioxidant
    • Provitamin A
    • Eye Health
    • Skin Health
    • Nutrition Health
Regions Covered North America, Europe, Asia Pacific, South America, Rest of the World

WHAT IS IN IT FOR YOU: CAROTENOIDS MARKET REPORT CONTENT GUIDE
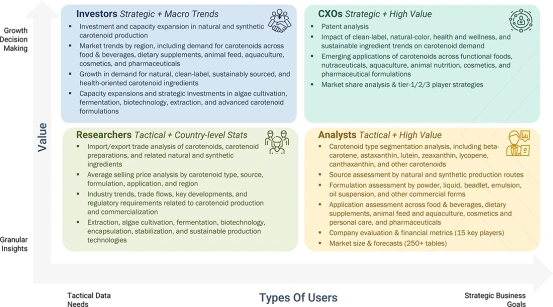
carotenoid-market Content Guide

DELIVERED CUSTOMIZATIONS

We have successfully delivered the following deep-dive customizations:

CLIENT REQUEST CUSTOMIZATION DELIVERED VALUE ADDS
Europe-based Carotenoids Manufacturers
  • Detailed carotenoids type analysis, competitive landscape, and competitors (financials, product portfolio) analysis
  • Customer landscape mapping by end-use sector
  • Assessment of market share and pricing analysis
  • Identified & profiled 20+ manufacturing companies
  • Tracked adoption trends in high-growth countries (China, Brazil, India, US)
  • Highlighted new customer clusters driven by sustainability mandates
Carotenoids Types Segment Assessment
  • Segmentation of carotenoids demand across applications such as animal feed, dietary supplements, food & beverages, cosmetics, pharmaceuticals
  • Benchmarking the adoption of different types of carotenoids such as beta carotene, lycopene, lutein, astaxanthin, and others across regions
  • Switching barrier analysis (high capital investment, maintenance complexity, regulatory compliance requirements)
  • Revenue share for various carotenoid types and subsegments
  • Pinpoint substitution risks & opportunities in cost-sensitive markets
  • Regulatory structure across regions

RECENT DEVELOPMENTS

  • May 2026 : Lycored announced that Lumenato®, its golden-tomato-derived ingredient containing the carotenoids phytoene and phytofluene, won the 2026 Cosmetics & Toiletries Alle Award in the Cosmetic Active: Bath/Body, Wellness, Nutricosmetics category. The recognition highlights the ingredient’s science-backed beauty-from-within application for supporting skin resilience, structure, and radiance. Lumenato formulations contain standardized natural tomato carotenoids, making the achievement directly relevant to Lycored’s carotenoid technology portfolio and a substantive 2026 product-recognition development.
  • February 2026 : dsm-firmenich entered into an agreement to divest its Animal Nutrition & Health (ANH) business to CVC Capital Partners, with the transaction explicitly encompassing an Essential Products Company containing Vitamins, Carotenoids and Aroma Ingredients. The transaction values ANH at an enterprise value of €2.2 billion, including an earnout of up to €0.5 billion, while dsm-firmenich is expected to retain a 20% equity stake in both businesses created through the separation. Because carotenoids constitute an expressly identified business within the divestiture, the transaction represents a substantive portfolio and ownership development directly affecting dsm-firmenich’s carotenoid operations.
  • October 2025 : Lycored introduced its new VAS (Versatile Application Solution) technology at SupplySide Global 2025. The technology consists of microencapsulated starch beadlets designed to improve stability, solubility, flowability, and formulation performance across tablets, gummies, powder beverages, and capsules. The VAS portfolio supports active ingredients including lycopene, beta-carotene, and lutein, strengthening Lycored's carotenoid delivery and formulation capabilities.
  • June 2025 : dsm-firmenich expanded its partnership with Brenntag Specialties Pharma in 2025 to distribute its vitamins and carotenoids, including beta-carotene, across Poland and the Czech Republic, strengthening its pharmaceutical carotenoid distribution and regional supply-chain reach.
  • May 2024 : Kemin introduced Macu-LZ in 2024, a formulation combining lutein, RR-zeaxanthin, and meso-zeaxanthin with microencapsulation technology to support eye, brain, and skin health, while enabling stable use across capsules, tablets, gummies, and beverages.


Table of Contents

checkmarkExclusive indicates content/data unique to MarketsandMarkets and not available with any competitors.

TITLE
PAGE NO
1
INTRODUCTION


27
2
EXECUTIVE SUMMARY


33
3
PREMIUM INSIGHTS


39
4
MARKET OVERVIEW
Carotenoids market surges with preventive healthcare demand and innovative extraction technologies.


43
 
4.1
INTRODUCTION


4.2
MARKET DYNAMICS


4.2.1
DRIVERS


4.2.1.1
INCREASING APPLICATIONS IN PREVENTIVE HEALTHCARE


4.2.1.2
GROWING USE IN PHARMACEUTICALS AND COSMETICS


4.2.1.3
RISE IN INNOVATIVE EXTRACTION TECHNOLOGIES


4.2.1.4
INCREASING BURDEN OF GASTROINTESTINAL DISORDERS


4.2.2
RESTRAINTS


4.2.2.1
LOW WATER SOLUBILITY AND STABILITY


4.2.2.2
RISKS ASSOCIATED WITH HIGH DOSAGE


4.2.2.3
INCREASING REGULATORY REQUIREMENTS AND AUTHORIZATION COSTS


4.2.3
OPPORTUNITIES


4.2.3.1
BOOMING DIETARY SUPPLEMENTS AND FOOD & BEVERAGES MARKETS


4.2.3.2
EXPANDING SCOPE OF RESEARCH IN FEED INDUSTRY


4.2.3.3
GROWING INCLINATION TOWARD SAFETY REASSESSMENT OF SYNTHETIC FOOD COLORS


4.2.4
CHALLENGES


4.2.4.1
STRINGENT QUALITY STANDARDS


4.2.4.2
HIGH PRODUCTION COSTS


4.3
UNMET NEEDS AND WHITE SPACES


4.3.1
UNMET NEEDS IN CAROTENOIDS MARKET


4.3.2
WHITE SPACE OPPORTUNITIES


4.4
INTERCONNECTED MARKETS AND CROSS-SECTOR OPPORTUNITIES


4.4.1
INTERCONNECTED MARKETS


4.4.2
CROSS-SECTOR OPPORTUNITIES


4.5
STRATEGIC MOVES BY TIER-1/2/3 PLAYERS


4.5.1
KEY MOVES AND STRATEGIC FOCUS


5
INDUSTRY TRENDS
Strategic insights reveal robust carotenoids demand growth driven by global food and aquaculture expansion.


56
 
5.1
PORTER’S FIVE FORCES ANALYSIS


5.1.1
INTENSITY OF COMPETITIVE RIVALRY


5.1.2
BARGAINING POWER OF SUPPLIERS


5.1.3
BARGAINING POWER OF BUYERS


5.1.4
THREAT OF SUBSTITUTES


5.1.5
THREAT OF NEW ENTRANTS


5.2
MACROECONOMICS OUTLOOK


5.2.1
INTRODUCTION


5.2.2
MACROECONOMIC INDICATORS


5.2.2.1
RESILIENT GLOBAL ECONOMIC GROWTH SUPPORTS CAROTENOIDS DEMAND


5.2.2.2
RISING GLOBAL FOOD CONSUMPTION EXPANDS APPLICATION BASE FOR CAROTENOIDS


5.2.2.3
EXPANDING AQUACULTURE PRODUCTION SUPPORTS ASTAXANTHIN DEMAND


5.3
VALUE CHAIN ANALYSIS


5.3.1
RESEARCH & PRODUCT DEVELOPMENT


5.3.2
RAW MATERIAL SOURCING & INGREDIENT DEVELOPMENT


5.3.3
EXTRACTION, PRODUCTION, & FORMULATION


5.3.4
DISTRIBUTION & SUPPLY CHAIN MANAGEMENT


5.3.5
END-USE APPLICATIONS & COMMERCIALIZATION


5.4
ECOSYSTEM ANALYSIS


5.4.1
DEMAND SIDE


5.4.2
SUPPLY SIDE


5.5
PRICING ANALYSIS


5.5.1
INTRODUCTION


AVERAGE SELLING PRICE OF CAROTENOID-BASED FINISHED PRODUCTS,


5.5.3
INDICATIVE AVERAGE SELLING PRICE TREND, BY REGION (USD/TONS)


5.5.4
INDICATIVE AVERAGE SELLING PRICE TREND, BY TYPE (USD/TONS)


5.6
TRADE ANALYSIS


5.6.1
HS CODE- 320300


5.6.2
IMPORT ANALYSIS: CAROTENOIDS MARKET


5.6.3
EXPORT ANALYSIS: CAROTENOIDS MARKET


5.6.4
HS CODE- 320418


5.6.5
IMPORT ANALYSIS: CAROTENOIDS MARKET


5.6.6
EXPORT ANALYSIS: CAROTENOIDS MARKET


5.7
KEY CONFERENCES AND EVENTS, 2026–2027


5.8
TRENDS/DISRUPTIONS IMPACTING CUSTOMER BUSINESS


5.9
INVESTMENT AND FUNDING SCENARIO


5.10
CASE STUDY ANALYSIS


5.10.1
CYANOTECH CORPORATION – NATURAL ASTAXANTHIN FOR FUNCTIONAL NUTRITION APPLICATIONS


5.10.2
DSM-FIRMENICH – LUTEIN FOR FUNCTIONAL BEVERAGE APPLICATIONS


5.10.3
LYCORED – MICROENCAPSULATION TECHNOLOGY FOR IMPROVED CAROTENOID STABILITY


5.11
IMPACT OF 2025 US TARIFF - CAROTENOIDS MARKET


5.11.1
INTRODUCTION


5.11.2
PRICE IMPACT ANALYSIS


5.11.3
IMPACT ON COUNTRIES/REGIONS


5.11.3.1
US


5.11.3.2
EUROPE


5.11.3.3
ASIA PACIFIC


5.11.4
IMPACT ON END-USE INDUSTRIES


6
TECHNOLOGICAL ADVANCEMENTS, AI-DRIVEN IMPACT, PATENTS, INNOVATIONS, AND FUTURE APPLICATIONS
AI and biotech innovations are revolutionizing carotenoid production and shaping future functional food markets.


76
 
6.1
TECHNOLOGY ANALYSIS


6.1.1
KEY TECHNOLOGIES


6.1.1.1
MICROBIAL FERMENTATION & BIOTECHNOLOGICAL PRODUCTION TECHNOLOGY


6.1.1.2
SOLVENT EXTRACTION & DOWNSTREAM PURIFICATION TECHNOLOGY


6.1.2
COMPLEMENTARY TECHNOLOGIES


6.1.2.1
SUPERCRITICAL CO2 EXTRACTION TECHNOLOGY


6.1.2.2
MICRO/NANOENCAPSULATION & OXIDATIVE STABILITY ENHANCEMENT TECHNOLOGY


6.1.3
ADJACENT TECHNOLOGIES


6.1.3.1
METABOLIC ENGINEERING, SYNTHETIC BIOLOGY, & MICROBIAL CELL-FACTORY TECHNOLOGIES


6.1.3.2
AI-ASSISTED PROCESS OPTIMIZATION, DIGITAL MONITORING, & TRACEABILITY TECHNOLOGIES


6.2
TECHNOLOGY/PRODUCT ROADMAP


6.2.1
SHORT-TERM | ADVANCED EXTRACTION, STABILIZATION, & SUSTAINABLE CAROTENOID DEVELOPMENT


6.2.2
MID-TERM | AI-DRIVEN FORMULATION & SMART MANUFACTURING


6.2.3
LONG-TERM | METABOLIC ENGINEERING, SYNTHETIC BIOLOGY, & PRECISION CAROTENOID PRODUCTION


6.3
PATENT ANALYSIS


6.4
FUTURE APPLICATIONS


6.4.1
FUTURE APPLICATIONS OF CAROTENOIDS IN NEXT-GENERATION FUNCTIONAL FOODS AND BEVERAGES


6.4.2
CAROTENOID FORMULATION AND ENCAPSULATION TECHNOLOGY: SHAPING FUTURE OF CAROTENOIDS MARKET


6.4.3
BIOTECHNOLOGY-BASED CAROTENOID PRODUCTION TECHNOLOGY: SHAPING FUTURE OF CAROTENOIDS MARKET


6.5
IMPACT OF GENERATIVE AI ON CAROTENOIDS MARKET


6.5.1
INTRODUCTION


6.5.2
TOP USE CASES AND MARKET POTENTIAL


6.5.3
BEST PRACTICES IN CAROTENOIDS PRODUCTION


6.5.4
INTERCONNECTED ADJACENT ECOSYSTEM AND IMPACT ON MARKET PLAYERS


6.5.5
CLIENTS’ READINESS TO ADOPT GENERATIVE AI IN CAROTENOIDS PRODUCTION


6.6
SUCCESS STORIES AND REAL-WORLD APPLICATIONS


7
REGULATORY LANDSCAPE AND SUSTAINABILITY INITIATIVES
Navigate evolving carotenoid regulations with enhanced traceability and sustainability-driven compliance strategies.


88
 
7.1
REGIONAL REGULATIONS AND COMPLIANCE


REGULATORY BODIES, GOVERNMENT AGENCIES,


7.1.2
INDUSTRY STANDARDS


7.1.2.1
INDUSTRY STANDARDS IN CAROTENOIDS MARKET


7.1.3
LABELING REQUIREMENTS AND CLAIMS


7.1.4
ANTICIPATED REGULATORY CHANGES IN NEXT 5–10 YEARS


7.1.4.1
ENHANCED INGREDIENT TRACEABILITY AND CAROTENOID SOURCE TRANSPARENCY


7.1.4.2
GREATER GLOBAL HARMONIZATION OF CAROTENOID REGULATIONS


7.1.4.3
STRICTER SAFETY, PURITY, AND CONTAMINANT CONTROL REQUIREMENTS


7.1.4.4
SUSTAINABILITY AND RESPONSIBLE SOURCING REQUIREMENTS FOR NATURAL CAROTENOIDS


7.1.4.5
DIGITAL TRACEABILITY, AI-ENABLED QUALITY MONITORING, AND COMPLIANCE AUTOMATION


7.2
SUSTAINABILITY INITIATIVES


7.2.1
SUSTAINABLE SOURCING


7.2.2
CARBON FOOTPRINT REDUCTION INITIATIVES


7.2.3
CIRCULAR ECONOMY APPROACHES


7.3
IMPACT OF REGULATORY POLICIES ON SUSTAINABILITY INITIATIVES


7.4
CERTIFICATIONS, LABELING, ECO-STANDARDS


8
CUSTOMER LANDSCAPE AND BUYER BEHAVIOR
Unlock hidden revenue by addressing unmet needs and optimizing stakeholder-driven buying criteria.


98
 
8.1
DECISION-MAKING PROCESS


8.2
KEY STAKEHOLDERS INVOLVED IN BUYING PROCESS AND THEIR EVALUATION CRITERIA


8.2.1
KEY STAKEHOLDERS IN BUYING PROCESS


8.2.2
BUYING CRITERIA


8.3
ADOPTION BARRIERS AND INTERNAL CHALLENGES


8.4
UNMET NEEDS OF VARIOUS APPLICATION INDUSTRIES ACROSS SUPPLY CHAIN


8.5
MARKET PROFITABILITY


8.6
REVENUE POTENTIAL


8.6.1
COST DYNAMICS


8.6.2
MARGIN OPPORTUNITIES, BY TOP APPLICATIONS


9
CAROTENOIDS MARKET, BY TYPE
Market Size & Growth Rate Forecast Analysis to 2031 in USD Million and Tons | 32 Data Tables


107
 
9.1
INTRODUCTION


9.2
BETA-CAROTENE


9.2.1
INCREASING USE AS NATURAL COLORANTS TO DRIVE MARKET


9.3
ASTAXANTHIN


9.3.1
GROWING ADOPTION IN FEED, DIETARY SUPPLEMENTS, AND COSMETIC INDUSTRIES TO DRIVE MARKET


9.4
LUTEIN


9.4.1
RISING ACCEPTABILITY IN TREATING EYE DISEASES TO DRIVE MARKET


9.5
LYCOPENE


9.5.1
INCREASING AWARENESS ABOUT ANTIOXIDANT HEALTH BENEFITS TO DRIVE MARKET


9.6
ZEAXANTHIN


9.6.1
GROWING DEMAND IN POULTRY FEED TO DRIVE MARKET


9.7
CANTHAXANTHIN


9.7.1
SURGE IN LIVESTOCK POPULATION TO DRIVE MARKET


9.8
OTHER TYPES


10
CAROTENOIDS MARKET, BY APPLICATION
Market Size & Growth Rate Forecast Analysis to 2031 in USD Million | 12 Data Tables


123
 
10.1
INTRODUCTION


10.2
ANIMAL FEED


10.2.1
GROWING ADOPTION DUE TO DISEASE RESISTANCE AND COLOR-ENHANCING PROPERTIES TO DRIVE MARKET


10.3
DIETARY SUPPLEMENTS


10.3.1
RISING AWARENESS AMONG CONSUMERS FOR NATURAL HEALTH SUPPLEMENTS TO DRIVE MARKET


10.4
FOOD & BEVERAGES


10.4.1
SURGE IN DEMAND FOR NATURAL FOOD COLORANTS WITH ANTIOXIDANT AND ANTICARCINOGENIC PROPERTIES TO DRIVE MARKET


10.5
COSMETICS


10.5.1
INCREASING DEMAND DUE TO ANTI-AGING AND ANTI-INFLAMMATORY PROPERTIES TO DRIVE MARKET


10.6
PHARMACEUTICALS


10.6.1
GROWING CONSUMPTION OF CAROTENOIDS TO BOOST IMMUNITY TO DRIVE MARKET


11
CAROTENOIDS MARKET, BY NATURE
Market Size & Growth Rate Forecast Analysis to 2031 in USD Million | 6 Data Tables


132
 
11.1
INTRODUCTION


11.2
SYNTHETIC


11.2.1
LOWER MANUFACTURING COST TO DRIVE MARKET


11.3
NATURAL


11.3.1
INCREASING FOCUS ON IMPROVED IMMUNITY RATES IN HUMANS AND ANIMALS TO DRIVE MARKET


12
CAROTENOIDS MARKET, BY FORMULATION
Market Size & Growth Rate Forecast Analysis to 2031 in USD Million | 11 Data Tables


137
 
12.1
INTRODUCTION


12.2
BEADLETS


12.2.1
NEED FOR INCREASED STABILITY OF CAROTENOID PRODUCTS TO DRIVE MARKET


12.3
POWDERS


12.3.1
INCREASING DEMAND FOR CAROTENOIDS WITH HIGH THERMAL STABILITY AND SHELF LIFE TO DRIVE MARKET


12.4
OIL SUSPENSIONS


12.4.1
GROWING DEMAND FOR AFFORDABLE CAROTENOIDS TO DRIVE MARKET


12.5
EMULSIONS


12.5.1
RISING ADOPTION IN PROCESSING AND STORAGE OF Β-CAROTENE TO DRIVE MARKET


13
CAROTENOIDS MARKET, BY FUNCTION
Market Size & Growth Rate Forecast Analysis


145
 
13.1
INTRODUCTION


13.2
COLORING/PIGMENTATION


13.2.1
INCREASING DEMAND FOR NATURAL COLORANTS TO DRIVE CAROTENOID USE IN COLORING/PIGMENTATION


13.3
ANTIOXIDANT


13.3.1
GROWING DEMAND FOR OXIDATIVE-STRESS PROTECTION TO SUPPORT ANTIOXIDANT APPLICATIONS


13.4
PROVITAMIN A


13.4.1
IMPORTANCE OF BETA-CAROTENE AS VITAMIN A PRECURSOR TO SUPPORT PROVITAMIN A APPLICATIONS


13.5
EYE HEALTH


13.5.1
RISING AWARENESS OF VISION HEALTH TO SUPPORT CAROTENOID APPLICATIONS IN EYE HEALTH


13.6
SKIN HEALTH


13.6.1
GROWING INTEREST IN BEAUTY-FROM-WITHIN PRODUCTS TO SUPPORT CAROTENOID USE IN SKIN HEALTH


13.7
NUTRITION HEALTH


13.7.1
GROWING FOCUS ON PREVENTIVE NUTRITION AND OVERALL WELLNESS TO SUPPORT CAROTENOID APPLICATIONS


14
CAROTENOIDS MARKET, BY REGION
Comprehensive coverage of 7 Regions with country-level deep-dive of 18 Countries | 108 Data Tables.


148
 
14.1
INTRODUCTION


14.2
NORTH AMERICA


14.2.1
US


14.2.1.1
RISING FOCUS ON CANCER PREVENTION AND HEALTHY LIFESTYLES TO PROPEL MARKET


14.2.2
CANADA


14.2.2.1
RISING PREVALENCE OF CHRONIC DISEASES AND EXPANDING AGING POPULATION TO DRIVE MARKET


14.2.3
MEXICO


14.2.3.1
RISING ANIMAL FEED PRODUCTION TO SUPPORT CAROTENOID DEMAND


14.3
EUROPE


14.3.1
GERMANY


14.3.1.1
STRONG CONSUMER AWARENESS AND PRESENCE OF KEY INDUSTRY PLAYERS TO DRIVE MARKET


14.3.2
FRANCE


14.3.2.1
AGING POPULATION AND GOVERNMENT NUTRITION STRATEGIES TO DRIVE MARKET


14.3.3
SPAIN


14.3.3.1
GROWING DEMAND FOR AQUAFEED PIGMENTATION AND FUNCTIONAL FOOD INGREDIENTS TO PROPEL MARKET


14.3.4
ITALY


14.3.4.1
EXPANSION OF LIVESTOCK PRODUCTION AND GROWING DEMAND FOR SPECIALIZED FEED INGREDIENTS TO DRIVE MARKET


14.3.5
NETHERLANDS


14.3.5.1
AGING POPULATION AND FOCUS ON PREVENTIVE NUTRITION TO DRIVE MARKET


14.3.6
RUSSIA


14.3.6.1
RISING FOCUS ON PREVENTIVE HEALTHCARE AND EXPANDING ANIMAL FEED PRODUCTION TO DRIVE MARKET


14.3.7
REST OF EUROPE


14.4
ASIA PACIFIC


14.4.1
CHINA


14.4.1.1
EXPANDING AQUACULTURE SECTOR AND STRONG PRESENCE OF KEY MANUFACTURERS TO DRIVE MARKET


14.4.2
JAPAN


14.4.2.1
INCREASING DEMAND FOR PROCESSED FOOD & BEVERAGES TO DRIVE MARKET


14.4.3
INDIA


14.4.3.1
GROWING PHARMACEUTICAL ECOSYSTEM AND STRENGTHENING SUPPLY-CHAIN RESILIENCE TO PROPEL MARKET


14.4.4
AUSTRALIA & NEW ZEALAND


14.4.4.1
STRONG DIETARY SUPPLEMENT ADOPTION AND GROWING AGING POPULATION TO CREATE MARKET OPPORTUNITIES FOR CAROTENOIDS


14.4.5
INDONESIA


14.4.5.1
PHARMACEUTICAL SELF-SUFFICIENCY AND FOOD & BEVERAGE INDUSTRY EXPANSION TO DRIVE CAROTENOID DEMAND


14.4.6
THAILAND


14.4.6.1
GROWING DEMAND FOR ANIMAL FEED APPLICATIONS AND EXPANDING ELDERLY DEMOGRAPHIC TO PROPEL MARKET


14.4.7
MALAYSIA


14.4.7.1
GROWTH OPPORTUNITIES ACROSS DIETARY SUPPLEMENTS AND AQUACULTURE


14.4.8
REST OF ASIA PACIFIC


14.5
SOUTH AMERICA


14.5.1
BRAZIL


14.5.1.1
EXPANDING ANIMAL FEED INDUSTRY AND PHARMACEUTICAL INNOVATION TO DRIVE CAROTENOID DEMAND


14.5.2
ARGENTINA


14.5.2.1
GROWING COSMETICS AND ANIMAL NUTRITION SECTORS TO DRIVE MARKET


14.5.3
REST OF SOUTH AMERICA


14.6
REST OF THE WORLD


14.7
MIDDLE EAST


14.7.1
GROWING PHARMACEUTICAL AND BIOTECHNOLOGY SECTOR TO SUPPORT CAROTENOID DEMAND


14.8
AFRICA


14.8.1
EXPANDING AQUACULTURE AND COMMERCIAL FEED PRODUCTION TO DRIVE CAROTENOID DEMAND


15
COMPETITIVE LANDSCAPE
Gain strategic insights into market leaders' revenue dominance and emerging competition dynamics.


196
 
15.1
OVERVIEW


15.2
KEY PLAYER COMPETITIVE STRATEGIES/RIGHT TO WIN, 2023–2025


15.3
REVENUE ANALYSIS, 2023–2025


15.4
MARKET SHARE ANALYSIS, 2025


15.5
BRAND/PRODUCT COMPARISON


15.6
COMPANY EVALUATION MATRIX: KEY PLAYERS, 2025


15.6.1
STARS


15.6.2
EMERGING LEADERS


15.6.3
PERVASIVE PLAYERS


15.6.4
PARTICIPANTS


15.6.5
COMPANY FOOTPRINT: KEY PLAYERS, 2025


15.6.5.1
COMPANY FOOTPRINT


15.6.5.2
REGIONAL FOOTPRINT


15.6.5.3
TYPE FOOTPRINT


15.6.5.4
APPLICATION FOOTPRINT


15.7
COMPANY EVALUATION MATRIX: STARTUPS/SMES, 2025


15.7.1
PROGRESSIVE COMPANIES


15.7.2
RESPONSIVE COMPANIES


15.7.3
DYNAMIC COMPANIES


15.7.4
STARTING BLOCKS


15.7.5
COMPETITIVE BENCHMARKING: STARTUPS/SMES, 2025


15.7.5.1
DETAILED LIST OF KEY STARTUPS/SMES


15.7.5.2
COMPETITIVE BENCHMARKING OF KEY STARTUPS/SMES


15.8
COMPANY VALUATION AND FINANCIAL METRICS


15.9
COMPETITIVE SCENARIO


15.9.1
PRODUCT LAUNCHES


15.9.2
DEALS


15.9.3
EXPANSIONS


16
COMPANY PROFILES
In-depth Company Profiles of Leading Market Players with detailed Business Overview, Product and Service Portfolio, Recent Developments, and Unique Analyst Perspective (MnM View)


217
 
16.1
KEY PLAYERS


16.1.1
BASF SE


16.1.1.1
BUSINESS OVERVIEW


16.1.1.2
PRODUCTS OFFERED


16.1.1.3
RECENT DEVELOPMENTS


16.1.1.4
MNM VIEW


16.1.1.4.1
KEY STRENGTHS


16.1.1.4.2
STRATEGIC CHOICES


16.1.1.4.3
WEAKNESSES AND COMPETITIVE THREATS


16.1.2
CYANOTECH CORPORATION


16.1.3
DSM-FIRMENICH


16.1.4
GIVAUDAN


16.1.5
ZHEJIANG NHU CO., LTD.


16.1.6
DIVI'S LABORATORIES LIMITED


16.1.7
LYCORED


16.1.8
ALLIED BIOTECH CORPORATION


16.1.9
KEMIN INDUSTRIES, INC.


16.1.10
EW NUTRITION


16.1.11
DÖHLER GMBH


16.1.12
SOLABIA GROUP


16.1.13
AMBE PHYTOEXTRACTS PVT. LTD.


16.1.14
FUJI CHEMICAL INDUSTRIES CO., LTD.


16.1.15
E.I.D. - PARRY (INDIA) LIMITED


16.1.16
BIO-GEN EXTRACTS PVT. LTD.


16.1.17
INGEX BOTANICALS PVT. LTD.


16.1.18
NR CHEMBIO


16.1.19
KUEHNLE AGROSYSTEMS INC.


16.1.20
DYNADIS SARL


16.1.21
BGG WORLD


16.1.22
ALGALIF


16.1.23
KALSEC INC.


16.1.24
VIDYA HERBS


16.1.25
ASTAMAZ NZ LTD.


17
RESEARCH METHODOLOGY


271
 
17.1
RESEARCH DATA


17.1.1
SECONDARY DATA


17.1.1.1
KEY DATA FROM SECONDARY SOURCES


17.1.2
PRIMARY DATA


17.1.2.1
KEY DATA FROM PRIMARY SOURCES


17.1.2.2
BREAKDOWN OF PRIMARY PROFILES


17.1.2.3
KEY INSIGHTS FROM INDUSTRY EXPERTS


17.2
MARKET SIZE ESTIMATION


17.2.1
TOP-DOWN APPROACH


17.2.2
SUPPLY-SIDE ANALYSIS


17.2.3
BOTTOM-UP APPROACH (DEMAND SIDE)


17.3
DATA TRIANGULATION AND MARKET BREAKUP


17.4
RESEARCH ASSUMPTIONS


17.5
RESEARCH LIMITATIONS AND RISK ASSESSMENT


18
ADJACENT & RELATED MARKETS


281
 
18.1
INTRODUCTION


18.2
RESEARCH LIMITATIONS


18.3
FOOD COLORS MARKET


18.3.1
MARKET DEFINITION


18.3.2
MARKET OVERVIEW


18.3.3
FOOD COLORS MARKET, BY TYPE


18.4
ASTAXANTHIN MARKET


18.4.1
MARKET DEFINITION


18.4.2
MARKET OVERVIEW


18.4.3
ASTAXANTHIN MARKET, BY FORM


19
APPENDIX


286
 
19.1
DISCUSSION GUIDE


19.2
KNOWLEDGESTORE: MARKETSANDMARKETS’ SUBSCRIPTION PORTAL


19.3
CUSTOMIZATION OPTIONS


19.4
RELATED REPORTS


19.5
AUTHOR DETAILS


LIST OF TABLES


TABLE 1
USD EXCHANGE RATES, 2021–2025


TABLE 2
SOURCES OF CAROTENOIDS AND THEIR MEDICINAL PROPERTIES


TABLE 3
CAROTENOIDS MARKET: PORTER’S FIVE FORCES ANALYSIS


TABLE 4
ROLE OF COMPANIES IN ECOSYSTEM (SUPPLY CHAIN)


TABLE 5
INDICATIVE AVERAGE SELLING PRICE TREND OF CAROTENOIDS, BY REGION, 2022–2025 (USD/TONS)


TABLE 6
INDICATIVE AVERAGE SELLING PRICE TREND OF CAROTENOIDS, BY TYPE, 2022–2025 (USD/TONS)


TABLE 7
TOP IMPORTERS IN CAROTENOIDS MARKET, 2022–2025 (USD MILLION)


TABLE 8
TOP EXPORTERS IN CAROTENOIDS MARKET, 2022–2025, USD MILLION


TABLE 9
TOP IMPORTERS OF CAROTENOIDS MARKET, 2022–2025, (USD MILLION)


TABLE 10
TOP EXPORTERS IN CAROTENOIDS MARKET, 2022–2025 (USD MILLION)


TABLE 11
CAROTENOIDS MARKET: LIST OF KEY CONFERENCES AND EVENTS, 2026–2027


TABLE 12
PATENTS PERTAINING TO CAROTENOIDS MARKET, 2021–2026


TABLE 13
TOP USE CASES AND MARKET POTENTIAL


TABLE 14
BEST PRACTICES: COMPANIES IMPLEMENTING USE CASES


TABLE 15
INTERCONNECTED ADJACENT ECOSYSTEM AND IMPACT ON MARKET PLAYERS


TABLE 16
NORTH AMERICA: LIST OF REGULATORY BODIES, GOVERNMENT AGENCIES, AND OTHER ORGANIZATIONS


TABLE 17
EUROPE: LIST OF REGULATORY BODIES, GOVERNMENT AGENCIES, AND OTHER ORGANIZATIONS


TABLE 18
ASIA PACIFIC: LIST OF REGULATORY BODIES, GOVERNMENT AGENCIES, AND OTHER ORGANIZATIONS


TABLE 19
SOUTH AMERICA: LIST OF REGULATORY BODIES, GOVERNMENT AGENCIES, AND OTHER ORGANIZATIONS


TABLE 20
REST OF THE WORLD: LIST OF REGULATORY BODIES, GOVERNMENT AGENCIES, AND OTHER ORGANIZATIONS


TABLE 21
INTERNATIONAL: LIST OF REGULATORY BODIES, GOVERNMENT AGENCIES, AND OTHER ORGANIZATIONS


TABLE 22
LABELING REQUIREMENTS AND CLAIMS IN CAROTENOIDS MARKET


TABLE 23
CAROTENOIDS MARKET: CERTIFICATIONS, LABELING, AND ECO-STANDARDS


TABLE 24
INFLUENCE OF STAKEHOLDERS ON BUYING PROCESS FOR KEY APPLICATIONS


TABLE 25
KEY BUYING CRITERIA FOR TOP APPLICATIONS


TABLE 26
UNMET NEEDS IN CAROTENOIDS MARKET, BY APPLICATION INDUSTRY (SUPPLY CHAIN)


TABLE 27
COST DYNAMICS IN CAROTENOIDS MARKET


TABLE 28
MARGIN OPPORTUNITIES IN CAROTENOIDS MARKET, BY APPLICATION


TABLE 29
CAROTENOIDS MARKET, BY TYPE, 2022–2025 (USD MILLION)


TABLE 30
CAROTENOIDS MARKET, BY TYPE, 2026–2031 (USD MILLION)


TABLE 31
CAROTENOIDS MARKET, BY TYPE, 2022–2025 (TONS)


TABLE 32
CAROTENOIDS MARKET, BY TYPE, 2026–2031 (TONS)


TABLE 33
BETA-CAROTENE: CAROTENOIDS MARKET, BY REGION, 2022–2025 (USD MILLION)


TABLE 34
BETA-CAROTENE: CAROTENOIDS MARKET, BY REGION, 2026–2031 (USD MILLION)


TABLE 35
BETA-CAROTENE: CAROTENOIDS MARKET, BY REGION, 2022–2025 (TONS)


TABLE 36
BETA-CAROTENE: CAROTENOIDS MARKET, BY REGION, 2026–2031 (TONS)


TABLE 37
ASTAXANTHIN: CAROTENOIDS MARKET, BY REGION, 2022–2025 (USD MILLION)


TABLE 38
ASTAXANTHIN: CAROTENOIDS MARKET, BY REGION, 2026–2031 (USD MILLION)


TABLE 39
ASTAXANTHIN: CAROTENOIDS MARKET, BY REGION, 2022–2025 (TONS)


TABLE 40
ASTAXANTHIN: CAROTENOIDS MARKET, BY REGION, 2026–2031 (TONS)


TABLE 41
LUTEIN: CAROTENOIDS MARKET, BY REGION, 2022–2025 (USD MILLION)


TABLE 42
LUTEIN: CAROTENOIDS MARKET, BY REGION, 2026–2031 (USD MILLION)


TABLE 43
LUTEIN: CAROTENOIDS MARKET, BY REGION, 2022–2025 (TONS)


TABLE 44
LUTEIN: CAROTENOIDS MARKET, BY REGION, 2026–2031 (TONS)


TABLE 45
LYCOPENE: CAROTENOIDS MARKET, BY REGION, 2022–2025 (USD MILLION)


TABLE 46
LYCOPENE: CAROTENOIDS MARKET, BY REGION, 2026–2031 (USD MILLION)


TABLE 47
LYCOPENE: CAROTENOIDS MARKET, BY REGION, 2022–2025 (TONS)


TABLE 48
LYCOPENE: CAROTENOIDS MARKET, BY REGION, 2026–2031 (TONS)


TABLE 49
ZEAXANTHIN: CAROTENOIDS MARKET, BY REGION, 2022–2025 (USD MILLION)


TABLE 50
ZEAXANTHIN: CAROTENOIDS MARKET, BY REGION, 2026–2031 (USD MILLION)


TABLE 51
ZEAXANTHIN: CAROTENOIDS MARKET, BY REGION, 2022–2025 (TONS)


TABLE 52
ZEAXANTHIN: CAROTENOIDS MARKET, BY REGION, 2026–2031 (TONS)


TABLE 53
CANTHAXANTHIN: CAROTENOIDS MARKET, BY REGION, 2022–2025 (USD MILLION)


TABLE 54
CANTHAXANTHIN: CAROTENOIDS MARKET, BY REGION, 2026–2031 (USD MILLION)


TABLE 55
CANTHAXANTHIN: CAROTENOIDS MARKET, BY REGION, 2022–2025 (TONS)


TABLE 56
CANTHAXANTHIN: CAROTENOIDS MARKET, BY REGION, 2026–2031 (TONS)


TABLE 57
OTHER TYPES: CAROTENOIDS MARKET, BY REGION, 2022–2025 (USD MILLION)


TABLE 58
OTHER TYPES: CAROTENOIDS MARKET, BY REGION, 2026–2031 (USD MILLION)


TABLE 59
OTHER TYPES: CAROTENOIDS MARKET, BY REGION, 2022–2025 (TONS)


TABLE 60
OTHER TYPES: CAROTENOIDS MARKET, BY REGION, 2026–2031 (TONS)


TABLE 61
CAROTENOIDS MARKET, BY APPLICATION, 2022–2025 (USD MILLION)


TABLE 62
CAROTENOIDS MARKET, BY APPLICATION, 2026–2031 (USD MILLION)


TABLE 63
ANIMAL FEED: CAROTENOIDS MARKET, BY REGION, 2022–2025 (USD MILLION)


TABLE 64
ANIMAL FEED: CAROTENOIDS MARKET, BY REGION, 2026–2031 (USD MILLION)


TABLE 65
DIETARY SUPPLEMENTS: CAROTENOIDS MARKET, BY REGION, 2022–2025 (USD MILLION)


TABLE 66
DIETARY SUPPLEMENTS: CAROTENOIDS MARKET, BY REGION, 2026–2031 (USD MILLION)


TABLE 67
FOOD & BEVERAGES: CAROTENOIDS MARKET, BY REGION, 2022–2025 (USD MILLION)


TABLE 68
FOOD & BEVERAGES: CAROTENOIDS MARKET, BY REGION, 2026–2031 (USD MILLION)


TABLE 69
COSMETICS: CAROTENOIDS MARKET, BY REGION, 2022–2025 (USD MILLION)


TABLE 70
COSMETICS: CAROTENOIDS MARKET, BY REGION, 2026–2031 (USD MILLION)


TABLE 71
PHARMACEUTICALS: CAROTENOIDS MARKET, BY REGION, 2022–2025 (USD MILLION)


TABLE 72
PHARMACEUTICALS: CAROTENOIDS MARKET, BY REGION, 2026–2031 (USD MILLION)


TABLE 73
CAROTENOIDS MARKET, BY NATURE, 2022–2025 (USD MILLION)


TABLE 74
CAROTENOIDS MARKET, BY NATURE, 2026–2031 (USD MILLION)


TABLE 75
SYNTHETIC: CAROTENOIDS MARKET, BY REGION, 2022–2025 (USD MILLION)


TABLE 76
SYNTHETIC: CAROTENOIDS MARKET, BY REGION, 2026–2031 (USD MILLION)


TABLE 77
NATURAL: CAROTENOIDS MARKET, BY REGION, 2022–2025 (USD MILLION)


TABLE 78
NATURAL: CAROTENOIDS MARKET, BY REGION, 2026–2031 (USD MILLION)


TABLE 79
CAROTENOIDS FORMS OFFERED BY KEY COMPNIES


TABLE 80
CAROTENOIDS MARKET, BY FORMULATION, 2022–2025 (USD MILLION)


TABLE 81
CAROTENOIDS MARKET, BY FORMULATION, 2026–2031 (USD MILLION)


TABLE 82
BEADLETS: CAROTENOIDS MARKET, BY REGION, 2022–2025 (USD MILLION)


TABLE 83
BEADLETS: CAROTENOIDS MARKET, BY REGION, 2026–2031 (USD MILLION)


TABLE 84
POWDERS: CAROTENOIDS MARKET, BY REGION, 2022–2025 (USD MILLION)


TABLE 85
POWDERS: CAROTENOIDS MARKET, BY REGION, 2026–2031 (USD MILLION)


TABLE 86
OIL SUSPENSIONS: CAROTENOIDS MARKET, BY REGION, 2022–2025 (USD MILLION)


TABLE 87
OIL SUSPENSIONS: CAROTENOIDS MARKET, BY REGION, 2026–2031 (USD MILLION)


TABLE 88
EMULSIONS: CAROTENOIDS MARKET, BY REGION, 2022–2025 (USD MILLION)


TABLE 89
EMULSIONS: CAROTENOIDS MARKET, BY REGION, 2026–2031 (USD MILLION)


TABLE 90
CAROTENOIDS MARKET, BY REGION, 2022–2025 (USD MILLION)


TABLE 91
CAROTENOIDS MARKET, BY REGION, 2026–2031 (USD MILLION)


TABLE 92
CAROTENOIDS MARKET, BY REGION, 2022–2025 (TONS)


TABLE 93
CAROTENOIDS MARKET, BY REGION, 2026–2031 (TONS)


TABLE 94
NORTH AMERICA: CAROTENOIDS MARKET, BY COUNTRY, 2022–2025 (USD MILLION)


TABLE 95
NORTH AMERICA: CAROTENOIDS MARKET, BY COUNTRY, 2026–2031 (USD MILLION)


TABLE 96
NORTH AMERICA: CAROTENOIDS MARKET, BY TYPE, 2022–2025 (USD MILLION)


TABLE 97
NORTH AMERICA: CAROTENOIDS MARKET, BY TYPE, 2026–2031 (USD MILLION)


TABLE 98
NORTH AMERICA: CAROTENOIDS MARKET, BY TYPE, 2022–2025 (TONS)


TABLE 99
NORTH AMERICA: CAROTENOIDS MARKET, BY TYPE, 2026–2031 (TONS)


TABLE 100
NORTH AMERICA: CAROTENOIDS MARKET, BY APPLICATION, 2022–2025 (USD MILLION)


TABLE 101
NORTH AMERICA: CAROTENOIDS MARKET, BY APPLICATION, 2026–2031 (USD MILLION)


TABLE 102
NORTH AMERICA: CAROTENOIDS MARKET, BY FORMULATION, 2022–2025 (USD MILLION)


TABLE 103
NORTH AMERICA: CAROTENOIDS MARKET, BY FORMULATION, 2026–2031 (USD MILLION)


TABLE 104
NORTH AMERICA: CAROTENOIDS MARKET, BY NATURE, 2022–2025 (USD MILLION)


TABLE 105
NORTH AMERICA: CAROTENOIDS MARKET, BY NATURE, 2026–2031 (USD MILLION)


TABLE 106
US: CAROTENOIDS MARKET, BY APPLICATION, 2022–2025 (USD MILLION)


TABLE 107
US: CAROTENOIDS MARKET, BY APPLICATION, 2026–2031 (USD MILLION)


TABLE 108
CANADA: CAROTENOIDS MARKET, BY APPLICATION, 2022–2025 (USD MILLION)


TABLE 109
CANADA: CAROTENOIDS MARKET, BY APPLICATION, 2026–2031 (USD MILLION)


TABLE 110
MEXICO: CAROTENOIDS MARKET, BY APPLICATION, 2022–2025 (USD MILLION)


TABLE 111
MEXICO: CAROTENOIDS MARKET, BY APPLICATION, 2026–2031 (USD MILLION)


TABLE 112
EUROPE: CAROTENOIDS MARKET, BY COUNTRY, 2022–2025 (USD MILLION)


TABLE 113
EUROPE: CAROTENOIDS MARKET, BY COUNTRY, 2026–2031 (USD MILLION)


TABLE 114
EUROPE: CAROTENOIDS MARKET, BY TYPE, 2022–2025 (USD MILLION)


TABLE 115
EUROPE: CAROTENOIDS MARKET, BY TYPE, 2026–2031 (USD MILLION)


TABLE 116
EUROPE: CAROTENOIDS MARKET, BY TYPE, 2022–2025 (TONS)


TABLE 117
EUROPE: CAROTENOIDS MARKET, BY TYPE, 2026–2031 (TONS)


TABLE 118
EUROPE: CAROTENOIDS MARKET, BY APPLICATION, 2022–2025 (USD MILLION)


TABLE 119
EUROPE: CAROTENOIDS MARKET, BY APPLICATION, 2026–2031 (USD MILLION)


TABLE 120
EUROPE: CAROTENOIDS MARKET, BY FORMULATION, 2022–2025 (USD MILLION)


TABLE 121
EUROPE: CAROTENOIDS MARKET, BY FORMULATION, 2026–2031 (USD MILLION)


TABLE 122
EUROPE: CAROTENOIDS MARKET, BY NATURE, 2022–2025 (USD MILLION)


TABLE 123
EUROPE: CAROTENOIDS MARKET, BY NATURE, 2026–2031 (USD MILLION)


TABLE 124
GERMANY: CAROTENOIDS MARKET, BY APPLICATION, 2022–2025 (USD MILLION)


TABLE 125
GERMANY: CAROTENOIDS MARKET, BY APPLICATION, 2026–2031 (USD MILLION)


TABLE 126
FRANCE: CAROTENOIDS MARKET, BY APPLICATION, 2022–2025 (USD MILLION)


TABLE 127
FRANCE: CAROTENOIDS MARKET, BY APPLICATION, 2026–2031 (USD MILLION)


TABLE 128
SPAIN: CAROTENOIDS MARKET, BY APPLICATION, 2022–2025 (USD MILLION)


TABLE 129
SPAIN: CAROTENOIDS MARKET, BY APPLICATION, 2026–2031 (USD MILLION)


TABLE 130
ITALY: CAROTENOIDS MARKET, BY APPLICATION, 2022–2025 (USD MILLION)


TABLE 131
ITALY: CAROTENOIDS MARKET, BY APPLICATION, 2026–2031(USD MILLION)


TABLE 132
NETHERLANDS: CAROTENOIDS MARKET, BY APPLICATION, 2022–2025 (USD MILLION)


TABLE 133
NETHERLANDS: CAROTENOIDS MARKET, BY APPLICATION, 2026–2031 (USD MILLION)


TABLE 134
RUSSIA: CAROTENOIDS MARKET, BY APPLICATION, 2022–2025 (USD MILLION)


TABLE 135
RUSSIA: CAROTENOIDS MARKET, BY APPLICATION, 2026–2031 (USD MILLION)


TABLE 136
REST OF EUROPE: CAROTENOIDS MARKET, BY APPLICATION, 2022–2025 (USD MILLION)


TABLE 137
REST OF EUROPE: CAROTENOIDS MARKET, BY APPLICATION, 2026–2031(USD MILLION)


TABLE 138
ASIA PACIFIC: CAROTENOIDS MARKET, BY COUNTRY, 2022–2025 (USD MILLION)


TABLE 139
ASIA PACIFIC: CAROTENOIDS MARKET, BY COUNTRY, 2026–2031 (USD MILLION)


TABLE 140
ASIA PACIFIC: CAROTENOIDS MARKET, BY TYPE, 2022–2025 (USD MILLION)


TABLE 141
ASIA PACIFIC: CAROTENOIDS MARKET, BY TYPE, 2026–2031 (USD MILLION)


TABLE 142
ASIA PACIFIC: CAROTENOIDS MARKET, BY TYPE, 2022–2025 (TONS)


TABLE 143
ASIA PACIFIC: CAROTENOIDS MARKET, BY TYPE, 2026–2031 (TONS)


TABLE 144
ASIA PACIFIC: CAROTENOIDS MARKET, BY APPLICATION, 2022–2025 (USD MILLION)


TABLE 145
ASIA PACIFIC: CAROTENOIDS MARKET, BY APPLICATION, 2026–2031 (USD MILLION)


TABLE 146
ASIA PACIFIC: CAROTENOIDS MARKET, BY FORMULATION, 2022–2025 (USD MILLION)


TABLE 147
ASIA PACIFIC: CAROTENOIDS MARKET, BY FORMULATION, 2026–2031 (USD MILLION)


TABLE 148
ASIA PACIFIC: CAROTENOIDS MARKET, BY NATURE, 2022–2025 (USD MILLION)


TABLE 149
ASIA PACIFIC: CAROTENOIDS MARKET, BY NATURE, 2026–2031 (USD MILLION)


TABLE 150
CHINA: CAROTENOIDS MARKET, BY APPLICATION, 2022–2025 (USD MILLION)


TABLE 151
CHINA: CAROTENOIDS MARKET, BY APPLICATION, 2026–2031 (USD MILLION)


TABLE 152
JAPAN: CAROTENOIDS MARKET, BY APPLICATION, 2022–2025 (USD MILLION)


TABLE 153
JAPAN: CAROTENOIDS MARKET, BY APPLICATION, 2026–2031 (USD MILLION)


TABLE 154
INDIA: CAROTENOIDS MARKET, BY APPLICATION, 2022–2025 (USD MILLION)


TABLE 155
INDIA: CAROTENOIDS MARKET, BY APPLICATION, 2026–2031 (USD MILLION)


TABLE 156
AUSTRALIA & NEW ZEALAND: CAROTENOIDS MARKET, BY APPLICATION, 2022–2025 (USD MILLION)


TABLE 157
AUSTRALIA & NEW ZEALAND: CAROTENOIDS MARKET, BY APPLICATION, 2026–2031 (USD MILLION)


TABLE 158
INDONESIA: CAROTENOIDS MARKET, BY APPLICATION, 2022–2025 (USD MILLION)


TABLE 159
INDONESIA: CAROTENOIDS MARKET, BY APPLICATION, 2026–2031 (USD MILLION)


TABLE 160
THAILAND: CAROTENOIDS MARKET, BY APPLICATION, 2022–2025 (USD MILLION)


TABLE 161
THAILAND: CAROTENOIDS MARKET, BY APPLICATION, 2026–2031 (USD MILLION)


TABLE 162
MALAYSIA: CAROTENOIDS MARKET, BY APPLICATION, 2022–2025 (USD MILLION)


TABLE 163
MALAYSIA: CAROTENOIDS MARKET, BY APPLICATION, 2026–2031 (USD MILLION)


TABLE 164
REST OF ASIA PACIFIC: CAROTENOIDS MARKET, BY APPLICATION, 2022–2025 (USD MILLION)


TABLE 165
REST OF ASIA PACIFIC: CAROTENOIDS MARKET, BY APPLICATION, 2026–2031 (USD MILLION)


TABLE 166
SOUTH AMERICA: CAROTENOIDS MARKET, BY COUNTRY, 2022–2025 (USD MILLION)


TABLE 167
SOUTH AMERICA: CAROTENOIDS MARKET, BY COUNTRY, 2026–2031 (USD MILLION)


TABLE 168
SOUTH AMERICA: CAROTENOIDS MARKET, BY TYPE, 2022–2025 (USD MILLION)


TABLE 169
SOUTH AMERICA: CAROTENOIDS MARKET, BY TYPE, 2026–2031 (USD MILLION)


TABLE 170
SOUTH AMERICA: CAROTENOIDS MARKET, BY TYPE, 2022–2025 (TONS)


TABLE 171
SOUTH AMERICA: CAROTENOIDS MARKET, BY TYPE, 2026–2031 (TONS)


TABLE 172
SOUTH AMERICA: CAROTENOIDS MARKET, BY APPLICATION, 2022–2025 (USD MILLION)


TABLE 173
SOUTH AMERICA: CAROTENOIDS MARKET, BY APPLICATION, 2026–2031 (USD MILLION)


TABLE 174
SOUTH AMERICA: CAROTENOIDS MARKET, BY FORMULATION, 2022–2025 (USD MILLION)


TABLE 175
SOUTH AMERICA: CAROTENOIDS MARKET, BY FORMULATION, 2026–2031 (USD MILLION)


TABLE 176
SOUTH AMERICA: CAROTENOIDS MARKET, BY NATURE, 2022–2025 (USD MILLION)


TABLE 177
SOUTH AMERICA: CAROTENOIDS MARKET, BY NATURE, 2026–2031 (USD MILLION)


TABLE 178
BRAZIL: CAROTENOIDS MARKET, BY APPLICATION, 2022–2025 (USD MILLION)


TABLE 179
BRAZIL: CAROTENOIDS MARKET, BY APPLICATION, 2026–2031 (USD MILLION)


TABLE 180
ARGENTINA: CAROTENOIDS MARKET, BY APPLICATION, 2022–2025 (USD MILLION)


TABLE 181
ARGENTINA: CAROTENOIDS MARKET, BY APPLICATION, 2026–2031 (USD MILLION)


TABLE 182
REST OF SOUTH AMERICA: CAROTENOIDS MARKET, BY APPLICATION, 2022–2025 (USD MILLION)


TABLE 183
REST OF SOUTH AMERICA: CAROTENOIDS MARKET, BY APPLICATION, 2026–2031 (USD MILLION)


TABLE 184
REST OF THE WORLD: CAROTENOIDS MARKET, BY REGION, 2022–2025


TABLE 185
REST OF THE WORLD: CAROTENOIDS MARKET, BY REGION, 2026–2031


TABLE 186
REST OF THE WORLD: CAROTENOIDS MARKET, BY TYPE, 2022–2025 (USD MILLION)


TABLE 187
REST OF THE WORLD: CAROTENOIDS MARKET, BY TYPE, 2026–2031 (USD MILLION)


TABLE 188
REST OF THE WORLD: CAROTENOIDS MARKET, BY TYPE, 2022–2025 (TONS)


TABLE 189
REST OF THE WORLD: CAROTENOIDS MARKET, BY TYPE, 2026–2031 (TONS)


TABLE 190
REST OF THE WORLD: CAROTENOIDS MARKET, BY FORMULATION, 2022–2025 (USD MILLION)


TABLE 191
REST OF THE WORLD: CAROTENOIDS MARKET, BY FORMULATION, 2026–2031 (USD MILLION)


TABLE 192
REST OF THE WORLD: CAROTENOIDS MARKET, BY NATURE, 2022–2025 (USD MILLION)


TABLE 193
REST OF THE WORLD: CAROTENOIDS MARKET, BY NATURE, 2026–2031 (USD MILLION)


TABLE 194
MIDDLE EAST: CAROTENOIDS MARKET, BY APPLICATION, 2022–2025


TABLE 195
MIDDLE EAST: CAROTENOIDS MARKET, BY APPLICATION, 2026–2031


TABLE 196
AFRICA: CAROTENOIDS MARKET, BY APPLICATION, 2022–2025 (USD MILLION)


TABLE 197
AFRICA: CAROTENOIDS MARKET, BY APPLICATION, 2026–2031 (USD MILLION)


TABLE 198
OVERVIEW OF STRATEGIES ADOPTED BY KEY CAROTENOIDS MARKET PLAYERS, 2023–2025


TABLE 199
CAROTENOIDS MARKET: DEGREE OF COMPETITION, 2025


TABLE 200
CAROTENOIDS MARKET: REGIONAL FOOTPRINT


TABLE 201
CAROTENOIDS MARKET: TYPE FOOTPRINT


TABLE 202
CAROTENOIDS MARKET: APPLICATION FOOTPRINT


TABLE 203
CAROTENOIDS MARKET: KEY STARTUPS/SMES


TABLE 204
CAROTENOIDS MARKET: COMPETITIVE BENCHMARKING OF STARTUPS/SMES


TABLE 205
CAROTENOIDS MARKET: PRODUCT LAUNCHES, 2022–AUGUST 2026


TABLE 206
CAROTENOIDS MARKET: DEALS, 2022–AUGUST 2026


TABLE 207
CAROTENOIDS MARKET: EXPANSIONS, 2022–AUGUST 2026


TABLE 208
BASF SE: COMPANY OVERVIEW


TABLE 209
BASF SE: PRODUCTS OFFERED


TABLE 210
BASF SE: EXPANSIONS


TABLE 211
CYANOTECH CORPORATION: COMPANY OVERVIEW


TABLE 212
CYANOTECH CORPORATION: PRODUCTS OFFERED


TABLE 213
CYANOTECH CORPORATION: PRODUCT LAUNCHES


TABLE 214
DSM-FIRMENICH: COMPANY OVERVIEW


TABLE 215
DSM-FIRMENICH: PRODUCTS OFFERED


TABLE 216
DSM-FIRMENICH: DEALS


TABLE 217
DSM-FIRMENICH: EXPANSIONS


TABLE 218
GIVAUDAN: COMPANY OVERVIEW


TABLE 219
GIVAUDAN: PRODUCTS OFFERED


TABLE 220
GIVAUDAN: DEALS


TABLE 221
ZHEJIANG NHU CO., LTD.: COMPANY OVERVIEW


TABLE 222
ZHEJIANG NHU CO., LTD: PRODUCTS OFFERED


TABLE 223
DIVI'S LABORATORIES LIMITED: COMPANY OVERVIEW


TABLE 224
DIVI'S LABORATORIES LIMITED: PRODUCTS OFFERED


TABLE 225
DIVI'S LABORATORIES LIMITED: PRODUCT LAUNCHES


TABLE 226
LYCORED: COMPANY OVERVIEW


TABLE 227
LYCORED: PRODUCTS OFFERED


TABLE 228
LYCORED: PRODUCT LAUNCHES


TABLE 229
LYCORED: EXPANSIONS


TABLE 230
ALLIED BIOTECH CORPORATION: COMPANY OVERVIEW


TABLE 231
ALLIED BIOTECH CORPORATION: PRODUCTS OFFERED


TABLE 232
ALLIED BIOTECH CORPORATION: PRODUCT LAUNCHES


TABLE 233
KEMIN INDUSTRIES, INC.: COMPANY OVERVIEW


TABLE 234
KEMIN INDUSTRIES, INC.: PRODUCTS OFFERED


TABLE 235
KEMIN INDUSTRIES, INC.: PRODUCT LAUNCHES


TABLE 236
KEMIN INDUSTRIES, INC.: DEALS


TABLE 237
KEMIN INDUSTRIES, INC.: EXPANSIONS


TABLE 238
EW NUTRITION: COMPANY OVERVIEW


TABLE 239
EW NUTRITION: PRODUCTS OFFERED


TABLE 240
EW NUTRITION: DEALS


TABLE 241
DÖHLER GMBH: COMPANY OVERVIEW


TABLE 242
DÖHLER GMBH: PRODUCTS OFFERED


TABLE 243
DÖHLER GMBH: DEALS


TABLE 244
SOLABIA GROUP: COMPANY OVERVIEW


TABLE 245
SOLABIA GROUP: PRODUCTS OFFERED


TABLE 246
AMBE PHYTOEXTRACTS PVT. LTD..: COMPANY OVERVIEW


TABLE 247
AMBE PHYTOEXTRACTS PVT. LTD.: PRODUCTS OFFERED


TABLE 248
FUJI CHEMICAL INDUSTRIES CO., LTD.: COMPANY OVERVIEW


TABLE 249
FUJI CHEMICAL INDUSTRIES CO., LTD.: PRODUCTS OFFERED


TABLE 250
FUJI CHEMICAL INDUSTRIES CO., LTD.: PRODUCT LAUNCHES


TABLE 251
E.I.D. – PARRY (INDIA) LIMITED.: COMPANY OVERVIEW


TABLE 252
E.I.D. – PARRY (INDIA) LIMITED: PRODUCTS OFFERED


TABLE 253
BIO-GEN EXTRACTS PVT. LTD.: COMPANY OVERVIEW


TABLE 254
BIO-GEN EXTRACTS PVT. LTD.: PRODUCTS OFFERED


TABLE 255
BIO-GEN EXTRACTS PVT. LTD.: OTHER DEVELOPMENTS


TABLE 256
INGEX BOTANICALS PVT. LTD.: COMPANY OVERVIEW


TABLE 257
INGEX BOTANICALS PVT. LTD.: PRODUCTS OFFERED


TABLE 258
NR CHEMBIO: COMPANY OVERVIEW


TABLE 259
NR CHEMBIO: PRODUCTS OFFERED


TABLE 260
KUEHNLE AGROSYSTEMS INC.: COMPANY OVERVIEW


TABLE 261
KUEHNLE AGROSYSTEMS INC.: PRODUCTS OFFERED


TABLE 262
KUEHNLE AGROSYSTEMS INC: DEALS


TABLE 263
KUEHNLE AGROSYSTEMS INC.: OTHER DEVELOPMENTS


TABLE 264
DYNADIS SARL.: COMPANY OVERVIEW


TABLE 265
DYNADIS SARL: PRODUCTS OFFERED


TABLE 266
BGG WORLD: COMPANY OVERVIEW


TABLE 267
ALGALIF: COMPANY OVERVIEW


TABLE 268
KALSEC INC.: COMPANY OVERVIEW


TABLE 269
VIDYA HERBS: COMPANY OVERVIEW


TABLE 270
ASTAMAZ NZ LTD.: COMPANY OVERVIEW


TABLE 271
ADJACENT MARKETS TO CAROTENOIDS MARKET


TABLE 272
FOOD COLORS MARKET, BY TYPE, 2023–2028 (USD MILLION)


TABLE 273
ASTAXANTHIN MARKET, BY FORM, 2021–2026 (USD MILLION)


LIST OF FIGURES


FIGURE 1
MARKET SCENARIO


FIGURE 2
CAROTENOIDS MARKET, 2022–2031


FIGURE 3
MAJOR STRATEGIES ADOPTED BY KEY PLAYERS IN CAROTENOIDS MARKET, APRIL 2021–JANUARY 2026


FIGURE 4
DISRUPTIONS INFLUENCING GROWTH OF CAROTENOIDS MARKET


FIGURE 5
CAROTENOIDS MARKET: HIGH-GROWTH SEGMENTS, 2026–2031


FIGURE 6
ASIA PACIFIC TO REGISTER HIGHEST CAGR DURING FORECAST PERIOD


FIGURE 7
RISING DEMAND FOR NATURAL, CLEAN-LABEL, AND FUNCTIONAL INGREDIENTS TO DRIVE MARKET


FIGURE 8
ASTAXANTHIN SEGMENT AND EUROPE TO ACCOUNT FOR LARGEST MARKET SHARES IN 2026


FIGURE 9
ASTAXANTHIN TYPE SEGMENT TO LEAD MARKET IN 2026


FIGURE 10
SYNTHETIC SEGMENT TO DOMINATE MARKET IN 2026


FIGURE 11
ANIMAL FEED SEGMENT TO ACCOUNT FOR LARGEST MARKET SHARE IN 2026


FIGURE 12
BEADLETS SEGMENT TO ACCOUNT FOR LARGEST MARKET SHARE IN 2026


FIGURE 13
US TO ACCOUNT FOR LARGEST MARKET SHARE IN 2026


FIGURE 14
CAROTENOIDS MARKET: DRIVERS, RESTRAINTS, OPPORTUNITIES, AND CHALLENGES


FIGURE 15
CAROTENOIDS MARKET: PORTER’S FIVE FORCES ANALYSIS


FIGURE 16
CAROTENOIDS MARKET: VALUE CHAIN ANALYSIS


FIGURE 17
CAROTENOIDS MARKET: ECOSYSTEM ANALYSIS


FIGURE 18
AVERAGE SELLING PRICE OF CAROTENOID-BASED FINISHED PRODUCTS, BY PRODUCT TYPE, 2025 (USD)


FIGURE 19
INDICATIVE AVERAGE SELLING PRICE TREND OF CAROTENOIDS, BY REGION, 2022–2025 (USD/TONS)


FIGURE 20
INDICATIVE AVERAGE SELLING PRICE TREND OF CAROTENOIDS, BY TYPE, 2022–2025 (USD/TONS)


FIGURE 21
IMPORT OF HS CODE 320300, BY KEY COUNTRY, 2021–2025 (USD MILLION)


FIGURE 22
EXPORT OF HS CODE 320300, BY KEY COUNTRY, 2021–2025 (USD MILLION)


FIGURE 23
IMPORT OF HS CODE 320418, BY KEY COUNTRY, 2022–2025 (USD MILLION)


FIGURE 24
EXPORT OF HS CODE 320418, BY KEY COUNTRY, 2022–2025 (USD MILLION)


FIGURE 25
TRENDS/DISRUPTIONS INFLUENCING CUSTOMER BUSINESS


FIGURE 26
INVESTMENT AND FUNDING SCENARIO


FIGURE 27
NUMBER OF PATENTS APPLIED AND GRANTED, 2016–2026


FIGURE 28
FUTURE APPLICATIONS


FIGURE 29
CAROTENOIDS MARKET: DECISION-MAKING FACTORS


FIGURE 30
INFLUENCE OF STAKEHOLDERS ON BUYING PROCESS FOR KEY APPLICATIONS


FIGURE 31
KEY BUYING CRITERIA FOR TOP APPLICATIONS


FIGURE 32
ADOPTION BARRIERS AND INTERNAL CHALLENGES


FIGURE 33
CAROTENOIDS MARKET, BY TYPE, 2026 VS. 2031 (USD MILLION)


FIGURE 34
CAROTENOIDS MARKET, BY APPLICATION, 2026 VS. 2031 (USD MILLION)


FIGURE 35
CAROTENOIDS MARKET, BY NATURE, 2026 VS. 2031 (USD MILLION)


FIGURE 36
CAROTENOIDS MARKET, BY FORMULATION, 2026 VS. 2031 (USD MILLION)


FIGURE 37
CAROTENOIDS MARKET, BY COUNTRY/REGION (2026–2031)


FIGURE 38
EUROPE: CAROTENOIDS MARKET SNAPSHOT


FIGURE 39
ASIA PACIFIC: CAROTENOIDS MARKET SNAPSHOT


FIGURE 40
CAROTENOIDS MARKET: REVENUE ANALYSIS OF KEY PLAYERS, 2023–2025 (USD BILLION)


FIGURE 41
SHARE ANALYSIS OF CAROTENOIDS MARKET, 2025


FIGURE 42
CAROTENOIDS MARKET: COMPARATIVE ANALYSIS OF VENDOR BRANDS/PRODUCTS


FIGURE 43
CAROTENOIDS MARKET: COMPANY EVALUATION MATRIX (KEY PLAYERS), 2025


FIGURE 44
CAROTENOIDS MARKET: COMPANY FOOTPRINT


FIGURE 45
CAROTENOIDS MARKET: COMPANY EVALUATION MATRIX (STARTUPS/SMES), 2025


FIGURE 46
COMPANY VALUATION FOR MAJOR PLAYERS IN CAROTENOIDS MARKET


FIGURE 47
EV/EBITDA OF MAJOR PLAYERS


FIGURE 48
BASF SE: COMPANY SNAPSHOT


FIGURE 49
CYANOTECH CORPORATION: COMPANY SNAPSHOT


FIGURE 50
DSM-FIRMENICH: COMPANY SNAPSHOT


FIGURE 51
GIVAUDAN: COMPANY SNAPSHOT


FIGURE 52
ZHEJIANG NHU CO., LTD.: COMPANY SNAPSHOT


FIGURE 53
DIVI'S LABORATORIES LIMITED: COMPANY SNAPSHOT


FIGURE 54
E.I.D. – PARRY (INDIA) LIMITED: COMPANY OVERVIEW


FIGURE 55
CAROTENOIDS MARKET: RESEARCH DESIGN


FIGURE 56
BREAKDOWN OF PRIMARY INTERVIEWS: BY COMPANY TYPE, DESIGNATION, AND REGION


FIGURE 57
MARKET SIZE ESTIMATION METHODOLOGY: TOP-DOWN APPROACH


FIGURE 58
SUPPLY-SIDE ANALYSIS: SOURCES OF INFORMATION AT EVERY STEP


FIGURE 59
CAROTENOIDS MARKET SIZE ESTIMATION: BOTTOM-UP APPROACH


FIGURE 60
DATA TRIANGULATION


Methodology

This study involved two major approaches in estimating the current size of the carotenoids market. Exhaustive secondary research was conducted to collect information on the type, application, nature, form, and function (qualitative) segments of the market. The next step involved validating these findings, assumptions, and sizing with industry experts across the value chain through primary research. Both top-down and bottom-up approaches were employed to estimate the complete market size. Thereafter, data triangulation was used to estimate the market size of segments and subsegments.

Secondary Research

This research study involved the use of extensive secondary sources—directories and databases such as Bloomberg Businessweek and Factiva—to identify and collect information useful for a technical, market-oriented, and commercial market study. In the secondary research process, sources such as annual reports, press releases & investor presentations of companies, white papers, food journals, certified publications, articles from recognized authors, directories, and databases were referred to to identify and collect information. Secondary research was mainly used to obtain key information about the industry’s supply chain, the pool of key players, and market classification and segmentation as per the industry trends to the bottom-most level, regional markets, and key developments from market- and technology-oriented perspectives.

Primary Research

Extensive primary research was conducted after obtaining information regarding the carotenoids market scenario through secondary research. Several primary interviews were conducted with market experts from the demand and supply sides across major countries of North America, Europe, Asia Pacific, South America, and the Rest of the World. Primary data was collected through questionnaires, emails, and telephonic interviews. The primary sources from the supply side included various industry experts, such as chief experience officers (CXOs), vice presidents (VPs), directors from business development, marketing, research, and development teams, and related key executives from distributors and key opinion leaders. Primary interviews were conducted to gather insights such as market statistics, data on revenue collected from the products and services, market breakdowns, market size estimations, market forecasting, and data triangulation. Primary research also helped understand the various trends related to type, application, nature, form, function and region. Stakeholders from the demand side, such as food and beverage manufacturers, dietary supplement and nutraceutical manufacturers, animal feed and aquaculture companies, pharmaceutical companies, cosmetics and personal care manufacturers, food and cosmetic formulators, and ingredient distributors and retailers, were interviewed to understand buyers’ perspectives on carotenoid suppliers, products, formulation requirements, quality and stability, pricing, regulatory requirements, and the outlook of their businesses, which will affect the overall market.

Breakdown of Primary Interviews
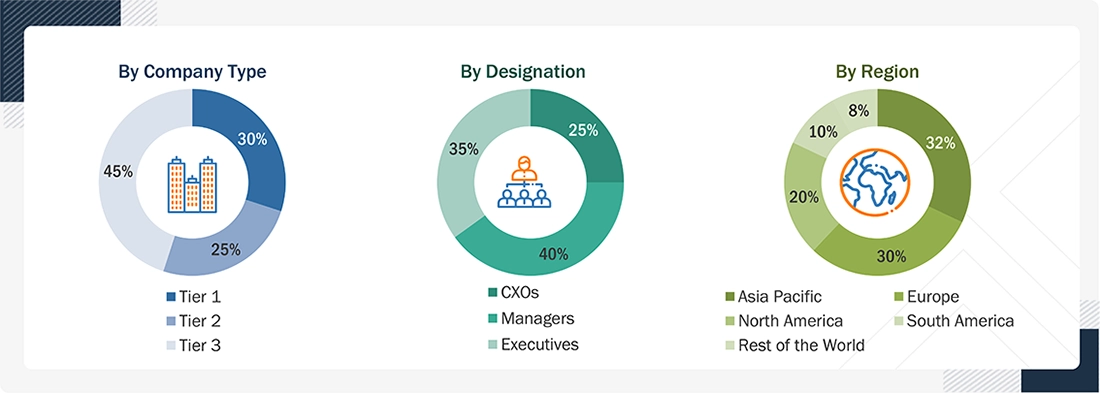
Carotenoids Market Size, and Share

Note: The three tiers of the companies are defined based on their total revenues in 2024 or 2025, as per the availability of financial data: Tier 1: Revenue >USD 1 billion; Tier 2: USD 100 million ≤ revenue ≤ USD 1 billion; Tier 3: Revenue <USD 100 million. Rest of the World includes Africa and the Middle East.

COMPANY NAME

DESIGNATION

Fuji Chemical Industries Co., Ltd. (Japan)

Product Development Manager

Cyanotech Corporation (US)

Sales Head

Givaudan (Switzerland)

Marketing Head

Lycored (Israel)

Sales Head

Allied Biotech Corporation (Taiwan)

Senior Research Executive

EW Nutrition (Germany)

Business Development Manager

To know about the assumptions considered for the study, download the pdf brochure

Market Size Estimation

The top-down and bottom-up approaches were used to estimate and validate the total size of the carotenoids market. These approaches were also used extensively to determine the size of various subsegments in the market. The research methodology used to estimate the market size includes the following details:

  • The key players in the industry and the overall market were identified through extensive secondary research.
  • All shares, splits, and breakdowns were determined using secondary sources and verified through primary sources.
  • All possible parameters that affect the market covered in this research study were accounted for, viewed in extensive detail, verified through primary research, and analyzed to obtain final quantitative and qualitative data.
  • The research included the study of reports, reviews, and newsletters of top market players, along with extensive interviews for opinions from leaders, such as CEOs, directors, and marketing executives.

Carotenoids Market : Top-Down and Bottom-Up Approach
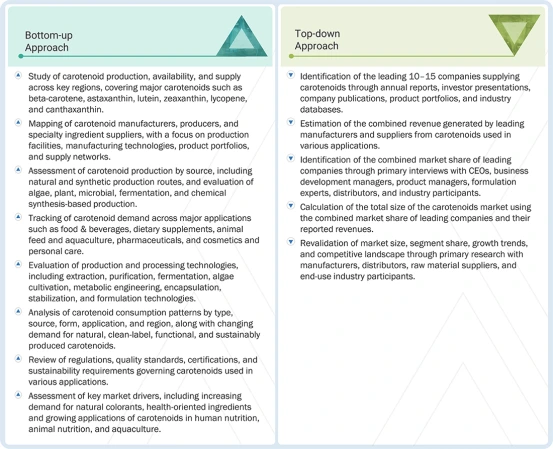
Carotenoids Market Top Down and Bottom Up Approach

Data Triangulation

After determining the overall market size from the estimation process explained above, the total market was split into several segments and subsegments. The data triangulation procedure was employed, wherever applicable, to estimate the overall carotenoids market and arrive at the exact statistics for all segments and subsegments. The data was triangulated by studying various factors and trends from the demand and supply sides. The market size was also validated using both the top-down and bottom-up approaches.

Market Definition

Carotenoids refer to naturally occurring or synthetically produced yellow, orange, and red pigments that are used as functional ingredients across food and beverage, animal feed, dietary supplements, pharmaceuticals, cosmetics, and personal care applications. These compounds provide coloring, antioxidant, nutritional, and other functional properties, with certain carotenoids such as beta-carotene also serving as sources of provitamin A.

The market comprises major carotenoids such as beta-carotene, astaxanthin, lutein, lycopene, zeaxanthin, and canthaxanthin, obtained from natural sources such as plants, algae, fungi, and microorganisms, as well as through synthetic production. These carotenoids are commercially available in formulations including powders, beadlets, oil suspensions, emulsions, and liquid forms, and are valued for their color stability, nutritional properties, antioxidant activity, bioavailability, and compatibility with diverse product formulations.

Key Stakeholders

  • Raw material suppliers, including producers of algae, plants, fruits, vegetables, microorganisms, fermentation feedstocks, and chemical intermediates used for natural and synthetic carotenoid production
  • Carotenoid manufacturers and processors, including producers of beta-carotene, astaxanthin, lutein, zeaxanthin, lycopene, canthaxanthin, and other carotenoids in natural and synthetic forms
  • Intermediate stakeholders, including ingredient distributors, traders, contract manufacturers, formulation solution providers, packaging suppliers, logistics providers, regulatory bodies, certification organizations, and industry associations
  • Manufacturers and brand owners across food and beverage, dietary supplements and nutraceuticals, animal feed and aquaculture, pharmaceuticals, cosmetics, and personal care industries using carotenoids for coloring, nutritional, antioxidant, pigmentation, and functional applications
  • Ingredient solution providers and formulation developers, including specialty ingredient manufacturers, premix and blending companies, formulation consultants, and application development centers involved in improving carotenoid stability, bioavailability, dispersibility, and formulation compatibility
  • Government organizations and regulatory authorities responsible for food additives, feed additives, dietary supplements, pharmaceutical ingredients, cosmetic ingredients, labeling, product safety, quality standards, and regulatory compliance
  • Research institutes, universities, testing laboratories, and technology providers involved in carotenoid research, extraction, fermentation, cultivation, formulation development, stability testing, bioavailability assessment, quality evaluation, and efficacy studies
  • Food scientists, nutritionists, feed formulators, cosmetic formulators, pharmaceutical R&D scientists, product developers, quality assurance professionals, and procurement teams responsible for carotenoid selection, formulation, product development, safety assessment, quality control, and supplier evaluation
  • Associations and industry bodies:
      • Food and Agriculture Organization (FAO)
      • World Health Organization (WHO)
      • US Department of Agriculture (USDA)
      • European Commission (EC)
      • Organization for Economic Co-operation and Development (OECD)
      • European Food Safety Authority (EFSA)
      • US Food and Drug Administration (FDA)
      • Health Canada
      • European Chemicals Agency (ECHA)
      • International Organization for Standardization (ISO)
      • International Feed Industry Federation (IFIF)
      • COSMOS-standard AISBL
      • Natural Products Association (NPA)

Report Objectives

  • To determine and project the size of the carotenoids market based on type, application, nature, form, function (qualitative), and region, ranging from 2026 to 2031
  • To identify the attractive opportunities in the market by determining the largest and fastest-growing segments across regions
  • To provide detailed information about the key factors influencing market growth (drivers, restraints, opportunities, and challenges)
  • To analyze the opportunities in the market for stakeholders and provide details of the competitive landscape for market leaders
  • To analyze the micromarkets with respect to individual growth trends, prospects, and their contribution to the total market
  • To identify and profile the key players in the market
  • To understand the competitive landscape and identify the major growth strategies adopted by players across the key regions

Available customizations:

With the given market data, MarketsandMarkets offers customizations according to company-specific scientific needs. The following customization options are available for the report:

Product Analysis

  • Product matrix, which gives a detailed comparison of the product portfolio of each company.

Geographic Analysis

  • With the given market data, MarketsandMarkets offers customizations according to company-specific scientific needs.

    • Further breakdown of the Rest of Europe carotenoids market into key countries
    • Further breakdown of the Rest of Asia Pacific carotenoids market into key countries
    • Further breakdown of the Rest of South America carotenoids market into key countries

Company Information

  • Detailed analyses and profiling of additional market players (up to five)



Personalize This Research

  • Triangulate with your Own Data
  • Get Data as per your Format and Definition
  • Gain a Deeper Dive on a Specific Application, Geography, Customer or Competitor
  • Any level of Personalization
Request A Free Customisation

Let Us Help You

  • What are the Known and Unknown Adjacencies Impacting the Carotenoids Market
  • What will your New Revenue Sources be?
  • Who will be your Top Customer; what will make them switch?
  • Defend your Market Share or Win Competitors
  • Get a Scorecard for Target Partners
Customized Workshop Request

Custom Market Research Services

We Will Customise The Research For You, In Case The Report Listed Above Does Not Meet With Your Requirements

Get 10% Free Customisation

TESTIMONIALS

Growth opportunities and latent adjacency in Carotenoids Market

DMCA.com Protection Status
popup img