
Connected Worker Market Size, Share & Trends

Connected Worker Market by Wearable, Handheld, Industrial IoT Sensor & Edge Device, Communication & Connectivity, and Robotics & Automation Device, Technology (AR & VR, AI & ML, IIoT, Edge Computing), Application and Vertical - Global forecast to 2030


OVERVIEW
Source: Secondary Research, Interviews with Experts, MarketsandMarkets Analysis
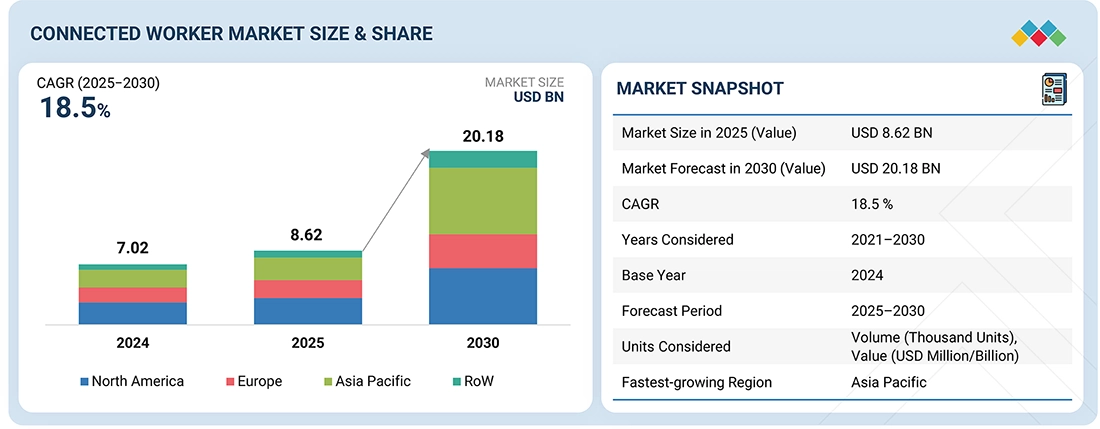
The global connected worker market is projected to grow from USD 8.62 billion in 2025 to USD 20.18 billion by 2030, at a CAGR of 18.5%, due to the industrial digitalization, the increasing adoption of safety-focused wearables, and the deployment of IoT, AI, and 5G-enabled platforms for real-time monitoring and collaboration. As industries seek higher productivity, operational efficiency, and regulatory compliance, connected worker technologies are becoming essential for streamlining workflows, reducing risks, and addressing skilled labour shortages, fuelling strong global demand throughout this period.
Market Size & Forecast
KEY TAKEAWAYS
- By region, North America connected worker market accounted for a 36.8 % revenue share in 2024.
- By offering, the hardware segment is expected to dominate the connected worker market during the forecast perod.
- By technology, the IIoT segment is expected to dominate the market.
- By connectivtiy, the 5G segment is projected to grow at the highest CAGR during the forecast period.
- By application, the training & skill development is projected to grow at the fastest rate.
- By vertical, the manufacturing segment is expected to dominate the market
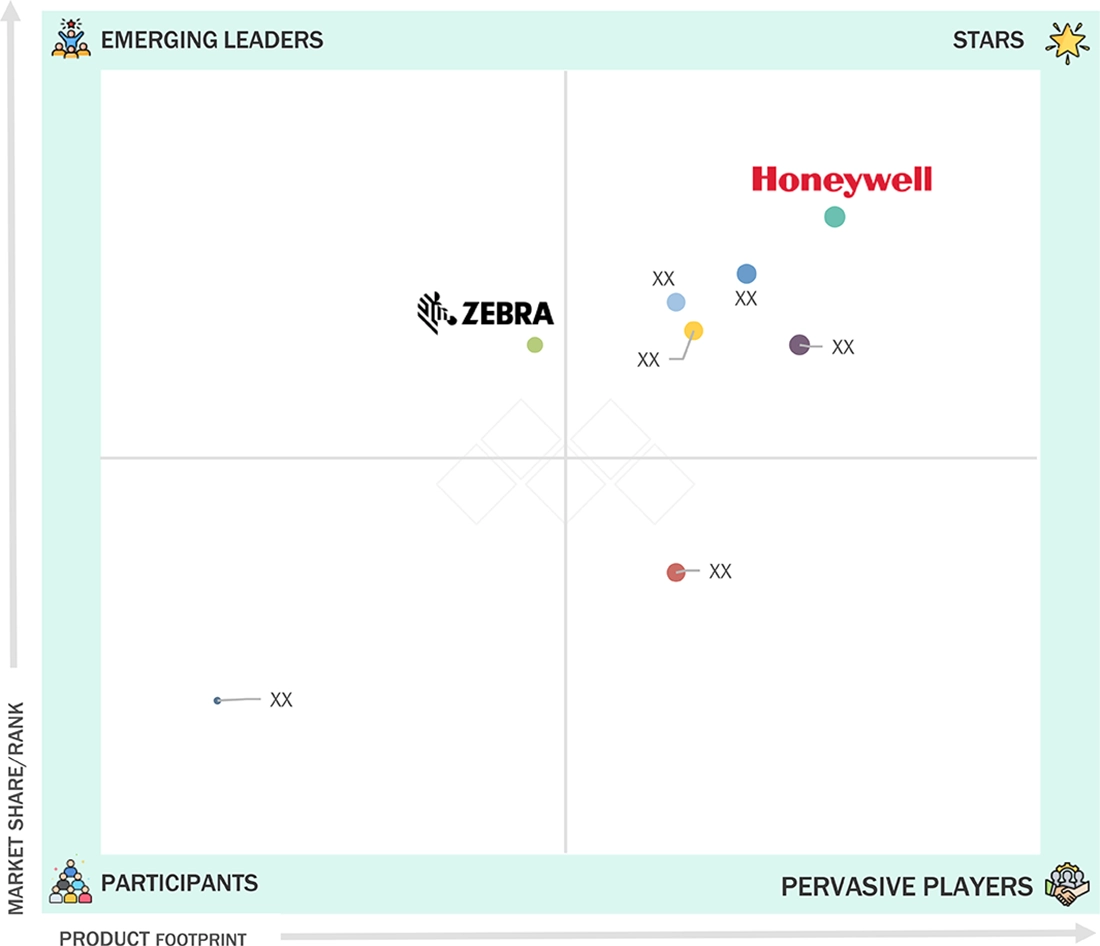
- Honeywell International Inc, Microsoft, and Siemens were identified as some of the star players in the connected worker market (global), given their strong market share and product footprint.
- RealWear Inc, POKA Inc., and Redzone, among others, have distinguished themselves among startups and SMEs by securing strong footholds in specialized niche areas, underscoring their potential as emerging market leaders
The integration of connected worker platforms with collaborative robotics and exoskeleton technologies represents a forward-looking opportunity to reshape labour-intensive industries by reducing strain, enhancing precision, and creating safer hybrid work environments. Real-world deployments highlight this potential. Soft exosuits from HeroWear have been credited with eliminating reported back injuries across over 280,000 warehouse work hours, while also reducing fatigue and discomfort among employees, as documented in Occupational Health & Safety. In parallel, firms such as German Bionic and Ekso Bionics are developing powered exoskeletons that support repetitive lifting and overhead work, enabling employees in logistics, automotive, and construction to sustain productivity with less physical risk.
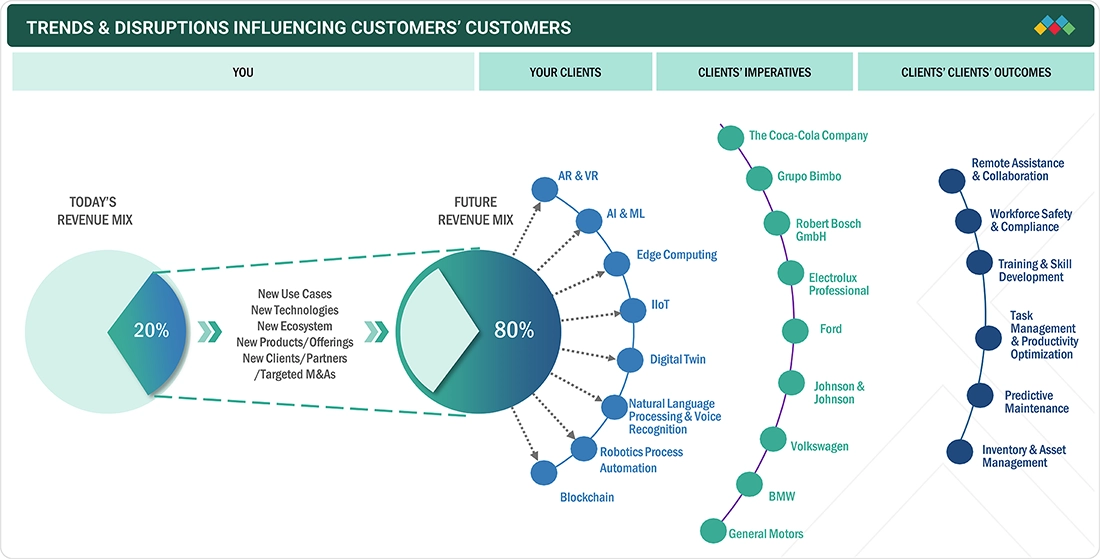
TRENDS & DISRUPTIONS IMPACTING CUSTOMERS' CUSTOMERS
The connected worker market is undergoing a significant transformation as enterprises shift from traditional hardware-centric solutions to digitally integrated frameworks. Driven by investments in AI, IoT, 5G, edge computing, and immersive technologies such as AR/VR, the revenue mix is evolving toward new sources that enhance productivity, safety, and efficiency. This disruption is reshaping customer expectations across industries, enabling leading organizations such as Coca-Cola, Ford, Johnson & Johnson, and Bosch to leverage connected worker solutions for applications ranging from remote assistance and workforce safety to predictive maintenance and asset management.
Source: Secondary Research, Interviews with Experts, MarketsandMarkets Analysis
MARKET DYNAMICS
Level
-
Integration of IoT, AI, AR/VR, and 5G

-
Requirement for data traceability, safety standards, and digital documentation in manufacturing and logistics

Level
-
High initial costs and complexity in integrating connected worker solutions with legacy systems

-
Data security and privacy concerns related to extensive workforce

Level
-
Collaborative robotics and exoskeleton integration for connected workplaces

-
Emergence of next-generation bio-sensing wearables

Level
-
Lack of user adoption and workforce resistance

-
Battery life limitations and device reliability in harsh environments

Source: Secondary Research, Interviews with Experts, MarketsandMarkets Analysis
Driver: Battery life limitations and device reliability in harsh environments
A pivotal driver in the connected worker market is the rapid expansion of cloud infrastructure, which empowers organizations to deploy scalable, secure platforms for diverse industrial use cases. Cloud-native solutions integrate wearables, IoT sensors, and AR/VR applications into centralized, remotely managed environments, making it easier to handle large, multi-site operations. This shift delivers flexibility, fast data processing, lower IT overheads, and built-in cybersecurity, enabling companies to roll out AI-driven analytics and digital workflows for tasks such as predictive maintenance, compliance tracking, and remote collaboration.
Restraint: High initial costs and complexity in integrating connected worker solutions with legacy systems
A major restraint in the connected worker market is the high upfront cost and integration complexity associated with deploying these solutions. Enterprises often require substantial investment in wearables, IoT sensors, AR/VR devices, edge infrastructure, and cloud platforms, which can strain budgets, especially for small- and medium-sized enterprises (SMEs). Beyond hardware and software acquisition, the challenge lies in integrating connected worker platforms with existing legacy IT and operational technology (OT) systems, such as ERP, MES, and SCADA. Many of these older systems lack interoperability, requiring extensive customization, middleware, and consulting services that drive up deployment timelines and costs.
Opportunity: Emergence of next-generation bio-sensing wearables
The evolution of bio-sensing wearables presents a significant future opportunity within the connected worker market, particularly as industrial sectors seek to address safety and health risks more proactively. Next-generation wearables are designed with embedded sensors that can monitor hydration, fatigue biomarkers, cognitive stress levels, and even glucose levels, offering early warnings before accidents or errors occur. Field pilots in physically demanding environments, such as construction sites, have already shown how hydration and heat-stress sensors can help prevent heat-related illnesses by alerting supervisors in real time.
Challenge: Lack of user adoption and workforce resistance
A significant challenge in the connected worker market is the lach of adoption among employees. While connected technologies—wearable devices, AR/VR tools, and AI-driven platforms—offer substantial productivity and safety benefits, many workers perceive these tools as intrusive monitoring mechanisms. Concerns about constant surveillance, data privacy, and potential job displacement due to automation contribute to this resistance. For instance, AT&T implemented an employee attendance tracking system to enforce its return-to-office policy. However, the system's inaccuracies led to significant frustration among employees, prompting the company to scale back its use. Employees expressed concerns over the system's failure to accurately track work hours, leading to fears of potential layoffs and a decline in morale.
Connected Worker Market: COMMERCIAL USE CASES ACROSS INDUSTRIES
| COMPANY | USE CASE DESCRIPTION | BENEFITS |
|---|---|---|
 |
Provides an integrated suite of connected worker solutions combining hardware (wearables, sensors) and software (Honeywell Forge) to link field workers with control rooms, digitize workflows, enable mobile inspections, and offer real-time for safety and productivity; deploys AR-enabled devices for maintenance, guided task execution, and compliance in manufacturing, energy, and critical infrastructure sectors | Enhanced workforce safety | Accelerated onboarding | Reduced downtime | Optimized regulatory compliance | Increased Plant Productivity | Business continuity, quality, and rapid incident resolution | Support for remote assistance and operational efficiency |
 |
Offers cloud-based connected worker solutions leveraging Microsoft Teams, Dynamics 365, and Azure IoT for sharing work instructions, enabling AR/VR remote guidance (via HoloLens), and automating compliance; facilitates seamless communication, mobile collaboration, and asset visibility in manufacturing, field service, and healthcare | High workforce productivity (up to 30%) | Reduced time spent searching for data (up to 50%) | Enhanced decision-making | Simplified maintenance tasks | Improved collaboration, especially through hands-free, secure communication and remote support for frontline staff |
 |
Integrates field personnel, IoT devices, AR-guided workflows, and analytics for manufacturing and utility clients; features include mobile access to operational data, visual instructions, remote expert support, and real-time updates for inspection and maintenance rounds | 30% reduction in maintenance time | Increased uptime and worker safety | Rapid resolution of field issues | Continuous process improvement | Better knowledge retention and workforce training, leading to higher operational agility |
 |
Enables operational agility through a digitally connected workforce using sensors, mobile devices, and cloud technology for asset management, compliance, workflow digitization, and real-time collaboration; applies AR/VR for visual guidance (leveraging platforms such as AVEVA Teamwork) and integrates process knowledge directly into work environments | Improved productivity by streamlining work execution | Enhanced quality and regulatory compliance | Continuous improvement and better collaboration | Reduced risk | Enhanced data-driven decision-making | Shortened onboarding | Sustained process knowledge despite workforce turnover |
 |
Delivers comprehensive connected worker solutions using ThingWorx IIoT, Vuforia AR, and Windchill PLM platforms; automates workflows, provides digital work instructions, enables real-time performance, and facilitates remote coaching for manufacturing and service sectors | Double-digit KPI improvements in workforce productivity, quality, and enterprise collaboration | Reduced assembly time | Service efficiency | Accelerated new hire training | Minimized process deviations through closed-loop feedback and digitalized best practices |
Logos and trademarks shown above are the property of their respective owners. Their use here is for informational and illustrative purposes only.
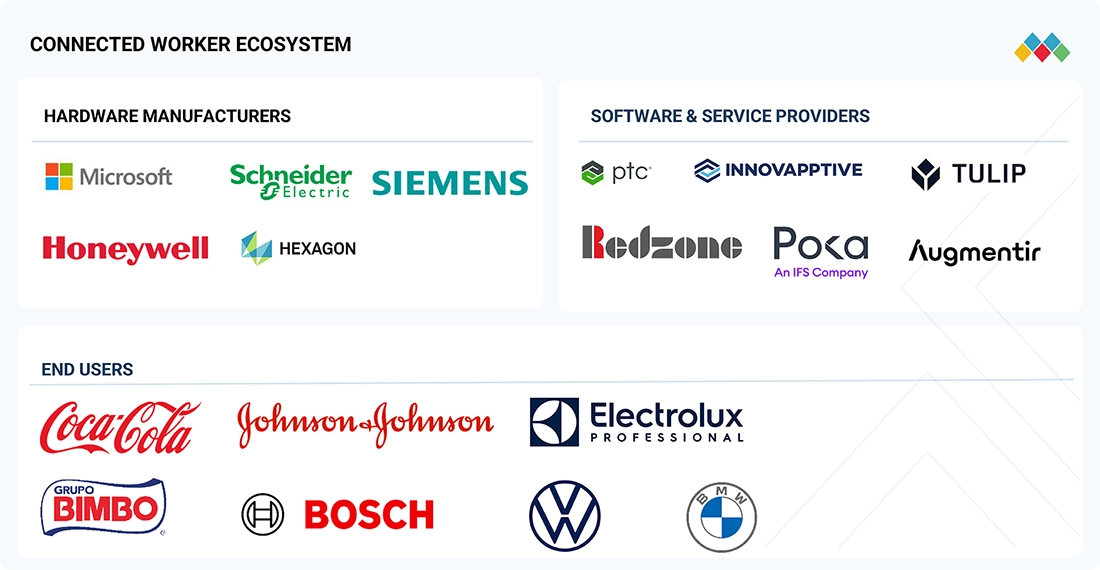
MARKET ECOSYSTEM
The ecosystem analysis of the connected worker industry , highlights three core groups: hardware manufacturers, software & service providers, and end users. Hardware manufacturers, such as RealWear, Schneider Electric, Hexagon, Microsoft, Siemens, Zebra Technologies, Honeywell, Librestream, and VSight, supply essential devices and platforms that enable real-time communication, safety, and productivity for front-line workers. Software and service providers, including PTC, Innovapptive, Tulip, Redzone, Poka, Augmentir, Plutomen, and Treedis, offer cloud platforms, workflow automation, analytics, AR/VR applications, and compliance solutions, underpinning digital transformation throughout various industries. End users span diverse verticals, from food & beverage (Coca-Cola, Grupo Bimbo) and healthcare (Johnson & Johnson), to automotive and manufacturing (Bosch, Electrolux, BMW, Volkswagen, GM, Ford). These companies rely on connected worker technologies to enhance operational visibility, remote collaboration, compliance, and overall efficiency across distributed workforces. The interplay among these ecosystem players is critical to delivering integrated, scalable connected worker solutions, accelerating digital adoption, and addressing sector-specific challenges through close collaboration and innovation.
Logos and trademarks shown above are the property of their respective owners. Their use here is for informational and illustrative purposes only.
MARKET SEGMENTS
Source: Secondary Research, Interviews with Experts, MarketsandMarkets Analysis
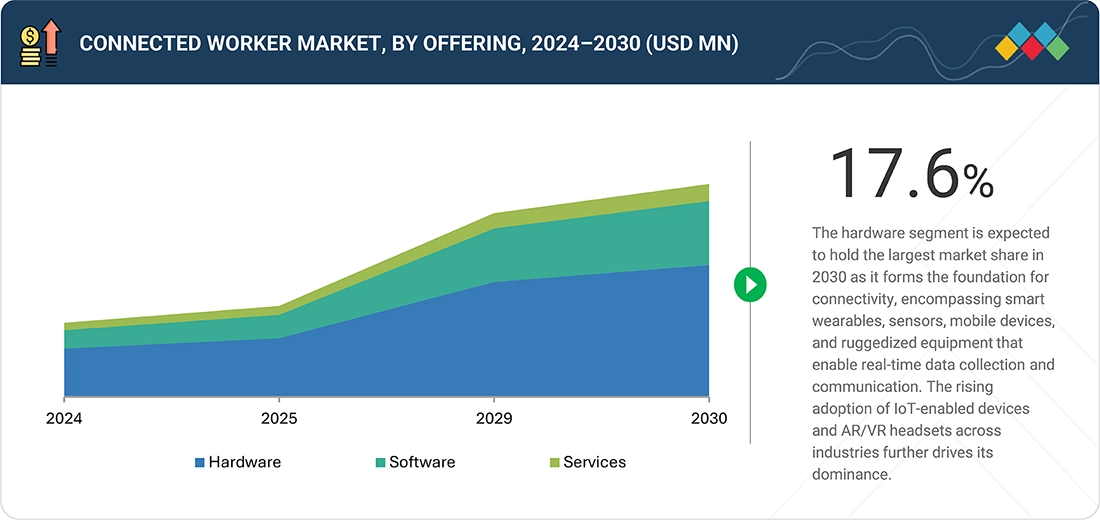
Connected Worker Market, by Offering
The software segment is projected to record the highest CAGR in the connected worker market, owing to the rising adoption of digital and cloud-based platforms that enhance real-time communication, collaboration, and workflow automation. Industries such as manufacturing, oil & gas, utilities, and construction are increasingly deploying software solutions, including workforce management, AR tools, and safety monitoring systems, to boost productivity, compliance, and worker safety. With greater scalability, flexibility, and integration potential, software has emerged as the central enabler of the connected worker ecosystem.
Connected Worker Market, by Technology
Artificial intelligence (AI) & machine learning (ML) are expected to register the highest growth rate in the connected worker market due to their ability to enable predictive maintenance, intelligent safety monitoring, and real-time decision support. By analyzing vast amounts of worker and equipment data, AI and ML optimize workflows, detect anomalies, and enhance operational efficiency. Their growing use across industries such as manufacturing, energy, oil & gas, and logistics supports safer, smarter, and more efficient workplaces. As organizations advance toward Industry 4.0, AI and ML are becoming the key technologies driving the evolution of connected worker solutions.
Connected Worker Market, by Connectivity
5G connectivity is projected to grow at the highest CAGR in the connected worker market, driven by its ultra-low latency, high bandwidth, and reliability that enable real-time communication, remote monitoring, and advanced applications, such as AR/VR training and digital twins. Supporting massive IoT device integration and uninterrupted data exchange, 5G is essential for safety, predictive maintenance, and mission-critical operations across industries such as manufacturing, mining, oil & gas, and utilities. As digital transformation accelerates, 5G is emerging as the backbone of next-generation connected worker platforms, delivering superior efficiency, responsiveness, and scalability.
Connected Worker Market, by Application
The connected worker market applications focus on improving real-time collaboration, safety, training, task management, and operational efficiency. Remote assistance tools enable workers to communicate and solve problems instantly, while workforce safety and compliance solutions monitor hazards and automate reporting. Training and skill development use technologies such as AR/VR to accelerate learning and onboarding. Task management systems help optimize productivity through streamlined workflows. Predictive maintenance leverages sensor data and AI to prevent equipment failure, and inventory and asset management solutions improve tracking and resource utilization. These applications collectively empower workers to perform more effectively and safely in dynamic industrial environments
Connected Worker Market, by Vertical
The connected worker market by vertical includes diverse industries that leverage connected worker solutions to enhance safety, productivity, and operational efficiency. The manufacturing vertical leads adoption with real-time monitoring and workflow optimization. The oil & gas, construction, and mining verticals prioritize worker safety and remote assistance due to hazardous environments. The healthcare & pharmaceutical sector focus on compliance and safe operations, while automotive and aerospace & defense benefit from precision and traceability. Retail & warehousing and transportation & logistics sectors improve workforce management and asset tracking. Utilities & energy rely on connected technologies for field workforce coordination and infrastructure management. Other sectors also adopt connected worker solutions tailored to specific operational needs, making the ecosystem broad and dynamically evolving across verticals.
REGION
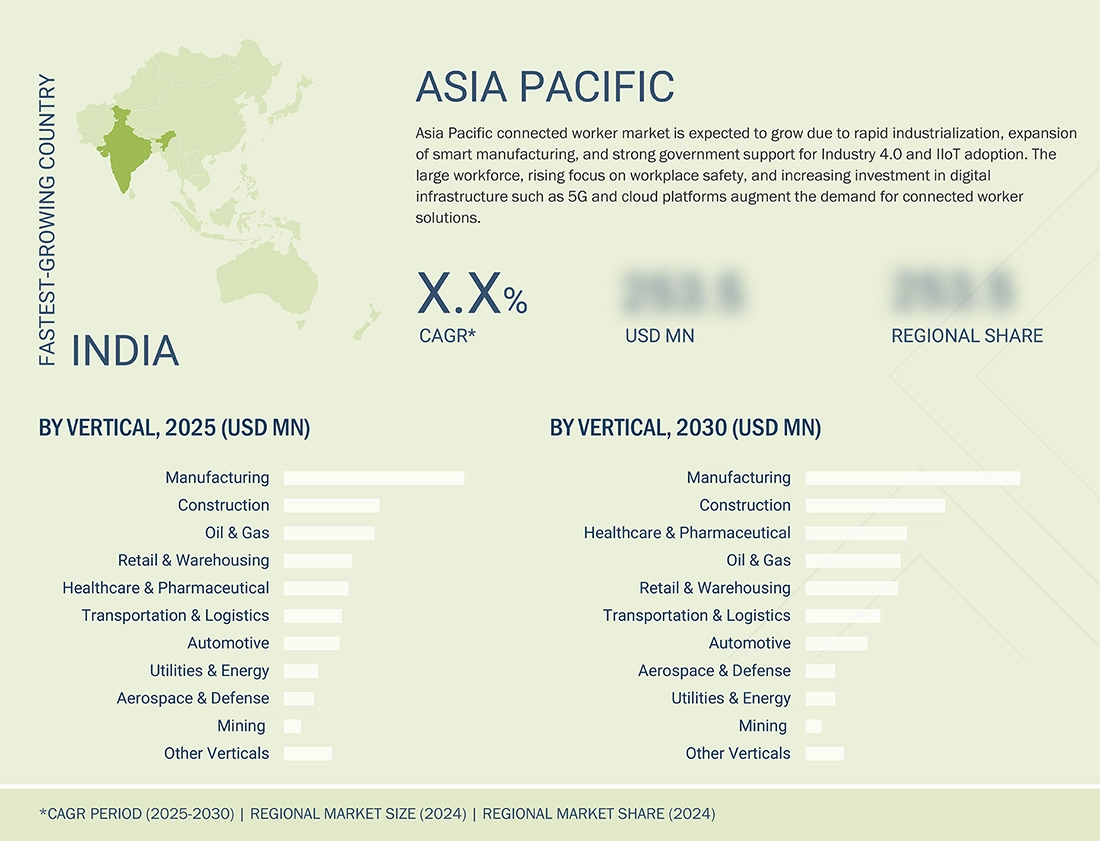
Asia Pacific to be the fastest-growing region in the global connected worker market during the forecast period
Asia Pacific expected to grow at the highest CAGR during the forecast period, which can be attributed to the rapid industrialization, large-scale adoption of Industry 4.0 practices, and the increasing investment in digital transformation across key sectors, such as manufacturing, construction, energy & utilities, and oil & gas. Countries such as China, India, Japan, and South Korea are witnessing high demand for advanced connected worker solutions, driven by expanding industrial workforces, growing emphasis on worker safety, and government initiatives promoting smart factories and digital infrastructure. Additionally, the rapid rollout of 5G networks, the strong presence of electronics and technology providers, and cost advantages in deployment accelerate the regional market growth. With enterprises focusing on improving productivity, operational efficiency, and workplace safety, the region is emerging as the most dynamic market for connected worker solutions, outpacing growth in mature regions.
Connected Worker Market: COMPANY EVALUATION MATRIX
In the connected worker market matrix, Honeywell International Inc. is positioned as a star due to its strong product footprint and dominant market share, reflecting its leadership in innovation and adoption across OEMs. Zebra Technologies Corp., on the other hand, is seen as an emerging leader, holding a significant market share but with a comparatively smaller product footprint, indicating strong growth potential as it expands its connected worker offerings.
Source: Secondary Research, Interviews with Experts, MarketsandMarkets Analysis
KEY MARKET PLAYERS
MARKET SCOPE
| REPORT METRIC | DETAILS |
|---|---|
| Market Size in 2025 (Value) | USD 8.62 Billion |
| Market Forecast in 2030 (Value) | USD 20.18 Billion |
| Growth Rate | CAGR of 18.5% from 2025-2030 |
| Years Considered | 2021-2030 |
| Base Year | 2024 |
| Forecast Period | 2025-2030 |
| Units Considered | Volume (Thousand Units) and Value (USD Million/Billion) |
| Report Coverage | Revenue forecast, company ranking, competitive landscape, growth factors, and trends |
| Segments Covered |
|
| Regions Covered | North America, Europe, Asia Pacific, and RoW |
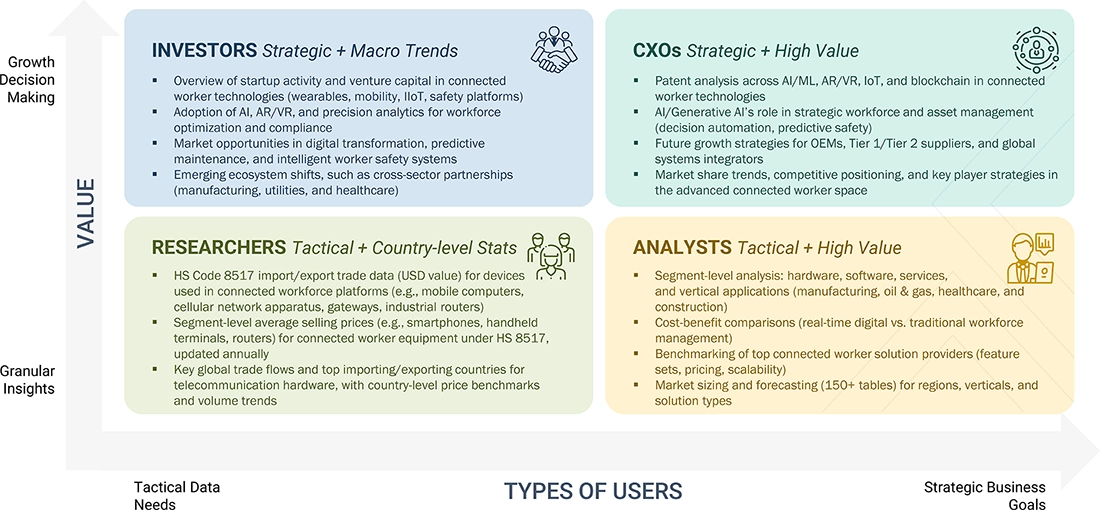
WHAT IS IN IT FOR YOU: Connected Worker Market REPORT CONTENT GUIDE
DELIVERED CUSTOMIZATIONS
We have successfully delivered the following deep-dive customizations:
| CLIENT REQUEST | CUSTOMIZATION DELIVERED | VALUE ADDS |
|---|---|---|
| Global Automotive Manufacturer | Deployment roadmap for AR/VR-based connected worker training modules across assembly lines | Reduced training time, improved worker productivity, and minimized error rates in complex assembly processes |
| European Energy & Utilities Provider | Benchmarking of wearable safety devices integrated with real-time monitoring dashboards | Strengthened worker safety compliance, improved incident response time, and minimized downtime due to accidents |
| North American Construction Firm | Cost-benefit analysis of connected worker platforms enabling remote collaboration and field reporting | Optimized project timelines, enhanced coordination between on-site and remote teams, and reduced operational delays |
| Asian Mining Company | Feasibility study of ruggedized connected worker wearables integrated with hazardous environment monitoring | Improved worker protection in extreme conditions, enabled predictive safety alerts, and reduced equipment downtime |
| Global Oil & Gas Enterprise | Regulatory benchmarking of connected worker platforms for offshore compliance and monitoring | Streamlined audit readiness, reduced compliance penalties, and strengthened safety culture across offshore operations |
RECENT DEVELOPMENTS
- January 2025 : Zebra Technologies Corp. introduced AI-powered solutions (Zebra Mobile Computing AI Suite) to enhance retail frontline operations. The new technologies are designed to optimize inventory management, streamline workflows, and improve customer experience by providing real-time insights. These innovations empower retail workers by integrating AI-driven tools to increase productivity and operational efficiency.
- January 2025 : Honeywell International Inc. and Verizon strategically collaborated to launch an integrated solution designed to streamline the retail lifecycle from procurement to customer operations. This collaboration combines Honeywell’s industry-leading hardware, software, and services with Verizon’s high-speed 5G connectivity, enhancing efficiency for retail and logistics businesses. The innovative managed service offering simplifies procurement, reduces upfront investments, and provides a scalable, future-ready solution for seamless device and data plan management.
- March 2025 : Schneider Electric launched a new generation Industrial PC and motion controller delivering real-time control, edge analytics, AI/ML integration, and modularity for advanced connected worker and automation applications, supporting seamless IT/OT convergence.
- October 2024 : Honeywell International Inc introduced a new generation of AI-capable handheld computers designed to enhance workforce productivity and customer experiences. The CT37, CK67, and CK62 mobile computers optimize workflows in demanding environments, such as warehouses and retail floors. Equipped with advanced AI capabilities, these devices streamline operations, improve efficiency, and enable workers to gain real-time insights, ensuring greater adaptability and performance in evolving business landscapes.
- January 2023 : Schneider Electric completed the acquisition of AVEVA, a leading global industrial software company. This acquisition accelerates the integration of industrial automation and software solutions, enhancing the holistic digital transformation offerings, with AVEVA maintaining business autonomy and ongoing R&D investment within Schneider’s portfolio.
Table of Contents
 Exclusive indicates content/data unique to MarketsandMarkets and not available with any competitors.
Methodology
The study involved major activities in estimating the current market size for the connected worker market. Exhaustive secondary research was done to collect information on the connected worker industry. The next step was to validate these findings and assumptions and size them with industry experts across the supply chain using primary research. Different approaches, such as top-down and bottom-up, were employed to estimate the total market size. After that, the market breakup and data triangulation procedures were used to estimate the market size of the segments and subsegments of the connected worker market.
Secondary Research
Extensive primary research was conducted after gaining knowledge about the current scenario of the connected worker market through secondary research. Several primary interviews were conducted with experts from the demand and supply sides across four major regions—North America, Europe, Asia Pacific, and RoW. This primary data was collected through questionnaires, emails, and telephonic interviews.
Primary Research
Extensive primary research has been conducted after obtaining information about the current scenario of the Direct-to-Device (D2D) market through secondary research. Several primary interviews have been conducted with market experts from the demand and supply sides across North America, Europe, the Asia Pacific, the Middle East, and the Rest of the World. This primary data has been collected through questionnaires, emails, and telephonic interviews.

Notes: RoW mainly comprises the Middle East, Africa, and South America.
Other designations include product managers, sales managers, and marketing managers.
Tier 1 companies include market players with revenues above USD 500 million; tier 2 companies earn revenues between USD 100 million and USD 500 million; and tier 3 companies earn up to USD 100 million.
To know about the assumptions considered for the study, download the pdf brochure
Market Size Estimation
The bottom-up procedure has been employed to arrive at the overall size of the connected worker market.
- Collected company-level revenues from annual reports, investor presentations, and financial disclosures to understand individual contributions to the connected worker market.
- Aggregated product-level revenues across hardware components (wearable devices, handheld devices, industrial IoT sensors & edge devices, robotics & automation hardware), software (cloud-based software & on-premises software), and services to estimate market segments.
- Summed up the company and segment-level revenues to calculate the total global market size of connected workers.
- Analyzed regional presence and deployment of connected worker solutions to validate revenue estimates and refine regional market size.
- Cross-verified data using secondary sources, industry reports, and expert interviews to ensure accuracy and reliability of the market estimation.
The top-down approach has been used to estimate and validate the total size of the connected worker market.
- The overall connected worker market size is estimated using comprehensive industry benchmarks and market data.
- Analyze the percentage split of major offerings, including hardware, software, and services.
- Derive vertical-wise percentage splits based on the offering segmentation to understand industry-specific adoption.
- Determine regional and technology splits within each vertical to capture geographic and technological nuances.
- Analyze application use cases, connectivity methods, and country-level adoption patterns for detailed granularity.
- Validate all subsegment breakouts through triangulation of primary research, expert interviews, and secondary data to ensure accuracy and reliability.
Connected Worker Market: Top-Down and Bottom-Up Approach

Data Triangulation
After arriving at the overall market size using the market size estimation processes as explained above, the market has been split into several segments and subsegments. Data triangulation and market breakdown procedures have been employed to complete the entire market engineering process and arrive at the exact statistics of each market segment and subsegment. The data has been triangulated by studying various factors and trends from the demand and supply sides in the connected worker market.
Market Definition
A connected worker is a frontline employee empowered with digital technologies that seamlessly link them to enterprise systems, operational processes, and colleagues in real time. Through the integration of wearables, mobile devices, augmented and virtual reality tools, IoT-enabled sensors, and cloud-based platforms, connected workers gain instant access to critical information, remote expertise, and data-driven insights while performing tasks in the field or on the shop floor. This digital enablement enhances situational awareness, streamlines workflows, and reduces reliance on manual or paper-based procedures. Beyond improving productivity, connected worker solutions prioritize safety by continuously monitoring worker health, location, and environmental risks, enabling organizations to proactively mitigate hazards. They also support workforce development by providing immersive, on-demand training and guided instructions. As a result, organizations adopting connected worker strategies benefit from greater operational efficiency, enhanced compliance, faster problem resolution, and a more agile and engaged workforce. Positioned at the core of Industry 4.0, the connected worker represents a fundamental shift toward smarter, safer, and more collaborative industrial operations.
Key Stakeholders
- Hardware manufacturers
- Software developers
- Telecom and connectivity providers
- Industrial enterprises (manufacturing, energy, utilities, construction, logistics, etc.)
- Frontline workers
- Labor unions and worker councils
- System integrators
- Service providers (deployment, maintenance, training)
- Regulatory bodies and standards organizations
- Investors and venture capital firms
- Research institutions and universities
Report Objectives
- To define, describe, and forecast the size of the connected worker market, by offering, technology, connectivity, application, vertical, and region, in terms of value
- To describe and forecast the size of the connected worker market, by offering, in terms of volume
-
To forecast the market for various segments with respect to four regions, namely
North America, Europe, Asia Pacific, and RoW, in terms of value - To provide macroeconomic outlooks with respect to the main regions, namely, North America, Europe, Asia Pacific, and RoW
- To provide detailed information regarding the drivers, restraints, opportunities, and challenges influencing the market’s growth
- To strategically analyze micromarkets1 with respect to individual growth trends, prospects, and contributions to the total market
- To provide ecosystem analysis, supply chain, trends/disruptions impacting customer business, technology analysis, pricing analysis, technology analysis, key stakeholders & buying criteria, case study analysis, trade analysis, patent analysis, Porter’s five forces, key conferences & events, AI impact, impact of 2025 US tariff, and regulations related to the connected worker market
- To analyze the opportunities in the market for stakeholders by identifying high-growth segments and detailing the competitive landscape for market players
- To strategically profile key players and comprehensively analyze their market rankings, core competencies, company valuation, and financial metrics, and product/brand comparison, along with detailing the competitive landscape for the market leaders
- To analyze the competitive developments, such as product launches, software launches, agreements, collaborations, and acquisitions, carried out by market players
- To map competitive intelligence based on company profiles, key player strategies, and game-changing developments, such as product developments, collaborations, and acquisitions
- To benchmark players within the market using the competitive leadership mapping framework, which analyzes market players on various parameters within the broad categories of business strategy excellence and strength of product portfolio.
Customization Options:
With the given market data, MarketsandMarkets offers customizations according to the company‘s specific needs. The following customization options are available for the report.
Company Information:
- Detailed analysis and profiling of additional market players (up to five)
Key Questions Addressed by the Report
What is the market size and growth outlook of the North America RTLS market
The North America real-time location systems market is projected to grow from USD 2.76 billion in 2025 to USD 5.95 billion by 2030 at a CAGR of 16.6%, driven by increasing demand for asset tracking and operational efficiency across industries.
Which countries and regions are driving growth in the North America RTLS market
The United States and Canada are key contributors to market growth, while Mexico is expected to register the highest CAGR due to increasing manufacturing expansion, logistics activity, and nearshoring investments.
Which segments are driving the North America RTLS market in terms of technology and applications
Wi-Fi technology holds a significant share of the market, while applications such as inventory and asset tracking, personnel monitoring, and supply chain management are key drivers supported by adoption across multiple industries.
Which industry verticals are contributing most to the RTLS market growth in North America
Transportation and logistics is one of the fastest-growing verticals, while healthcare, manufacturing, retail, and government sectors also contribute significantly due to the need for real-time visibility, safety, and workflow optimization.
Who are the key players operating in the North America RTLS market
Key players in the market include Securitas, Zebra Technologies, Impinj, Inc., Redpoint Positioning, and Quuppa, which are strengthening their presence through innovation and strong product portfolios.
Need a Tailored Report?
Customize this report to your needs
Get 10% FREE Customization
Customize This ReportPersonalize This Research
- Triangulate with your Own Data
- Get Data as per your Format and Definition
- Gain a Deeper Dive on a Specific Application, Geography, Customer or Competitor
- Any level of Personalization
Let Us Help You
- What are the Known and Unknown Adjacencies Impacting the Connected Worker Market
- What will your New Revenue Sources be?
- Who will be your Top Customer; what will make them switch?
- Defend your Market Share or Win Competitors
- Get a Scorecard for Target Partners

Custom Market Research Services
We Will Customise The Research For You, In Case The Report Listed Above Does Not Meet With Your Requirements
Get 10% Free CustomisationTESTIMONIALS

Tetsuya Ohhira
Business Development Manager-Technology Business
Nikon Corporation,
Leading Japanese MNC specializing in optics and imaging productswww.nikon.com
MarketsandMarkets™ response
is quick. Their attitude is flexible and positive. Analyst Insights are globally considered and
significant. Client Services quickly respond to our inquiry and demand. Their wide range of global
surveys help us make our strategic plan.
We hope Knowledge Store will be easier to search
for a report.
VP - Marketing & Business Development
Leading Provider of Process Control Solutions
We engaged with MarketsandMarkets on a study to perform an analysis and recommend a Go-To-Market strategy for metrology and process control in the semiconductor market. The study was tailored to our targets and needs with well-defined milestones. Our overall experience with the MarketsandMarkets team was very good throughout the project in all aspects including the analysis methodologies used, the quality and depth of primary and secondary data sets, the professionalism and flexibility of the team and the ability to meet the target schedule and milestones. We want to thank MarketsandMarkets team for a job well done.


Growth opportunities and latent adjacency in Connected Worker Market