Drug Device Combination Products Market by Type (Injectable, Transdermal Patch, Infusion Pump, Drug-eluting Stent, Inhaler), Application (Diabetes, Oncology, Pain, Opthamology), End User (Hospital, Home Care), and Region - Global Forecast to 2030

icon1
USD 379.17 BN
MARKET SIZE, 2030
icon2
CAGR 9.3%
(2025-2030)
icon3
346
REPORT PAGES
icon4
299
MARKET TABLES

OVERVIEW

Source: Secondary Research, Interviews with Experts, MarketsandMarkets Analysis

The drug device combination products market is projected to reach USD 379.17 billion by 2030, from USD 243.02 billion in 2025, at a CAGR of 9.3% during the forecast period. Globally, the increasing burden of chronic diseases like diabetes and obesity, along with a rising aging population, is expected to accelerate the demand for drug-device combination products, further boosting their adoption. Additionally, the growing emphasis on patient-centric design and government initiatives to improve affordability and accessibility are likely to drive market growth. Furthermore, increased investments in new product development and the rising adoption of home care settings and self-administration, driven by the benefits they offer, are anticipated to support the growth of the drug-device combination products market during the forecast period.

KEY TAKEAWAYS

  • BY PRODUC TYPE
    Based on product type, the market is segmented into injectable drug delivery devices, drug-eluting stents, inhalers, infusion pumps, transdermal patches, drug-eluting balloon catheters, and other drug-device combination products. Injectable drug delivery devices hold the largest share in the drug-device combination products market, as they offer precise, fast, and efficient drug administration, which is critical for treatments such as diabetes, cancer, and autoimmune diseases.
  • BY APPLICATION
    Based on application, the drug device combination products market is segmented into diabetes management, respiratory diseases, ophthalmology, infectious diseases, cardiovascular disease, autoimmune diseases, oncology, obesity management, pain management, and other applications. Diabetes management is witnessing a significant growth rate in the drug-device combination market due to increasing prevalence of diabetes, rising demand for convenient self-administration solutions, and advancements in integrated drug delivery technologies.
  • BY END USER
    Based on the end user, the drug device combination products market has been classified into hospitals and clinics, ambulatory surgery centers, long-term care facilities, home care settings, and other end users. Home care settings, as an end user, are experiencing high growth in the market, driven by the increasing preference for at-home treatments, convenience, and patient-centric care solutions.
  • BY REGION
    The APAC region is poised for high growth of 11.7%, driven by increasing healthcare expenditure, expanding access to advanced medical technologies, and rising awareness of innovative treatment options.
  • COMPETITIVE LANDSCAPE
    The major market players have adopted organic and inorganic strategies, including partnerships and collaborations. For instance, in March 2024, Novo Nordisk received the US Food and Drug Administration (FDA) approval for a label expansion for Wegovy based on a supplemental New Drug Application (sNDA) for the indication of reducing risks of major adverse cardiovascular events (MACE).

The drug-device combination products market is expected to experience steady growth over the coming decade, driven by the rising prevalence of chronic diseases and the growing emphasis on personalized and integrated treatment solutions. Technological advancements are enabling the development of more precise, user-friendly, and automated combination products, enhancing treatment efficacy and patient adherence. Furthermore, the incorporation of smart features such as real-time monitoring, data connectivity, and digital health integration is improving clinical outcomes and supporting the broader shift toward connected, patient-centric healthcare solutions.

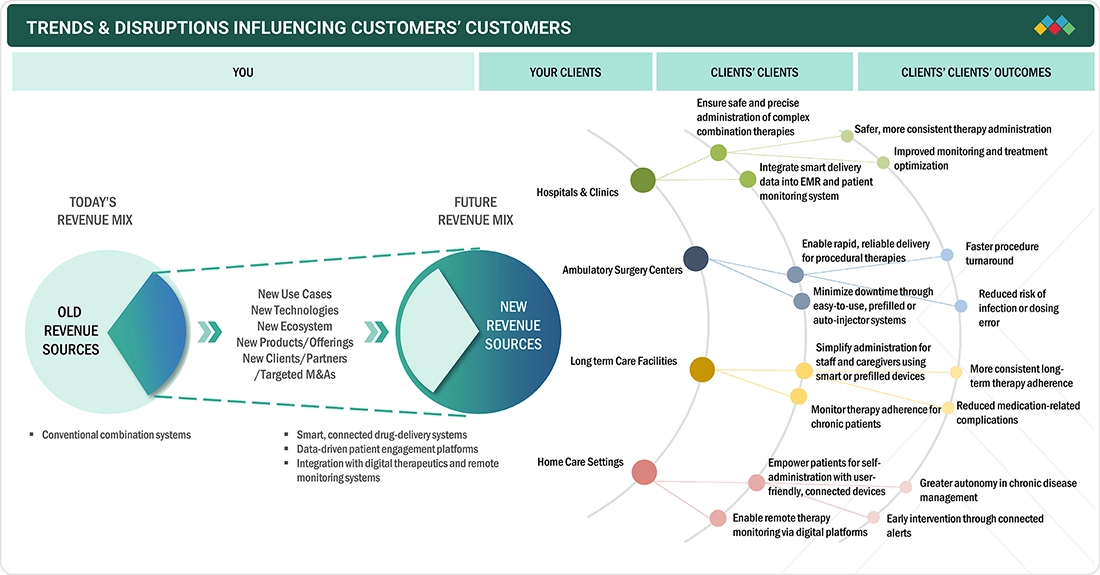
TRENDS & DISRUPTIONS IMPACTING CUSTOMERS' CUSTOMERS

The drug device combination products market is being transformed by the convergence of pharmaceuticals, medtech, and digital health. Patients and healthcare providers now expect connected, intelligent delivery systems that go beyond traditional administration to enable continuous monitoring, personalized dosing, and real-time feedback. Advances in smart injectors, digital inhalers, and wearable pumps combined with AI-driven analytics and real-world evidence are improving adherence, therapeutic precision, and patient engagement. Meanwhile, the rise of remote care and digital therapeutics is shifting the focus from product performance to integrated health outcomes, driving a move toward data-enabled, patient-centric, and outcomes-based treatment ecosystems.

Source: Secondary Research, Interviews with Experts, MarketsandMarkets Analysis

MARKET DYNAMICS

Drivers
Impact
Level
  • Rising prevalence of chronic diseases
  • Growing biologics market
RESTRAINTS
Impact
Level
  • Stringent regulatory policies and compliance hurdles
  • Increased focus on alternative drug delivery
OPPORTUNITIES
Impact
Level
  • Increase in preference for minimally invasive products
  • High growth opportunities in emerging economies
CHALLENGES
Impact
Level
  • Product malfunction and wastage of drugs
  • Lack of skilled professionals

Source: Secondary Research, Interviews with Experts, MarketsandMarkets Analysis

Driver: Rising prevalence of chronic diseases

The rising rate of chronic diseases is expected to boost demand for drug-device combination products. Factors like an aging population, poor nutrition, obesity, and sedentary lifestyles are fueling this trend. According to the International Diabetes Federation, the number of adults with diabetes is projected to grow from 588.7 million in 2025 to 853 million by 2050, with diabetes alone causing 3.4 million deaths and USD 1.015 trillion in global healthcare costs in 2024. Similarly, the World Health Organization reports that over 1 billion people are classified as obese, with an estimated 167 million expected to face health issues from overweight or obesity by 2025. These conditions, including asthma, COPD, and obstructive sleep apnea, highlight the increasing need for advanced drug delivery options. Products such as insulin pens, autoinjectors, inhalers, and wearable delivery systems are becoming more important, aiding in targeted therapy, enhancing patient adherence, and improving clinical outcomes. Consequently, the market for drug-device combination products is set for significant growth in the coming years.

Restraint: Stringent regulatory policies and compliance hurdles

Stringent regulatory frameworks continue to pose a significant obstacle to the development and commercialization of drug-device combination products (DDCPs). These frameworks limit market growth due to complex compliance standards, extended approval timelines, and increased financial risks. Regulatory agencies, such as the FDA and EMA, require conformity to both drug and device regulations, often through overlapping pathways. For example, the FDA’s Office of Combination Products determines whether a DDCP is primarily classified as a drug, device, or biologic, which in turn influences whether a New Drug Application (NDA) or Premarket Approval (PMA) is required. According to the FDA’s 2023 Annual Report, nearly 30% of submissions experience delays because of classification disputes, adding 12–18 months to approval times. The absence of global regulatory harmonization further complicates the process, as manufacturers must navigate varying standards from the EU’s MDR, China’s NMPA, and India’s CDSCO. These strict requirements continue to hinder innovation and slow down patient access to new DDCPs.

Opportunity: High growth opportunities in emerging markets

Emerging economies such as China, India, and Brazil present significant growth opportunities for drug-device combination products. In China, an aging population and increasing demand for chronic disease management are driving investments in integrated medical solutions. Similarly, India is experiencing higher healthcare spending and a focus on precision disease management, creating a favorable market for innovative combination products. These markets are also benefiting from expanding healthcare infrastructure, growing awareness of advanced treatments, and reduced production costs, making them attractive investment destinations. In the coming years, these trends are expected to speed up the development, adoption, and distribution of advanced drug-device combination solutions across the region.

Challenge: Product malfunction and wastage of drugs

Drug-device combination products (DDCPs) face significant challenges related to malfunctions and waste, which can impact patient safety, treatment efficacy, and healthcare costs. According to BD's white paper, “The Value of an Integration System for Combination Products,” these issues often arise from the poor integration of drug and device components, design flaws, and usability errors. Devices such as prefilled syringes and autoinjectors can lead to incomplete dosing, leakage, or blockages, with 5–10% of the drug volume potentially lost, increasing the need for additional supplies and raising contamination risks. Mechanical failures like autoinjector clogs or needle retraction issues and unreliable drug delivery mechanisms (e.g., stents or inhalers) further compound the problem. User errors, especially among elderly or inexperienced patients, add to the risk. Financially, manufacturers may incur high costs due to recalls, replacements, and liability claims, while hospitals face increased expenses for procurement and waste management. Regulatory scrutiny, particularly from the FDA, can also prolong approval timelines. To address these challenges, manufacturers must prioritize robust design, seamless integration of drugs and devices, and comprehensive user training to ensure reliability, enhance patient safety, and maintain commercial viability.

Drug Device Combination Products Market: COMMERCIAL USE CASES ACROSS INDUSTRIES

COMPANY USE CASE DESCRIPTION BENEFITS
Broad portfolio in cardiovascular care and diabetes management; includes drug-eluting stents, drug-coated balloons, and integrated diagnostics Enhanced patient outcomes through advanced therapy delivery, improved chronic disease management, global reach
Extensive combination therapies: drug-eluting stents, implantable infusion pumps, smart insulin pens. Innovation-driven, strong global footprint Improved care for chronic conditions, innovation in minimally invasive therapies, global healthcare access
Develops minimally invasive drug-device products, especially in cardiac and vascular fields (e.g., drug-eluting stents) Greater procedural efficacy, reduced complications, competitive portfolio in therapeutic delivery
Digital drug delivery (e.g., smart insulin pens), bespoke injection solutions for diabetes and biologics Increased medication adherence, digital engagement, innovation for chronic disease management
Integrated pharmaceuticals and devices, focusing on chronic disease therapies (oncology, diabetes, etc.) Personalized treatment options, enhanced therapy effectiveness, focus on next-generation products

Logos and trademarks shown above are the property of their respective owners. Their use here is for informational and illustrative purposes only.

MARKET ECOSYSTEM

The DDCP market is a complex ecosystem involving manufacturers, end-users, and regulatory agencies. Manufacturers, including pharmaceutical companies and medical device firms, develop drugs and delivery systems such as smart injectors, insulin pens, implantable pumps, and connected inhalers. End-users, primarily hospitals, clinics, and healthcare providers, utilize these products to manage chronic diseases, enhance patient adherence, and deliver personalized therapy. Regulatory agencies, such as the FDA and EMA, oversee safety, efficacy, and compliance, ensuring that drug-device products meet stringent standards. The ecosystem is increasingly boosted by digital health, AI-driven dosing, and wearable technologies.

Logos and trademarks shown above are the property of their respective owners. Their use here is for informational and illustrative purposes only.

MARKET SEGMENTS

Source: Secondary Research, Interviews with Experts, MarketsandMarkets Analysis

Drug Device Combination Products Market, By Product Type

The injectable drug delivery devices segment is the fastest-growing segment of the DDCP market. This growth is fueled by the precision, quick response, and targeted delivery that injectables offer, which are essential for advanced biologics and therapies that are unstable or less effective when taken orally. Devices like autoinjectors, prefilled syringes, and pen injectors are gaining popularity because they are easy to use, portable, and require minimal clinical administration. The increasing rates of chronic conditions such as cancer, rheumatoid arthritis, and diabetes are further boosting demand. Self-administration benefits patients by offering greater convenience and easing pressure on healthcare systems. Innovations like needle safety features, accurate dosing, and connected smart injectors help improve adherence, reduce user errors, and enhance the overall patient experience. Furthermore, the aging global population, rising use of biologics, and regulatory support for patient-focused designs are driving market growth. These devices are set to play a key role in the future of personalized and effective healthcare delivery.

Drug Device Combination Products Market, By Application

Diabetes management is the largest segment in the application market. This is due to the widespread prevalence of diabetes and the increasing need for accurate, convenient, and self-administered drug delivery. Devices such as insulin pens, prefilled syringes, and smart injectors enable precise dosing, better glycemic control, and improved patient adherence. The integration of connected technologies and digital health platforms further enhances real-time monitoring and personalized treatment. It reduces the number of clinical visits, making diabetes a leading segment in the DDCP market.

Drug Device Combination Products Market, By End User

The DDCP market is divided by end users into hospitals and clinics, ambulatory surgery centers, long-term care facilities, home care settings, and other end users. The home care segment is growing rapidly, driven by patients with chronic conditions like diabetes, asthma, and cancer choosing to self-administer treatments at home to save time and lower healthcare costs from frequent hospital visits. Recent innovations include user-friendly, portable, and connected devices such as autoinjectors, insulin delivery wearables, and smart inhalers that enable effective home-based treatment. Additionally, an aging population and rising healthcare demands in institutional settings have increased the need for personalized and patient-centered healthcare options. Factors like increased patient comfort, better adherence to treatment plans, and improved quality of life make home-based therapies more attractive. Consequently, home care is becoming a key and expanding part of the drug-device combination products market.

REGION

Asia Pacific to be fastest-growing region in global drug device combination products market during forecast period

The Asia Pacific drug device combination products market is projected to achieve the highest CAGR globally during the forecast period. The increasing prevalence of chronic diseases such as diabetes, cardiovascular disorders, and respiratory conditions in the region mainly drives this growth. The growing aging population also boosts demand for advanced, patient-friendly drug delivery systems. Heavy investments in healthcare infrastructure in countries such as China and India support the expansion of hospitals, clinics, and home-based care services, thereby encouraging the adoption of these products. Moreover, supportive government policies and initiatives that promote patient-centered care, self-administration, and digital health integration are aiding market growth.

Drug Device Combination Products Market: COMPANY EVALUATION MATRIX

In the drug device combination products market matrix, Abbott (Star) leads with a strong global presence, a comprehensive portfolio of drug-device combination products, and advanced technologies that improve patient adherence and treatment outcomes. This leadership encourages widespread adoption across hospitals, clinics, and home-based care settings. Terumo (Emerging Leader) is gaining momentum with innovative and cost-effective drug delivery solutions, focusing on emerging markets and expanding its role in chronic disease management.

Source: Secondary Research, Interviews with Experts, MarketsandMarkets Analysis

MARKET SCOPE

REPORT METRIC DETAILS
Market Size in 2024 (Value) USD 224.70 Billion
Market Forecast in 2030 (Value) USD 379.17 Billion
Growth Rate CAGR of 9.3% from 2025-2030
Years Considered 2023–2030
Base Year 2024
Forecast Period 2025-2030
Units Considered Value (USD Million/Billion), Volume (Thousand Units)
Report Coverage Revenue forecast, company ranking, competitive landscape, growth factors, and trends
Segments Covered
  • By Product Type:
    • Injectable drug delivery devices
    • drug-eluting stents
    • inhalers
    • infusion pumps
    • transdermal patches
    • drug-coated balloon catheters
    • other product types
  • By Application:
    • Diabetes management
    • respiratory diseases
    • ophthalmology
    • autoimmune diseases
    • oncology
    • infectious diseases
    • cardiovascular diseases
    • obesity management
    • pain management
    • other applications
  • By End User:
    • Hospitals & clinics
    • ambulatory surgery centers
    • long-term care facilities
    • home care settings
    • other end users
Regions Covered North America, Asia Pacific, Europe, Latin America, and Middle East & Africa

WHAT IS IN IT FOR YOU: Drug Device Combination Products Market REPORT CONTENT GUIDE

DELIVERED CUSTOMIZATIONS

We have successfully delivered the following deep-dive customizations:

CLIENT REQUEST CUSTOMIZATION DELIVERED VALUE ADDS
Product Analysis In-depth assessment of drug device combination products (e.g., injectables, inhalers, transdermal patches, auto-injectors, prefilled syringes, etc.) Trends in connected drug delivery, patient-centric designs, and digital health integration
Company Information Comprehensive profiles of major players such as: Medtronic, Abbott, BD, Novartis Identification of strategic partnerships, M&A activities, and licensing opportunities
Geographic Analysis
  • Country-level demand mapping with focus on APAC (China, India, Japan, ASEAN countries), Europe, North America, and other key emerging markets
  • evaluation of regional regulatory frameworks, reimbursement policies, and clinical adoption trends
Regional market outlook with detailed growth opportunities, regulatory updates, adoption trends, and competitive positioning across major countries and healthcare settings

RECENT DEVELOPMENTS

  • March 2025 : Terumo Europe received MDR approval for an expanded indication of its Ultimaster Nagomi and Ultimaster Tansei sirolimus-eluting coronary stent systems.? This new approval covers patients at high bleeding risk, including those eligible for dual antiplatelet therapy (DAPT) for as short as one month.
  •   January 2025 : Eli Lilly and Company received approval from the US Food and Drug Administration (FDA) for Omvoh (mirikizumab-mrkz) for the treatment of moderately to severely active Crohn's disease in adults.
  • July 2024 : AbbVie received European Commission approval for SKYRIZI (risankizumab) for the treatment of adult patients with moderately to severely active ulcerative colitis (UC)
  • May 2024 : Abbott launched the XIENCE Sierra Everolimus-Eluting Coronary Stent System in India. As the latest in the XIENCE family, it offers advanced safety and effectiveness for treating blocked coronary arteries, particularly in complex cases.


Table of Contents

Exclusive indicates content/data unique to MarketsandMarkets and not available with any competitors.

TITLE
PAGE NO
1
INTRODUCTION


29
2
RESEARCH METHODOLOGY


33
3
EXECUTIVE SUMMARY


46
4
PREMIUM INSIGHTS


51
5
MARKET OVERVIEW
Emerging biologics and smart drug delivery tech redefine patient-centric, minimally invasive healthcare markets.


54
 
5.1
INTRODUCTION


5.2
MARKET DYNAMICS


5.2.1
DRIVERS


5.2.1.1
RISING PREVALENCE OF CHRONIC DISEASES


5.2.1.2
GROWING ADOPTION OF BIOLOGICS AND VACCINES


5.2.1.3
HIGH R&D INVESTMENTS FROM GOVERNMENT ORGANIZATIONS AND PRIVATE BODIES


5.2.1.4
SHIFT TOWARD PERSONALIZED MEDICINES AND PATIENT-CENTRIC CARE


5.2.1.5
RISING POPULARITY OF SELF-ADMINISTERED MEDICINES


5.2.2
RESTRAINTS


5.2.2.1
STRINGENT REGULATORY POLICIES AND COMPLIANCE HURDLES


5.2.2.2
FOCUS ON ALTERNATIVE DRUG DELIVERY METHODS


5.2.3
OPPORTUNITIES


5.2.3.1
INCREASED PREFERENCE FOR MINIMALLY INVASIVE PRODUCTS


5.2.3.2
HIGH GROWTH POTENTIAL IN EMERGING ECONOMIES


5.2.3.3
GROWING ADOPTION OF DRUG DEVICE COMBINATION PRODUCTS AND EXPANDING BIOLOGICS MARKET


5.2.4
CHALLENGES


5.2.4.1
HEAVY FINANCIAL IMPACT OF DRUG WASTAGE AND DEVICE MALFUNCTION


5.2.4.2
LACK OF STANDARDIZED REIMBURSEMENT POLICIES


5.2.4.3
LIMITED TRAINING AND EDUCATION FOR HEALTHCARE PROFESSIONALS


5.2.4.4
LACK OF MEDICAL SPECIALISTS AND SURGEONS
 
 
5.3
INDUSTRY TRENDS


5.3.1
RISING POPULARITY OF SELF-ADMINISTERED MEDICINES AND HOME CARE SETTINGS


5.3.2
INTEGRATION OF DRUG DEVICE COMBINATION PRODUCTS WITH SMART CONNECTED DEVICES


5.4
TECHNOLOGY ANALYSIS


5.4.1
KEY TECHNOLOGIES


5.4.1.1
WEARABLE TECHNOLOGIES


5.4.1.2
DRUG-ELUTING TECHNOLOGIES


5.4.2
COMPLEMENTARY TECHNOLOGIES


5.4.2.1
CONNECTED HEALTH AND DIGITAL TECHNOLOGIES


5.4.3
ADJACENT TECHNOLOGIES


5.4.3.1
ADVANCED MATERIALS AND BIOPOLYMERS
 
 
5.5
PORTER’S FIVE FORCES ANALYSIS


5.5.1
THREAT OF NEW ENTRANTS


5.5.2
THREAT OF SUBSTITUTES


5.5.3
BARGAINING POWER OF SUPPLIERS


5.5.4
BARGAINING POWER OF BUYERS


5.5.5
INTENSITY OF COMPETITIVE RIVALRY


5.6
KEY STAKEHOLDERS & BUYING CRITERIA


5.6.1
KEY STAKEHOLDERS IN BUYING PROCESS


5.6.2
KEY BUYING CRITERIA


5.7
REGULATORY ANALYSIS


5.7.1
REGULATORY BODIES, GOVERNMENT AGENCIES, AND OTHER ORGANIZATIONS


5.7.2
REGULATORY FRAMEWORK


5.7.2.1
NORTH AMERICA


5.7.2.2
EUROPE


5.7.2.3
ASIA PACIFIC


5.7.2.4
LATIN AMERICA


5.7.2.5
MIDDLE EAST & AFRICA
 
 
5.8
PATENT ANALYSIS


5.8.1
KEY PATENTS GRANTED


5.9
TRADE ANALYSIS


5.9.1
TRADE ANALYSIS FOR PREFILLED SYRINGES (HS CODE 300431), 2019–2023


5.9.1.1
IMPORT DATA FOR HS CODE 300431


5.9.1.2
EXPORT DATA FOR HS CODE 300431


5.9.2
TRADE DATA FOR TRANSDERMAL PATCHES (HS CODE 300431), 2019–2023


5.9.2.1
IMPORT DATA FOR HS CODE 300431


5.9.2.2
EXPORT DATA FOR HS CODE 300431
 
 
5.10
PRICING ANALYSIS


5.10.1
INDICATIVE PRICING OF DRUG DEVICE COMBINATION PRODUCTS, BY KEY PLAYER, 2024


5.10.2
AVERAGE SELLING PRICE TREND OF INJECTABLE DRUG DELIVERY DEVICES, BY KEY PLAYER, 2022–2024


5.10.3
AVERAGE SELLING PRICE TREND OF DRUG DELIVERY COMBINATION PRODUCTS, BY REGION, 2022–2024


5.10.3.1
AVERAGE SELLING PRICE TREND FOR PEN INJECTORS, 2022–2024


5.10.3.2
AVERAGE SELLING PRICE TREND FOR INHALERS, 2022–2024


5.10.3.3
AVERAGE SELLING PRICE TREND FOR DRUG-ELUTING STENTS, 2022–2024
 
 
5.11
VALUE CHAIN ANALYSIS


5.12
KEY CONFERENCES & EVENTS, 2025–2026


5.13
UNMET NEEDS/END-USER EXPECTATIONS


5.14
ADJACENT MARKET ANALYSIS


5.15
ECOSYSTEM ANALYSIS


5.15.1
ROLE IN ECOSYSTEM


5.16
CASE STUDY ANALYSIS


5.16.1
MINIMED 780G DIABETES MANAGEMENT SYSTEM TO COMBINE CONTINUOUS GLUCOSE MONITORING WITH AUTOMATED INSULIN DELIVERY


5.16.2
DIGIINHALER-SMART INHALER FOR ASTHMA/COPD TO TRACK LUNG FUNCTION


5.16.3
ADOPTION OF PEN INJECTORS BY NEMERA FRANCE TO IMPROVE THERAPEUTIC OUTCOMES


5.17
SUPPLY CHAIN ANALYSIS


5.18
TRENDS/DISRUPTIONS IMPACTING CUSTOMERS’ BUSINESSES


5.19
INVESTMENT & FUNDING SCENARIO


5.20
REIMBURSEMENT SCENARIO ANALYSIS


5.21
CLINICAL PIPELINE ANALYSIS


5.22
IMPACT OF AI/GEN AI ON DRUG DEVICE COMBINATION PRODUCTS MARKET


5.23
IMPACT OF 2025 US TARIFF ON DRUG DEVICE COMBINATION PRODUCTS MARKET


5.23.1
KEY TARIFF RATES


5.23.2
PRICE IMPACT ANALYSIS


5.23.3
IMPACT ON COUNTRY/REGION


5.23.3.1
NORTH AMERICA


5.23.3.2
EUROPE


5.23.3.3
ASIA PACIFIC


5.23.4
IMPACT ON END-USE INDUSTRIES


5.23.4.1
HOSPITALS & CLINICS


5.23.4.2
AMBULATORY SURGERY CENTERS


5.23.4.3
LONG-TERM CARE FACILITIES


5.23.4.4
HOME CARE SETTINGS
 
6
DRUG DEVICE COMBINATION PRODUCTS MARKET, BY PRODUCT TYPE
Market Size & Growth Rate Forecast Analysis to 2030 in USD Billion | 25 Data Tables


108
 
6.1
INTRODUCTION


6.2
INJECTABLE DRUG DELIVERY DEVICES


6.2.1
PREFILLED SYRINGES


6.2.1.1
NEED TO ELIMINATE DOSING MISTAKES AND IMPROVE PATIENT COMPLIANCE TO DRIVE SEGMENT


6.2.2
PEN INJECTORS


6.2.2.1
EASE OF SELF-ADMINISTRATION AND IMPROVED DOSAGE ACCURACY TO FUEL ADOPTION


6.2.3
AUTOINJECTORS


6.2.3.1
EASE OF USE AND BETTER PATIENT EXPERIENCE TO AID ADOPTION IN EMERGENCY MEDICAL CONDITIONS


6.2.4
WEARABLE INJECTORS


6.2.4.1
RISING POPULARITY OF EMBEDDED WIRELESS DEVICES TO PROPEL MARKET GROWTH


6.2.5
NEEDLE-FREE INJECTORS


6.2.5.1
REDUCED RISK OF NEEDLESTICK INJURY TO FUEL MARKET ADOPTION
 
 
6.3
DRUG-ELUTING STENTS


6.3.1
LOW RATE OF RESTENOSIS TO PROPEL MARKET GROWTH


6.4
INHALERS


6.4.1
INCREASING PREVALENCE OF RESPIRATORY DISEASES TO FUEL UPTAKE


6.5
INFUSION PUMPS


6.5.1
RISING NUMBER OF SURGICAL PROCEDURES TO FUEL DEMAND FOR AMBULATORY INFUSION PUMPS


6.6
TRANSDERMAL PATCHES


6.6.1
RISING INCIDENCE OF CHRONIC DISEASES REQUIRING LONG-TERM MEDICATION TO AID MARKET GROWTH


6.7
DRUG-COATED BALLOONS


6.7.1
ABILITY TO DELIVER LOCALIZED DRUG THERAPY WITH MINIMAL SYSTEMIC EXPOSURE TO DRIVE MARKET


6.8
OTHER PRODUCT TYPES


7
DRUG DEVICE COMBINATION PRODUCTS MARKET, BY APPLICATION
Market Size & Growth Rate Forecast Analysis to 2030 in USD Billion | 14 Data Tables


133
 
7.1
INTRODUCTION


7.2
DIABETES MANAGEMENT


7.2.1
HIGH GERIATRIC POPULATION AND INCREASED SEDENTARY LIFESTYLE TO PROPEL MARKET GROWTH


7.3
RESPIRATORY DISEASES


7.3.1
RISE IN URBANIZATION, AIR POLLUTION, AND SMOKING TO FUEL RESPIRATORY AILMENTS


7.4
OPTHALMOLOGY


7.4.1
RISE OF DIABETIC EYE DISEASES AND FAVORABLE REGULATORY SCENARIO TO AUGMENT MARKET GROWTH


7.5
AUTOIMMUNE DISEASES


7.5.1
NEED FOR PROLONGED TREATMENT IN CHRONIC PATIENTS TO SPUR MARKET GROWTH


7.6
ONCOLOGY


7.6.1
DRUG DEVICE COMBINATION PRODUCTS TO AID THERAPEUTIC PRECISION AND OPTIMIZE PATIENT OUTCOMES DURING CANCER TREATMENT


7.7
INFECTIOUS DISEASES


7.7.1
IRREGULARIZED URBANIZATION AND POOR SANITATION IN EMERGING ECONOMIES TO PROPEL MARKET GROWTH


7.8
CARDIOVASCULAR DISEASES


7.8.1
INCREASE IN SEDENTARY LIFESTYLE AND CHANGES IN EATING HABITS TO FUEL MARKET GROWTH


7.9
OBESITY MANAGEMENT


7.9.1
INCREASING PREVALENCE OF OBESITY TO SUPPORT MARKET GROWTH


7.10
PAIN MANAGEMENT


7.10.1
BETTER PATIENT ADHERENCE AND MINIMAL SIDE EFFECTS TO DRIVE ADOPTION OF TRANSDERMAL PATCHES


7.11
OTHER APPLICATIONS


8
DRUG DEVICE COMBINATION PRODUCTS MARKET, BY END USER
Market Size & Growth Rate Forecast Analysis to 2030 in USD Billion | 6 Data Tables


152
 
8.1
INTRODUCTION


8.2
HOSPITALS & CLINICS


8.2.1
ACCESS TO MULTI-DISCIPLINARY EXPERTISE AND PROCEDURE-BASED CARE TO AID MARKET GROWTH


8.3
AMBULATORY SURGERY CENTERS


8.3.1
NEED FOR COST-EFFECTIVE AND HIGH-QUALITY MINIMALLY INVASIVE TREATMENT TO SUPPORT MARKET GROWTH


8.4
LONG-TERM CARE FACILITIES


8.4.1
INCREASING INCIDENCE OF CHRONIC DISEASES AMONG ELDERLY AND DISABLED POPULATION TO DRIVE MARKET


8.5
HOME CARE SETTINGS


8.5.1
INCREASING DEMAND FOR PATIENT-CENTRIC AND COST-EFFECTIVE HEALTHCARE TO PROPEL MARKET GROWTH


8.6
OTHER END USERS


9
DRUG DEVICE COMBINATION PRODUCTS MARKET, BY REGION
Comprehensive coverage of 8 Regions with country-level deep-dive of 16 Countries | 131 Data Tables.


163
 
9.1
INTRODUCTION


9.2
NORTH AMERICA


9.2.1
MACROECONOMIC OUTLOOK FOR NORTH AMERICA


9.2.2
US


9.2.2.1
US TO DOMINATE NORTH AMERICAN DRUG DEVICE COMBINATION PRODUCTS MARKET DURING FORECAST PERIOD


9.2.3
CANADA


9.2.3.1
REGULATORY MODERNIZATION AND STRATEGIC GOVERNMENT INVESTMENTS TO AUGMENT MARKET GROWTH
 
 
9.3
EUROPE


9.3.1
MACROECONOMIC OUTLOOK FOR EUROPE


9.3.2
GERMANY


9.3.2.1
TECHNOLOGICAL ADVANCEMENTS AND STRONG R&D INFRASTRUCTURE TO PROPEL MARKET GROWTH


9.3.3
UK


9.3.3.1
STRONG EMPHASIS ON PERSONALIZED AND VALUE-BASED HEALTHCARE TO AID MARKET GROWTH


9.3.4
FRANCE


9.3.4.1
STRONG HEALTHCARE INFRASTRUCTURE AND HIGH INVESTMENTS IN BIOPHARMACEUTICAL INNOVATION TO BOOST MARKET GROWTH


9.3.5
ITALY


9.3.5.1
FOCUS ON PHARMACEUTICAL-MEDITECH CONVERGENCE AND HEALTHCARE MODERNIZATION TO DRIVE MARKET


9.3.6
SPAIN


9.3.6.1
INCREASING GERIATRIC POPULATION AND GROWING FOCUS ON HOME-BASED TREATMENT TO PROPEL MARKET GROWTH


9.3.7
REST OF EUROPE


9.4
ASIA PACIFIC


9.4.1
MACROECONOMIC OUTLOOK FOR ASIA PACIFIC


9.4.2
CHINA


9.4.2.1
FAVORABLE GOVERNMENT POLICIES AND INCREASED HEALTHCARE SPENDING TO SUPPORT MARKET GROWTH


9.4.3
JAPAN


9.4.3.1
ADVANCED HEALTHCARE SYSTEMS AND UNIVERSAL REIMBURSEMENT POLICIES TO SPUR MARKET GROWTH


9.4.4
INDIA


9.4.4.1
GROWING FOCUS ON DIGITAL HEALTH INTEGRATION AND BOOMING BIOSIMILARS SECTOR TO DRIVE MARKET


9.4.5
SOUTH KOREA


9.4.5.1
ROBUST R&D INFRASTRUCTURE AND ENHANCED FOCUS ON GOVERNMENT-INDUSTRY COLLABORATIONS TO AID MARKET GROWTH


9.4.6
AUSTRALIA


9.4.6.1
RISING HEALTHCARE INVESTMENTS BY GOVERNMENT AND PRIVATE ORGANIZATIONS TO BOOST MARKET GROWTH


9.4.7
REST OF ASIA PACIFIC


9.5
LATIN AMERICA


9.5.1
MACROECONOMIC OUTLOOK FOR LATIN AMERICA


9.5.2
BRAZIL


9.5.2.1
PRESENCE OF UNIVERSAL HEALTHCARE SYSTEM AND HIGH GERIATRIC POPULATION TO DRIVE MARKET


9.5.3
MEXICO


9.5.3.1
FOCUS ON NEARSHORING AND IMPROVEMENT IN HEALTHCARE SECTOR TO DRIVE MARKET


9.5.4
REST OF LATIN AMERICA


9.6
MIDDLE EAST & AFRICA


9.6.1
MACROECONOMIC OUTLOOK FOR MIDDLE EAST & AFRICA


9.6.2
GCC COUNTRIES


9.6.2.1
KINGDOM OF SAUDI ARABIA


9.6.2.2
UAE


9.6.2.3
REST OF GCC COUNTRIES


9.6.3
REST OF MIDDLE EAST & AFRICA
 
 
10
COMPETITIVE LANDSCAPE
Discover market leaders' winning strategies and emerging competitors in drug device combination products.


242
 
10.1
INTRODUCTION


10.2
KEY PLAYER STRATEGIES/RIGHT TO WIN


10.2.1
OVERVIEW OF STRATEGIES ADOPTED BY KEY PLAYERS IN DRUG DEVICE COMBINATION PRODUCTS MARKET


10.3
REVENUE ANALYSIS, 2020–2024


10.4
MARKET SHARE ANALYSIS, 2024


10.4.1
RANKING OF KEY MARKET PLAYERS


10.5
COMPANY EVALUATION MATRIX: KEY PLAYERS, 2024


10.5.1
STARS


10.5.2
EMERGING LEADERS


10.5.3
PERVASIVE PLAYERS


10.5.4
PARTICIPANTS


10.5.5
COMPANY FOOTPRINT: KEY PLAYERS, 2024


10.5.5.1
COMPANY FOOTPRINT


10.5.5.2
REGION FOOTPRINT


10.5.5.3
PRODUCT TYPE FOOTPRINT


10.5.5.4
APPLICATION FOOTPRINT
 
 
10.6
COMPANY EVALUATION MATRIX: STARTUPS/SMES, 2024


10.6.1
PROGRESSIVE COMPANIES


10.6.2
RESPONSIVE COMPANIES


10.6.3
DYNAMIC COMPANIES


10.6.4
STARTING BLOCKS


10.6.5
COMPETITIVE BENCHMARKING: STARTUPS/SMES, 2024


10.6.5.1
DETAILED LIST OF KEY STARTUPS/SME PLAYERS


10.6.5.2
COMPETITIVE BENCHMARKING OF KEY STARTUPS/SME PLAYERS
 
 
10.7
COMPANY VALUATION & FINANCIAL METRICS


10.7.1
FINANCIAL METRICS


10.7.2
COMPANY VALUATION


10.8
BRAND/PRODUCT COMPARISON


10.9
COMPETITIVE SCENARIO


10.9.1
PRODUCT LAUNCHES AND APPROVALS


10.9.2
DEALS


10.9.3
EXPANSIONS


10.9.4
OTHER DEVELOPMENTS
 
 
11
COMPANY PROFILES
In-depth Company Profiles of Leading Market Players with detailed Business Overview, Product and Service Portfolio, Recent Developments, and Unique Analyst Perspective (MnM View)


266
 
11.1
KEY PLAYERS


11.1.1
ABBOTT


11.1.1.1
BUSINESS OVERVIEW


11.1.1.2
PRODUCTS OFFERED


11.1.1.3
RECENT DEVELOPMENTS


11.1.1.4
MNM VIEW


11.1.2
ELI LILLY AND COMPANY


11.1.3
MEDTRONIC


11.1.4
NOVO NORDISK A/S


11.1.5
NOVARTIS AG


11.1.6
SANOFI


11.1.7
BOSTON SCIENTIFIC CORPORATION


11.1.8
BECTON, DICKINSON AND COMPANY


11.1.9
MERCK KGAA


11.1.10
ABBVIE INC.


11.1.11
TEVA PHARMACEUTICAL INDUSTRIES LTD.


11.1.12
STRYKER


11.1.13
B. BRAUN SE


11.1.14
TERUMO CORPORATION


11.2
OTHER PLAYERS


11.2.1
TANDEM DIABETES CARE, INC.


11.2.2
CEQUR SIMPLICITY


11.2.3
INTARCIA THERAPEUTICS, INC.


11.2.4
HALOZYME, INC.


11.2.5
KALEO, INC.


11.2.6
LEAD CHEMICAL CO., LTD.


11.2.7
PURDUE PHARMA L.P.


11.2.8
ALVOGEN


11.2.9
EVOLUTIS


11.2.10
MUNDIPHARMA INTERNATIONAL LIMITED


11.2.11
SPARSHA PHARMA INTERNATIONAL PVT. LTD.


11.2.12
SUPERNUS PHARMACEUTICALS, INC.


11.2.13
ALCON INC.
 
 
12
APPENDIX


335
 
12.1
DISCUSSION GUIDE


12.2
KNOWLEDGESTORE: MARKETSANDMARKETS’ SUBSCRIPTION PORTAL


12.3
CUSTOMIZATION OPTIONS


12.4
RELATED REPORTS


12.5
AUTHOR DETAILS


LIST OF TABLES


TABLE 1
DRUG DEVICE COMBINATION PRODUCTS MARKET: INCLUSIONS & EXCLUSIONS


TABLE 2
EXCHANGE RATES UTILIZED FOR CONVERSION TO USD


TABLE 3
DRUG DEVICE COMBINATION PRODUCTS MARKET: STUDY ASSUMPTIONS


TABLE 4
DRUG DEVICE COMBINATION PRODUCTS MARKET: RISK ANALYSIS


TABLE 5
DIABETES POPULATION WORLDWIDE, 2024 VS. 2050 (MILLION)


TABLE 6
DRUG DEVICE COMBINATION PRODUCTS MARKET: PORTER’S FIVE FORCES


TABLE 7
INFLUENCE OF KEY STAKEHOLDERS ON BUYING PROCESS OF DRUG DEVICE COMBINATION PRODUCTS


TABLE 8
KEY BUYING CRITERIA FOR DRUG DEVICE COMBINATION PRODUCTS


TABLE 9
NORTH AMERICA: REGULATORY BODIES, GOVERNMENT AGENCIES, AND OTHER ORGANIZATIONS


TABLE 10
EUROPE: REGULATORY BODIES, GOVERNMENT AGENCIES, AND OTHER ORGANIZATIONS


TABLE 11
ASIA PACIFIC: REGULATORY BODIES, GOVERNMENT AGENCIES, AND OTHER ORGANIZATIONS


TABLE 12
LATIN AMERICA: REGULATORY BODIES, GOVERNMENT AGENCIES, AND OTHER ORGANIZATIONS


TABLE 13
MIDDLE EAST & AFRICA: REGULATORY BODIES, GOVERNMENT AGENCIES, AND OTHER ORGANIZATIONS


TABLE 14
US: CLASSIFICATION AND APPROVAL PATHWAYS


TABLE 15
US: CLASSIFICATION OF MEDICAL EQUIPMENT


TABLE 16
US: TIME, COST, AND COMPLEXITY OF REGISTRATION PROCESS


TABLE 17
CANADA: CLASSIFICATION OF DRUG DEVICE COMBINATION PRODUCTS


TABLE 18
CANADA: RISK, TIME, COST, AND COMPLEXITY OF REGISTRATION PROCESS


TABLE 19
EUROPE: EUROPEAN REGULATORY FRAMEWORK FOR DRUG DEVICE COMBINATION PRODUCTS


TABLE 20
EUROPE: RISK, TIME, COST, AND COMPLEXITY OF REGISTRATION PROCESS


TABLE 21
CHINA: RISK, TIME, COST, AND COMPLEXITY OF REGISTRATION PROCESS


TABLE 22
JAPAN: RISK, TIME, COST, AND COMPLEXITY OF REGISTRATION PROCESS


TABLE 23
DRUG DEVICE COMBINATION PRODUCTS MARKET: KEY PATENTS GRANTED, JANUARY 2022−APRIL 2025


TABLE 24
IMPORT DATA FOR PREFILLED SYRINGES (HS CODE 300431), BY COUNTRY, 2019–2023 (USD THOUSAND)


TABLE 25
EXPORT DATA FOR PREFILLED SYRINGES (HS CODE 300431), BY COUNTRY, 2019–2023 (USD THOUSAND)


TABLE 26
IMPORTS DATA FOR TRANSDERMAL PATCHES (HS CODE 300431), BY COUNTRY, 2019–2023 (USD THOUSAND)


TABLE 27
EXPORT DATA FOR TRANSDERMAL PATCHES (HS CODE 300431), BY COUNTRY, 2019–2023 (USD THOUSAND)


TABLE 28
INDICATIVE PRICING OF DRUG DEVICE COMBINATION PRODUCTS, BY KEY PLAYER, 2024


TABLE 29
AVERAGE SELLING PRICE TREND OF INJECTABLE DRUG DEVICE DELIVERY DEVICES, BY KEY PLAYER, 2022–2024


TABLE 30
AVERAGE SELLING PRICE TREND FOR PEN INJECTORS, BY REGION, 2022–2024


TABLE 31
AVERAGE SELLING PRICE TREND FOR INHALERS, BY REGION, 2022–2024


TABLE 32
AVERAGE SELLING PRICE TREND FOR DRUG-ELUTING STENTS, BY REGION, 2022–2024


TABLE 33
DRUG DEVICE COMBINATION PRODUCTS MARKET: LIST OF KEY CONFERENCES & EVENTS, JANUARY 2025–DECEMBER 2026


TABLE 34
DRUG DEVICE COMBINATION PRODUCTS MARKET: ROLE IN ECOSYSTEM


TABLE 35
CASE STUDY 1: MINIMED 780G DIABETES MANAGEMENT SYSTEM TO COMBINE CONTINUOUS GLUCOSE MONITORING WITH AUTOMATED INSULIN DELIVERY


TABLE 36
CASE STUDY 2: DIGIINHALER-SMART INHALER FOR ASTHMA/COPD TO TRACK LUNG FUNCTION


TABLE 37
CASE STUDY 3: ADOPTION OF PEN INJECTORS BY NEMERA FRANCE TO IMPROVE THERAPEUTIC OUTCOMES


TABLE 38
DRUG DEVICE COMBINATION PRODUCTS MARKET: REIMBURSEMENT SCENARIO ANALYSIS


TABLE 39
DRUG DEVICE COMBINATION PRODUCTS MARKET: CLINICAL PIPELINE ANALYSIS (AS OF MARCH 2025)


TABLE 40
US-ADJUSTED RECIPROCAL TARIFF RATES


TABLE 41
KEY PRODUCT-RELATED TARIFF FOR DRUG DEVICE PRODUCTS


TABLE 42
DRUG DEVICE COMBINATION PRODUCTS MARKET, BY PRODUCT TYPE, 2023–2030 (USD BILLION)


TABLE 43
DRUG DEVICE COMBINATION PRODUCTS MARKET FOR INJECTABLE DRUG DELIVERY DEVICES, BY TYPE, 2023–2030 (USD BILLION)


TABLE 44
DRUG DEVICE COMBINATION PRODUCTS MARKET FOR INJECTABLE DRUG DELIVERY DEVICES, BY COUNTRY, 2023–2030 (USD BILLION)


TABLE 45
LIST OF KEY PREFILLED SYRINGES AVAILABLE IN MARKET


TABLE 46
PREFILLED SYRINGES MARKET, BY COUNTRY, 2023–2030 (USD BILLION)


TABLE 47
LAUNCH OF KEY GLP-1-RELATED INJECTABLES BY MAJOR PHARMACEUTICAL COMPANIES, 2010–2024


TABLE 48
LIST OF KEY PEN INJECTORS AVAILABLE IN MARKET


TABLE 49
PEN INJECTORS MARKET, BY COUNTRY, 2023–2030 (USD BILLION)


TABLE 50
LIST OF KEY AUTOINJECTORS AVAILABLE IN MARKET


TABLE 51
AUTOINJECTORS MARKET, BY COUNTRY 2023–2030 (USD BILLION)


TABLE 52
TOP FIVE COUNTRIES WITH HIGHEST NUMBER OF DIABETES PATIENTS (20–79 YEARS), 2021 VS. 2045 (MILLION)


TABLE 53
LIST OF KEY WEREABLE INJECTORS AVAILABLE IN MARKET


TABLE 54
WEARABLE INJECTORS MARKET, BY COUNTRY, 2023–2030 (USD BILLION)


TABLE 55
LIST OF KEY NEEDLE-FREE INJECTORS AVAILABLE IN MARKET


TABLE 56
NEEDLE-FREE INJECTORS MARKET, BY COUNTRY 2023–2030 (USD BILLION)


TABLE 57
DRUG DEVICE COMBINATION PRODUCTS MARKET FOR DRUG-ELUTING STENTS, BY COUNTRY, 2023–2030 (USD BILLION)


TABLE 58
LIST OF KEY INHALERS AVAILABLE IN MARKET


TABLE 59
DRUG DEVICE COMBINATION PRODUCTS MARKET FOR INHALERS, BY COUNTRY, 2023–2030 (USD BILLION)


TABLE 60
LIST OF KEY INFUSION PUMPS AVAILABLE IN MARKET


TABLE 61
DRUG DEVICE COMBINATION PRODUCTS MARKET FOR INFUSION PUMPS, BY COUNTRY, 2023–2030 (USD BILLION)


TABLE 62
LIST OF KEY TRANSDERMAL PATCHES AVAILABLE IN MARKET


TABLE 63
DRUG DEVICE COMBINATION PRODUCTS MARKET FOR TRANSDERMAL PATCHES, BY COUNTRY, 2023–2030 (USD BILLION)


TABLE 64
LIST OF KEY DRUG-COATED BALLOONS AVAILABLE IN MARKET


TABLE 65
DRUG DEVICE COMBINATION PRODUCTS MARKET FOR DRUG-COATED BALLOONS, BY COUNTRY, 2023–2030 (USD BILLION)


TABLE 66
DRUG DEVICE COMBINATION PRODUCTS MARKET FOR OTHER PRODUCT TYPES, BY COUNTRY, 2023–2030 (USD BILLION)


TABLE 67
DRUG DEVICE COMBINATION PRODUCTS MARKET, BY APPLICATION, 2023–2030 (USD BILLION)


TABLE 68
DRUG DEVICE COMBINATION PRODUCTS MARKET FOR DIABETES MANAGEMENT, BY COUNTRY, 2023–2030 (USD BILLION)


TABLE 69
DRUG DEVICE COMBINATION PRODUCTS MARKET FOR RESPIRATORY DISEASES, BY COUNTRY, 2023–2030 (USD BILLION)


TABLE 70
DRUG DEVICE COMBINATION PRODUCTS MARKET FOR OPHTHALMOLOGY, BY COUNTRY, 2023–2030 (USD BILLION)


TABLE 71
DRUG DEVICE COMBINATION PRODUCTS MARKET FOR AUTOIMMUNE DISEASES, BY COUNTRY, 2023–2030 (USD BILLION)


TABLE 72
DRUG DEVICE COMBINATION PRODUCTS MARKET FOR ONCOLOGY, BY COUNTRY, 2023–2030 (USD BILLION)


TABLE 73
KEY DRUG DEVICE COMBINATION PRODUCTS AVAILABLE FOR INFECTIOUS DISEASES


TABLE 74
DRUG DEVICE COMBINATION PRODUCTS MARKET FOR INFECTIOUS DISEASES, BY COUNTRY, 2023–2030 (USD BILLION)


TABLE 75
DRUG DEVICE COMBINATION PRODUCTS MARKET FOR CARDIOVASCULAR DISEASES, BY COUNTRY, 2023–2030 (USD BILLION)


TABLE 76
KEY DRUG DEVICE COMBINATION PRODUCTS AVAILABLE FOR OBESITY MANAGEMENT


TABLE 77
DRUG DEVICE COMBINATION PRODUCTS MARKET FOR OBESITY MANAGEMENT, BY COUNTRY, 2023–2030 (USD BILLION)


TABLE 78
KEY TRANSDERMAL PATCHES AVAILABLE FOR PAIN MANAGEMENT


TABLE 79
DRUG DEVICE COMBINATION PRODUCTS MARKET FOR PAIN MANAGEMENT, BY COUNTRY, 2023–2030 (USD BILLION)


TABLE 80
DRUG DEVICE COMBINATION PRODUCTS MARKET FOR OTHER APPLICATIONS, BY COUNTRY, 2023–2030 (USD BILLION)


TABLE 81
DRUG DEVICE COMBINATION PRODUCTS MARKET, BY END USER, 2023–2030 (USD BILLION)


TABLE 82
DRUG DEVICE COMBINATION PRODUCTS MARKET FOR HOSPITALS & CLINICS, BY COUNTRY, 2023–2030 (USD BILLION)


TABLE 83
DRUG DEVICE COMBINATION PRODUCTS MARKET FOR AMBULATORY SURGERY CENTERS, BY COUNTRY, 2023–2030 (USD BILLION)


TABLE 84
DRUG DEVICE COMBINATION PRODUCTS MARKET FOR LONG-TERM CARE FACILITIES, BY COUNTRY, 2023–2030 (USD BILLION)


TABLE 85
DRUG DEVICE COMBINATION PRODUCTS MARKET FOR HOME CARE SETTINGS, BY COUNTRY, 2023–2030 (USD BILLION)


TABLE 86
DRUG DEVICE COMBINATION PRODUCTS MARKET FOR OTHER END USERS, BY COUNTRY, 2023–2030 (USD BILLION)


TABLE 87
DRUG DEVICE COMBINATION PRODUCTS MARKET, BY REGION, 2023–2030 (USD BILLION)


TABLE 88
TRANSDERMAL PATCHES MARKET, BY REGION, 2023–2030 (THOUSAND UNITS)


TABLE 89
DRUG-ELUTING STENTS MARKET, BY REGION, 2023–2030 (THOUSAND UNITS)


TABLE 90
NORTH AMERICA: DRUG DEVICE COMBINATION PRODUCTS MARKET, BY COUNTRY, 2023–2030 (USD BILLION)


TABLE 91
NORTH AMERICA: DRUG DEVICE COMBINATION PRODUCTS MARKET, BY PRODUCT TYPE, 2023–2030 (USD BILLION)


TABLE 92
NORTH AMERICA: DRUG DEVICE COMBINATION PRODUCTS MARKET FOR INJECTABLE DRUG DELIVERY DEVICES, BY TYPE, 2023–2030 (USD BILLION)


TABLE 93
NORTH AMERICA: DRUG DEVICE COMBINATION PRODUCTS MARKET, BY APPLICATION, 2023–2030 (USD BILLION)


TABLE 94
NORTH AMERICA: DRUG DEVICE COMBINATION PRODUCTS MARKET, BY END USER, 2023–2030 (USD BILLION)


TABLE 95
US: KEY MACROINDICATORS


TABLE 96
US: DRUG DEVICE COMBINATION PRODUCTS MARKET, BY PRODUCT TYPE, 2023–2030 (USD BILLION)


TABLE 97
US: DRUG DEVICE COMBINATION PRODUCTS MARKET FOR INJECTABLE DRUG DELIVERY DEVICES, BY TYPE, 2023–2030 (USD BILLION)


TABLE 98
US: DRUG DEVICE COMBINATION PRODUCTS MARKET, BY APPLICATION, 2023–2030 (USD BILLION)


TABLE 99
US: DRUG DEVICE COMBINATION PRODUCTS MARKET, BY END USER, 2023–2030 (USD BILLION)


TABLE 100
CANADA: KEY MACROINDICATORS


TABLE 101
CANADA: DRUG DEVICE COMBINATION PRODUCTS MARKET, BY PRODUCT TYPE, 2023–2030 (USD BILLION)


TABLE 102
CANADA: DRUG DEVICE COMBINATION PRODUCTS MARKET FOR INJECTABLE DRUG DELIVERY DEVICES, BY TYPE, 2023–2030 (USD BILLION)


TABLE 103
CANADA: DRUG DEVICE COMBINATION PRODUCTS MARKET, BY APPLICATION, 2023–2030 (USD BILLION)


TABLE 104
CANADA: DRUG DEVICE COMBINATION PRODUCTS MARKET, BY END USER, 2023–2030 (USD BILLION)


TABLE 105
EUROPE: DRUG DEVICE COMBINATION PRODUCTS MARKET, BY COUNTRY, 2023–2030 (USD BILLION)


TABLE 106
EUROPE: DRUG DEVICE COMBINATION PRODUCTS MARKET, BY PRODUCT TYPE, 2023–2030 (USD BILLION)


TABLE 107
EUROPE: DRUG DEVICE COMBINATION PRODUCTS MARKET FOR INJECTABLE DRUG DELIVERY DEVICES, BY TYPE, 2023–2030 (USD BILLION)


TABLE 108
EUROPE: DRUG DEVICE COMBINATION PRODUCTS MARKET, BY APPLICATION, 2023–2030 (USD BILLION)


TABLE 109
EUROPE: DRUG DEVICE COMBINATION PRODUCTS MARKET, BY END USER, 2023–2030 (USD BILLION)


TABLE 110
GERMANY: KEY MACROINDICATORS


TABLE 111
GERMANY: DRUG DEVICE COMBINATION PRODUCTS MARKET, BY PRODUCT TYPE, 2023–2030 (USD BILLION)


TABLE 112
GERMANY: DRUG DEVICE COMBINATION PRODUCTS MARKET FOR INJECTABLE DRUG DELIVERY DEVICES, BY TYPE, 2023–2030 (USD BILLION)


TABLE 113
GERMANY: DRUG DEVICE COMBINATION PRODUCTS MARKET, BY APPLICATION, 2023–2030 (USD BILLION)


TABLE 114
GERMANY: DRUG DEVICE COMBINATION PRODUCTS MARKET, BY END USER, 2023–2030 (USD BILLION)


TABLE 115
UK: KEY MACROINDICATORS


TABLE 116
UK: DRUG DEVICE COMBINATION PRODUCTS MARKET, BY PRODUCT TYPE, 2023–2030 (USD BILLION)


TABLE 117
UK: DRUG DEVICE COMBINATION PRODUCTS MARKET FOR INJECTABLE DRUG DELIVERY DEVICES, BY TYPE, 2023–2030 (USD BILLION)


TABLE 118
UK: DRUG DEVICE COMBINATION PRODUCTS MARKET, BY APPLICATION, 2023–2030 (USD BILLION)


TABLE 119
UK: DRUG DEVICE COMBINATION PRODUCTS MARKET, BY END USER, 2023–2030 (USD BILLION)


TABLE 120
FRANCE: KEY MACROINDICATORS


TABLE 121
FRANCE: DRUG DEVICE COMBINATION PRODUCTS MARKET, BY PRODUCT TYPE, 2023–2030 (USD BILLION)


TABLE 122
FRANCE: DRUG DEVICE COMBINATION PRODUCTS MARKET FOR INJECTABLE DRUG DELIVERY DEVICES, BY TYPE, 2023–2030 (USD BILLION)


TABLE 123
FRANCE: DRUG DEVICE COMBINATION PRODUCTS MARKET, BY APPLICATION, 2023–2030 (USD BILLION)


TABLE 124
FRANCE: DRUG DEVICE COMBINATION PRODUCTS MARKET, BY END USER, 2023–2030 (USD BILLION)


TABLE 125
ITALY: KEY MACROINDICATORS


TABLE 126
ITALY: DRUG DEVICE COMBINATION PRODUCTS MARKET, BY PRODUCT TYPE, 2023–2030 (USD BILLION)


TABLE 127
ITALY: DRUG DEVICE COMBINATION PRODUCTS MARKET FOR INJECTABLE DRUG DELIVERY DEVICES, BY TYPE, 2023–2030 (USD BILLION)


TABLE 128
ITALY: DRUG DEVICE COMBINATION PRODUCTS MARKET, BY APPLICATION, 2023–2030 (USD BILLION)


TABLE 129
ITALY: DRUG DEVICE COMBINATION PRODUCTS MARKET, BY END USER, 2023–2030 (USD BILLION)


TABLE 130
SPAIN: KEY MACROINDICATORS


TABLE 131
SPAIN: DRUG DEVICE COMBINATION PRODUCTS MARKET, BY PRODUCT TYPE, 2023–2030 (USD BILLION)


TABLE 132
SPAIN: DRUG DEVICE COMBINATION PRODUCTS MARKET FOR INJECTABLE DRUG DELIVERY DEVICES, BY TYPE, 2023–2030 (USD BILLION)


TABLE 133
SPAIN: DRUG DEVICE COMBINATION PRODUCTS MARKET, BY APPLICATION, 2023–2030 (USD BILLION)


TABLE 134
SPAIN: DRUG DEVICE COMBINATION PRODUCTS MARKET, BY END USER, 2023–2030 (USD BILLION)


TABLE 135
REST OF EUROPE: DRUG DEVICE COMBINATION PRODUCTS MARKET, BY PRODUCT TYPE, 2023–2030 (USD BILLION)


TABLE 136
REST OF EUROPE: DRUG DEVICE COMBINATION PRODUCTS MARKET FOR INJECTABLE DRUG DELIVERY DEVICES, BY TYPE, 2023–2030 (USD BILLION)


TABLE 137
REST OF EUROPE: DRUG DEVICE COMBINATION PRODUCTS MARKET, APPLICATION, 2023–2030 (USD BILLION)


TABLE 138
REST OF EUROPE: DRUG DEVICE COMBINATION PRODUCTS MARKET, BY END USER, 2023–2030 (USD BILLION)


TABLE 139
ASIA PACIFIC: DRUG DEVICE COMBINATION PRODUCTS MARKET, BY COUNTRY, 2023–2030 (USD BILLION)


TABLE 140
ASIA PACIFIC: DRUG DEVICE COMBINATION PRODUCTS MARKET, BY PRODUCT TYPE, 2023–2030 (USD BILLION)


TABLE 141
ASIA PACIFIC: DRUG DEVICE COMBINATION PRODUCTS MARKET FOR INJECTABLE DRUG DELIVERY DEVICES, BY TYPE, 2023–2030 (USD BILLION)


TABLE 142
ASIA PACIFIC: DRUG DEVICE COMBINATION PRODUCTS MARKET, BY APPLICATION, 2023–2030 (USD BILLION)


TABLE 143
ASIA PACIFIC: DRUG DEVICE COMBINATION PRODUCTS MARKET, BY END USER, 2023–2030 (USD BILLION)


TABLE 144
CHINA: KEY MACROINDICATORS


TABLE 145
CHINA: DRUG DEVICE COMBINATION PRODUCTS MARKET, BY PRODUCT TYPE, 2023–2030 (USD BILLION)


TABLE 146
CHINA: DRUG DEVICE COMBINATION PRODUCTS MARKET FOR INJECTABLE DRUG DELIVERY DEVICES, BY TYPE, 2023–2030 (USD BILLION)


TABLE 147
CHINA: DRUG DEVICE COMBINATION PRODUCTS MARKET, BY APPLICATION, 2023–2030 (USD BILLION)


TABLE 148
CHINA: DRUG DEVICE COMBINATION PRODUCTS MARKET, BY END USER, 2023–2030 (USD BILLION)


TABLE 149
JAPAN: KEY MACROINDICATORS


TABLE 150
JAPAN: DRUG DEVICE COMBINATION PRODUCTS MARKET, BY PRODUCT TYPE, 2023–2030 (USD BILLION)


TABLE 151
JAPAN: DRUG DEVICE COMBINATION PRODUCTS MARKET FOR INJECTABLE DRUG DELIVERY DEVICES, BY TYPE, 2023–2030 (USD BILLION)


TABLE 152
JAPAN: DRUG DEVICE COMBINATION PRODUCTS MARKET, BY APPLICATION, 2023–2030 (USD BILLION)


TABLE 153
JAPAN: DRUG DEVICE COMBINATION PRODUCTS MARKET, BY END USER, 2023–2030 (USD BILLION)


TABLE 154
INDIA: KEY MACROINDICATORS


TABLE 155
INDIA: DRUG DEVICE COMBINATION PRODUCTS MARKET, BY PRODUCT TYPE, 2023–2030 (USD BILLION)


TABLE 156
INDIA: DRUG DEVICE COMBINATION PRODUCTS MARKET FOR INJECTABLE DRUG DELIVERY DEVICES, BY TYPE, 2023–2030 (USD BILLION)


TABLE 157
INDIA: DRUG DEVICE COMBINATION PRODUCTS MARKET, APPLICATION, 2023–2030 (USD BILLION)


TABLE 158
INDIA: DRUG DEVICE COMBINATION PRODUCTS MARKET, BY END USER, 2023–2030 (USD BILLION)


TABLE 159
SOUTH KOREA: KEY MACROINDICATORS


TABLE 160
SOUTH KOREA: DRUG DEVICE COMBINATION PRODUCTS MARKET, BY PRODUCT TYPE, 2023–2030 (USD BILLION)


TABLE 161
SOUTH KOREA: DRUG DEVICE COMBINATION PRODUCTS MARKET FOR INJECTABLE DRUG DELIVERY DEVICES, BY TYPE, 2023–2030 (USD BILLION)


TABLE 162
SOUTH KOREA: DRUG DEVICE COMBINATION PRODUCTS MARKET, BY APPLICATION, 2023–2030 (USD BILLION)


TABLE 163
SOUTH KOREA: DRUG DEVICE COMBINATION PRODUCTS MARKET, BY END USER, 2023–2030 (USD BILLION)


TABLE 164
AUSTRALIA: KEY MACROINDICATORS


TABLE 165
AUSTRALIA: DRUG DEVICE COMBINATION PRODUCTS MARKET, BY PRODUCT TYPE, 2023–2030 (USD BILLION)


TABLE 166
AUSTRALIA: DRUG DEVICE COMBINATION PRODUCTS MARKET FOR INJECTABLE DRUG DELIVERY DEVICES, BY TYPE, 2023–2030 (USD BILLION)


TABLE 167
AUSTRALIA: DRUG DEVICE COMBINATION PRODUCTS MARKET, BY APPLICATION, 2023–2030 (USD BILLION)


TABLE 168
AUSTRALIA: DRUG DEVICE COMBINATION PRODUCTS MARKET, BY END USER, 2023–2030 (USD BILLION)


TABLE 169
REST OF ASIA PACIFIC: DRUG DEVICE COMBINATION PRODUCTS MARKET, BY PRODUCT TYPE, 2023–2030 (USD BILLION)


TABLE 170
REST OF ASIA PACIFIC: DRUG DEVICE COMBINATION PRODUCTS MARKET FOR INJECTABLE DRUG DELIVERY DEVICES, BY TYPE, 2023–2030 (USD BILLION)


TABLE 171
REST OF ASIA PACIFIC: DRUG DEVICE COMBINATION PRODUCTS MARKET, BY APPLICATION, 2023–2030 (USD BILLION)


TABLE 172
REST OF ASIA PACIFIC: DRUG DEVICE COMBINATION PRODUCTS MARKET, BY END USER, 2023–2030 (USD BILLION)


TABLE 173
LATIN AMERICA: DRUG DEVICE COMBINATION PRODUCTS MARKET, BY COUNTRY, 2023–2030 (USD BILLION)


TABLE 174
LATIN AMERICA: DRUG DEVICE COMBINATION PRODUCTS MARKET, BY PRODUCT TYPE, 2023–2030 (USD BILLION)


TABLE 175
LATIN AMERICA: DRUG DEVICE COMBINATION PRODUCTS MARKET FOR INJECTABLE DRUG DELIVERY DEVICES, BY TYPE, 2023–2030 (USD BILLION)


TABLE 176
LATIN AMERICA: DRUG DEVICE COMBINATION PRODUCTS MARKET, BY APPLICATION, 2023–2030 (USD BILLION)


TABLE 177
LATIN AMERICA: DRUG DEVICE COMBINATION PRODUCTS MARKET, BY END USER, 2023–2030 (USD BILLION)


TABLE 178
BRAZIL: KEY MACROINDICATORS


TABLE 179
BRAZIL: DRUG DEVICE COMBINATION PRODUCTS MARKET, BY PRODUCT TYPE, 2023–2030 (USD BILLION)


TABLE 180
BRAZIL: DRUG DEVICE COMBINATION PRODUCTS MARKET FOR INJECTABLE DRUG DELIVERY DEVICES, BY TYPE, 2023–2030 (USD BILLION)


TABLE 181
BRAZIL: DRUG DEVICE COMBINATION PRODUCTS MARKET, BY APPLICATION, 2023–2030 (USD BILLION)


TABLE 182
BRAZIL: DRUG DEVICE COMBINATION PRODUCTS MARKET, BY END USER, 2023–2030 (USD BILLION)


TABLE 183
MEXICO: KEY MACROINDICATORS


TABLE 184
MEXICO: DRUG DEVICE COMBINATION PRODUCTS MARKET, BY PRODUCT TYPE, 2023–2030 (USD BILLION)


TABLE 185
MEXICO: DRUG DEVICE COMBINATION PRODUCTS MARKET FOR INJECTABLE DRUG DELIVERY DEVICES, BY TYPE, 2023–2030 (USD BILLION)


TABLE 186
MEXICO: DRUG DEVICE COMBINATION PRODUCTS MARKET, BY APPLICATION, 2023–2030 (USD BILLION)


TABLE 187
MEXICO: DRUG DEVICE COMBINATION PRODUCTS MARKET, BY END USER, 2023–2030 (USD BILLION)


TABLE 188
REST OF LATIN AMERICA: DRUG DEVICE COMBINATION PRODUCTS MARKET, BY PRODUCT TYPE, 2023–2030 (USD BILLION)


TABLE 189
REST OF LATIN AMERICA: DRUG DEVICE COMBINATION PRODUCTS MARKET FOR INJECTABLE DRUG DELIVERY DEVICES, BY TYPE, 2023–2030 (USD BILLION)


TABLE 190
REST OF LATIN AMERICA: DRUG DEVICE COMBINATION PRODUCTS MARKET, BY APPLICATION, 2023–2030 (USD BILLION)


TABLE 191
REST OF LATIN AMERICA: DRUG DEVICE COMBINATION PRODUCTS MARKET, BY END USER, 2023–2030 (USD BILLION)


TABLE 192
MIDDLE EAST & AFRICA: DRUG DEVICE COMBINATION PRODUCTS MARKET, BY REGION, 2023–2030 (USD BILLION)


TABLE 193
MIDDLE EAST & AFRICA: DRUG DEVICE COMBINATION PRODUCTS MARKET, BY PRODUCT TYPE, 2023–2030 (USD BILLION)


TABLE 194
MIDDLE EAST & AFRICA: DRUG DEVICE COMBINATION PRODUCTS MARKET FOR INJECTABLE DRUG DELIVERY DEVICES, BY TYPE, 2023–2030 (USD BILLION)


TABLE 195
MIDDLE EAST & AFRICA: DRUG DEVICE COMBINATION PRODUCTS MARKET, BY APPLICATION, 2023–2030 (USD BILLION)


TABLE 196
MIDDLE EAST & AFRICA: DRUG DEVICE COMBINATION PRODUCTS MARKET, BY END USER, 2023–2030 (USD BILLION)


TABLE 197
GCC COUNTRIES: DRUG DEVICE COMBINATION PRODUCTS MARKET, BY COUNTRY, 2023–2030 (USD BILLION)


TABLE 198
GCC COUNTRIES: DRUG DEVICE COMBINATION PRODUCTS MARKET, BY PRODUCT TYPE, 2023–2030 (USD BILLION)


TABLE 199
GCC COUNTRIES: DRUG DEVICE COMBINATION PRODUCTS MARKET FOR INJECTABLE DRUG DELIVERY DEVICES, BY TYPE, 2023–2030 (USD BILLION)


TABLE 200
GCC COUNTRIES: DRUG DEVICE COMBINATION PRODUCTS MARKET, BY APPLICATION, 2023–2030 (USD BILLION)


TABLE 201
GCC COUNTRIES: DRUG DEVICE COMBINATION PRODUCTS MARKET, BY END USER, 2023–2030 (USD BILLION)


TABLE 202
KINGDOM OF SAUDI ARABIA: DRUG DEVICE COMBINATION PRODUCTS MARKET, BY PRODUCT TYPE, 2023–2030 (USD BILLION)


TABLE 203
KINGDOM OF SAUDI ARABIA: DRUG DEVICE COMBINATION PRODUCTS MARKET FOR INJECTABLE DRUG DELIVERY DEVICES, BY TYPE, 2023–2030 (USD BILLION)


TABLE 204
KINGDOM OF SAUDI ARABIA: DRUG DEVICE COMBINATION PRODUCTS MARKET, BY APPLICATION, 2023–2030 (USD BILLION)


TABLE 205
KINGDOM OF SAUDI ARABIA: DRUG DEVICE COMBINATION PRODUCTS MARKET, BY END USER, 2023–2030 (USD BILLION)


TABLE 206
UAE: DRUG DEVICE COMBINATION PRODUCTS MARKET, BY PRODUCT TYPE, 2023–2030 (USD BILLION)


TABLE 207
UAE: DRUG DEVICE COMBINATION PRODUCTS MARKET FOR INJECTABLE DRUG DELIVERY DEVICES, BY TYPE, 2023–2030 (USD BILLION)


TABLE 208
UAE: DRUG DEVICE COMBINATION PRODUCTS MARKET, BY APPLICATION, 2023–2030 (USD BILLION)


TABLE 209
UAE: DRUG DEVICE COMBINATION PRODUCTS MARKET, BY END USER, 2023–2030 (USD BILLION)


TABLE 210
REST OF GCC COUNTRIES: DRUG DEVICE COMBINATION PRODUCTS MARKET, BY PRODUCT TYPE, 2023–2030 (USD BILLION)


TABLE 211
REST OF GCC COUNTRIES: DRUG DEVICE COMBINATION PRODUCTS MARKET FOR INJECTABLE DRUG DELIVERY DEVICES, BY TYPE, 2023–2030 (USD BILLION)


TABLE 212
REST OF GCC COUNTRIES: DRUG DEVICE COMBINATION PRODUCTS MARKET, BY APPLICATION, 2023–2030 (USD BILLION)


TABLE 213
REST OF GCC COUNTRIES: DRUG DEVICE COMBINATION PRODUCTS MARKET, BY END USER, 2023–2030 (USD BILLION)


TABLE 214
REST OF MIDDLE EAST & AFRICA: DRUG DEVICE COMBINATION PRODUCTS MARKET, BY PRODUCT TYPE, 2023–2030 (USD BILLION)


TABLE 215
REST OF MIDDLE EAST & AFRICA: DRUG DEVICE COMBINATION PRODUCTS MARKET FOR INJECTABLE DRUG DELIVERY DEVICES, BY TYPE, 2023–2030 (USD BILLION)


TABLE 216
REST OF MIDDLE EAST & AFRICA: DRUG DEVICE COMBINATION PRODUCTS MARKET, BY APPLICATION, 2023–2030 (USD BILLION)


TABLE 217
REST OF MIDDLE EAST & AFRICA: DRUG DEVICE COMBINATION PRODUCTS MARKET, BY END USER, 2023–2030 (USD BILLION)


TABLE 218
OVERVIEW OF STRATEGIES DEPLOYED BY KEY PLAYERS IN DRUG DEVICE COMBINATION PRODUCTS MARKET


TABLE 219
DRUG DEVICE COMBINATION PRODUCTS MARKET FOR AUTOINJECTORS: DEGREE OF COMPETITION


TABLE 220
DRUG DEVICE COMBINATION PRODUCTS MARKET FOR PEN INJECTORS: DEGREE OF COMPETITION


TABLE 221
DRUG DEVICE COMBINATION PRODUCTS MARKET FOR TRANSDERMAL PATCHES: DEGREE OF COMPETITION


TABLE 222
DRUG DEVICE COMBINATION PRODUCTS MARKET: REGION FOOTPRINT


TABLE 223
DRUG DEVICE COMBINATION PRODUCTS MARKET: PRODUCT TYPE FOOTPRINT


TABLE 224
DRUG DEVICE COMBINATION PRODUCTS MARKET: APPLICATION FOOTPRINT


TABLE 225
DRUG DEVICE COMBINATION PRODUCTS MARKET: DETAILED LIST OF KEY STARTUPS/SME PLAYERS


TABLE 226
DRUG DEVICE COMBINATION PRODUCTS MARKET: COMPETITIVE BENCHMARKING OF KEY STARTUPS/SME PLAYERS


TABLE 227
DRUG DEVICE COMBINATION PRODUCTS MARKET: PRODUCT LAUNCHES AND APPROVALS, JANUARY 2022–MARCH 2025


TABLE 228
DRUG DEVICE COMBINATION PRODUCTS MARKET: DEALS, JANUARY 2022–MARCH 2025


TABLE 229
DRUG DEVICE COMBINATION PRODUCTS MARKET: EXPANSIONS, JANUARY 2022–MARCH 2025


TABLE 230
DRUG DEVICE COMBINATION PRODUCTS MARKET: OTHER DEVELOPMENTS, JANUARY 2022–MARCH 2025


TABLE 231
ABBOTT: COMPANY OVERVIEW


TABLE 232
ABBOTT: PRODUCTS OFFERED


TABLE 233
ABBOTT: PRODUCT LAUNCHES AND APPROVALS, JANUARY 2022–MARCH 2025


TABLE 234
ABBOTT: DEALS, JANUARY 2022–MARCH 2025


TABLE 235
ELI LILLY AND COMPANY: COMPANY OVERVIEW


TABLE 236
ELI LILLY AND COMPANY: PRODUCTS OFFERED


TABLE 237
ELI LILLY AND COMPANY: PRODUCT APPROVALS, JANUARY 2022–MARCH 2025


TABLE 238
ELI LILLY AND COMPANY: DEALS, JANUARY 2022–MARCH 2025


TABLE 239
ELI LILLY AND COMPANY: EXPANSIONS, JANUARY 2022–MARCH 2025


TABLE 240
ELI LILLY AND COMPANY: OTHER DEVELOPMENTS, JANUARY 2022–MARCH 2025


TABLE 241
MEDTRONIC: COMPANY OVERVIEW


TABLE 242
MEDTRONIC: PRODUCTS OFFERED


TABLE 243
MEDTRONIC: PRODUCT LAUNCHES AND APPROVALS, JANUARY 2022–MARCH 2025


TABLE 244
MEDTRONIC: DEALS, JANUARY 2022–MARCH 2025


TABLE 245
NOVO NORDISK A/S: COMPANY OVERVIEW


TABLE 246
NOVO NORDISK A/S: PRODUCTS OFFERED


TABLE 247
NOVO NORDISK A/S: PRODUCT LAUNCHES AND APPROVALS, JANUARY 2022–MARCH 2025


TABLE 248
NOVO NORDISK A/S: DEALS, JANUARY 2022–MARCH 2025


TABLE 249
NOVO NORDISK A/S: EXPANSIONS, JANUARY 2022–MARCH 2025


TABLE 250
NOVARTIS AG: COMPANY OVERVIEW


TABLE 251
NOVARTIS AG: PRODUCTS OFFERED


TABLE 252
NOVARTIS AG: PRODUCT APPROVALS, JANUARY 2022–MARCH 2025


TABLE 253
NOVARTIS AG: DEALS, JANUARY 2022–MARCH 2025


TABLE 254
NOVARTIS AG: EXPANSIONS, JANUARY 2022–MARCH 2025


TABLE 255
SANOFI: COMPANY OVERVIEW


TABLE 256
SANOFI: PRODUCTS OFFERED


TABLE 257
SANOFI: PRODUCT APPROVALS, JANUARY 2022–MARCH 2025


TABLE 258
SANOFI: DEALS, JANUARY 2022–MARCH 2025


TABLE 259
SANOFI: OTHER DEVELOPMENTS, JANUARY 2022–MARCH 2025


TABLE 260
BOSTON SCIENTIFIC CORPORATION: COMPANY OVERVIEW


TABLE 261
BOSTON SCIENTIFIC CORPORATION: PRODUCTS OFFERED


TABLE 262
BOSTON SCIENTIFIC CORPORATION: PRODUCT APPROVALS, JANUARY 2022–MARCH 2025


TABLE 263
BOSTON SCIENTIFIC CORPORATION: DEALS, JANUARY 2022–MARCH 2025


TABLE 264
BECTON, DICKINSON AND COMPANY: COMPANY OVERVIEW


TABLE 265
BECTON, DICKINSON AND COMPANY: PRODUCTS OFFERED


TABLE 266
BECTON, DICKINSON AND COMPANY: DEALS, JANUARY 2022–MARCH 2025


TABLE 267
BECTON, DICKINSON AND COMPANY: OTHER DEVELOPMENTS, JANUARY 2022–MARCH 2025


TABLE 268
MERCK KGAA: COMPANY OVERVIEW


TABLE 269
MERCK KGAA: PRODUCTS OFFERED


TABLE 270
MERCK KGGA: DEALS, JANUARY 2022–MARCH 2025


TABLE 271
ABBVIE INC.: COMPANY OVERVIEW


TABLE 272
ABBVIE INC.: PRODUCTS OFFERED


TABLE 273
ABBVIE INC: PRODUCT APPROVALS, JANUARY 2022–MARCH 2025


TABLE 274
ABBVIE INC.: DEALS, JANUARY 2022–MARCH 2025


TABLE 275
ABBVIE INC.: EXPANSIONS, JANUARY 2022–MARCH 2025


TABLE 276
TEVA PHARMACEUTICAL INDUSTRIES LTD.: COMPANY OVERVIEW


TABLE 277
TEVA PHARMACEUTICAL INDUSTRIES LTD.: PRODUCTS OFFERED


TABLE 278
TEVA PHARMACEUTICAL INDUSTRIES LTD.: PRODUCT APPROVALS, JANUARY 2022–MARCH 2025


TABLE 279
TEVA PHARMACEUTICAL INDUSTRIES LTD.: OTHER DEVELOPMENTS, JANUARY 2022–MARCH 2025


TABLE 280
STRYKER: COMPANY OVERVIEW


TABLE 281
STRYKER: PRODUCTS OFFERED


TABLE 282
B. BRAUN SE: COMPANY OVERVIEW


TABLE 283
B. BRAUN SE: PRODUCTS OFFERED


TABLE 284
TERUMO CORPORATION: COMPANY OVERVIEW


TABLE 285
TERUMO CORPORATION: PRODUCTS OFFERED


TABLE 286
TERUMO CORPORATION: PRODUCT LAUNCHES AND APPROVALS, JANUARY 2022–MARCH 2025


TABLE 287
TANDEM DIABETES CARE, INC.: COMPANY OVERVIEW


TABLE 288
CEQUR SIMPLICITY: COMPANY OVERVIEW


TABLE 289
INTARCIA THERAPEUTICS, INC.: COMPANY OVERVIEW


TABLE 290
HALOZYME, INC.: COMPANY OVERVIEW


TABLE 291
KALEO, INC.: COMPANY OVERVIEW


TABLE 292
LEAD CHEMICAL CO., LTD.: COMPANY OVERVIEW


TABLE 293
PURDUE PHARMA L.P.: COMPANY OVERVIEW


TABLE 294
ALVOGEN: COMPANY OVERVIEW


TABLE 295
EVOLUTIS: COMPANY OVERVIEW


TABLE 296
MUNDIPHARMA INTERNATIONAL LIMITED: COMPANY OVERVIEW


TABLE 297
SPARSHA PHARMA INTERNATIONAL PVT. LTD.: COMPANY OVERVIEW


TABLE 298
SUPERNUS PHARMACEUTICALS, INC.: COMPANY OVERVIEW


TABLE 299
ALCON INC.: COMPANY OVERVIEW


LIST OF FIGURES


FIGURE 1
DRUG DEVICE COMBINATION PRODUCTS MARKET: SEGMENTS CONSIDERED & GEOGRAPHICAL SCOPE


FIGURE 2
DRUG DEVICE COMBINATION PRODUCTS MARKET: YEARS CONSIDERED


FIGURE 3
DRUG DEVICE COMBINATION PRODUCTS MARKET: RESEARCH DESIGN


FIGURE 4
DRUG DEVICE COMBINATION PRODUCTS MARKET: KEY DATA FROM SECONDARY SOURCES


FIGURE 5
DRUG DEVICE COMBINATION PRODUCTS MARKET: KEY PRIMARY SOURCES


FIGURE 6
DRUG DEVICE COMBINATION PRODUCTS MARKET: INSIGHTS FROM PRIMARIES


FIGURE 7
DRUG DEVICE COMBINATION PRODUCTS MARKET: BREAKDOWN OF PRIMARIES (BY COMPANY TYPE, DESIGNATION, AND REGION)


FIGURE 8
DRUG DEVICE COMBINATION PRODUCTS MARKET: BREAKDOWN OF PRIMARY INTERVIEWS (SUPPLY- AND DEMAND-SIDE PARTICIPANTS)


FIGURE 9
DRUG DEVICE COMBINATION PRODUCTS MARKET SIZE ESTIMATION: SUPPLY-SIDE ANALYSIS (2024)


FIGURE 10
PEN INJECTORS MARKET SIZE ESTIMATION: REVENUE SHARE ANALYSIS (BOTTOM-UP APPROACH)


FIGURE 11
AUTOINJECTORS MARKET SIZE ESTIMATION: REVENUE SHARE ANALYSIS (BOTTOM-UP APPROACH)


FIGURE 12
DRUG DEVICE COMBINATION PRODUCTS MARKET: TOP-DOWN APPROACH


FIGURE 13
DRUG DEVICE COMBINATION PRODUCTS MARKET: CAGR PROJECTIONS (SUPPLY SIDE)


FIGURE 14
DRUG DEVICE COMBINATION PRODUCTS MARKET: DATA TRIANGULATION


FIGURE 15
DRUG DEVICE COMBINATION PRODUCTS MARKET, BY PRODUCT TYPE, 2025 VS. 2030 (USD BILLION)


FIGURE 16
DRUG DEVICE COMBINATION PRODUCTS MARKET FOR INJECTABLE DRUG DELIVERY DEVICES, BY TYPE, 2025 VS. 2030 (USD BILLION)


FIGURE 17
DRUG DEVICE COMBINATION PRODUCTS MARKET, BY APPLICATION, 2025 VS. 2030 (USD BILLION)


FIGURE 18
DRUG DEVICE COMBINATION PRODUCTS MARKET, BY END USER, 2025 VS. 2030 (USD BILLION)


FIGURE 19
REGIONAL SNAPSHOT OF DRUG DEVICE COMBINATION PRODUCTS MARKET


FIGURE 20
INCREASING NUMBER OF REGULATORY APPROVALS AND RISING INCIDENCE OF CHRONIC DISEASES TO DRIVE MARKET


FIGURE 21
CHINA AND DIABETES MANAGEMENT SEGMENT COMMANDED LARGEST MARKET SHARE IN 2024


FIGURE 22
CHINA TO REGISTER HIGHEST CAGR FROM 2025 TO 2030


FIGURE 23
DRUG DEVICE COMBINATION PRODUCTS MARKET: DRIVERS, RESTRAINTS, OPPORTUNITIES, AND CHALLENGES


FIGURE 24
DISABILITY-ADJUSTED LIFE YEARS FOR INDIVIDUALS WITH CHRONIC OBSTRUCTIVE PULMONARY DISEASE (COPD) IN AUSTRALIA, BY AGE (2023)


FIGURE 25
SHARE OF GLOBAL GERIATRIC POPULATION (ABOVE 60 YEARS), BY REGION, 2010 VS. 2015 VS. 2030 (PROJECTED)


FIGURE 26
DRUG DEVICE COMBINATION PRODUCTS MARKET: PORTER’S FIVE FORCES ANALYSIS


FIGURE 27
INFLUENCE OF KEY STAKEHOLDERS ON BUYING PROCESS OF DRUG DEVICE COMBINATION PRODUCTS


FIGURE 28
KEY BUYING CRITERIA FOR DRUG DEVICE COMBINATION PRODUCTS


FIGURE 29
DRUG DEVICE COMBINATION PRODUCTS MARKET: PATENT PUBLICATION TRENDS AND TOP APPLICANT ANALYSIS (JANUARY 2014–APRIL 2025)


FIGURE 30
TOP PATENT APPLICANTS FOR DRUG DEVICE COMBINATION PRODUCTS, BY JURISDICTION (JANUARY 2014–APRIL 2025)


FIGURE 31
DRUG DEVICE COMBINATION PRODUCTS MARKET: VALUE CHAIN ANALYSIS


FIGURE 32
DRUG DEVICE COMBINATION PRODUCTS MARKET: ADJACENT MARKETS


FIGURE 33
DRUG DEVICE COMBINATION PRODUCTS MARKET: ECOSYSTEM ANALYSIS


FIGURE 34
DRUG DEVICE COMBINATION PRODUCTS MARKET: SUPPLY CHAIN ANALYSIS


FIGURE 35
DRUG DEVICE COMBINATION PRODUCTS MARKET: TRENDS/DISRUPTIONS IMPACTING CUSTOMERS’ BUSINESSES


FIGURE 36
DRUG DEVICE COMBINATION PRODUCTS MARKET: FUNDING AND NUMBER OF DEALS, 2019–2023


FIGURE 37
DRUG DEVICE COMBINATION PRODUCTS MARKET: IMPACT OF AI/GEN AI


FIGURE 38
NORTH AMERICA: DRUG DEVICE COMBINATION PRODUCTS MARKET SNAPSHOT


FIGURE 39
ASIA PACIFIC: DRUG DEVICE COMBINATION PRODUCTS MARKET SNAPSHOT


FIGURE 40
REVENUE ANALYSIS OF KEY PLAYERS IN DRUG DEVICE COMBINATION PRODUCTS MARKET (2020–2024)


FIGURE 41
MARKET SHARE ANALYSIS OF KEY PLAYERS IN AUTOINJECTORS MARKET (2024)


FIGURE 42
MARKET SHARE ANALYSIS OF KEY PLAYERS IN PEN INJECTORS MARKET (2024)


FIGURE 43
MARKET SHARE ANALYSIS OF KEY PLAYERS IN TRANSDERMAL PATCHES MARKET (2024)


FIGURE 44
RANKING OF KEY PLAYERS IN DRUG DEVICE COMBINATION PRODUCTS MARKET (2024)


FIGURE 45
DRUG DEVICE COMBINATION PRODUCTS MARKET: COMPANY EVALUATION MATRIX (KEY PLAYERS), 2024


FIGURE 46
DRUG DEVICE COMBINATION PRODUCTS MARKET: COMPANY FOOTPRINT


FIGURE 47
DRUG DEVICE COMBINATION PRODUCTS MARKET: COMPANY EVALUATION MATRIX (STARTUPS/SMES), 2024


FIGURE 48
EV/EBITDA OF KEY VENDORS


FIGURE 49
YEAR-TO-DATE (YTD) PRICE TOTAL RETURN AND 5-YEAR STOCK BETA OF KEY VENDORS


FIGURE 50
DRUG DEVICE COMBINATION PRODUCTS MARKET: BRAND/PRODUCT COMPARATIVE ANALYSIS


FIGURE 51
ABBOTT: COMPANY SNAPSHOT


FIGURE 52
ELI LILLY AND COMPANY: COMPANY SNAPSHOT


FIGURE 53
MEDTRONIC: COMPANY SNAPSHOT


FIGURE 54
NOVO NORDISK A/S: COMPANY SNAPSHOT


FIGURE 55
NOVARTIS AG: COMPANY SNAPSHOT


FIGURE 56
SANOFI: COMPANY SNAPSHOT


FIGURE 57
BOSTON SCIENTIFIC CORPORATION: COMPANY SNAPSHOT


FIGURE 58
BECTON, DICKINSON AND COMPANY: COMPANY SNAPSHOT


FIGURE 59
MERCK KGAA: COMPANY SNAPSHOT


FIGURE 60
ABBVIE INC.: COMPANY SNAPSHOT


FIGURE 61
TEVA PHARMACEUTICAL INDUSTRIES LTD.: COMPANY SNAPSHOT


FIGURE 62
STRYKER: COMPANY SNAPSHOT


FIGURE 63
B. BRAUN SE: COMPANY SNAPSHOT


FIGURE 64
TERUMO CORPORATION: COMPANY SNAPSHOT


Methodology

This study involved the extensive use of both primary and secondary sources. The research process involved the study of various factors affecting the industry to identify the segmentation types, industry trends, key players, competitive landscape, fundamental market dynamics, and key player strategies.

Secondary Research

The secondary research process involves the widespread use of secondary sources, directories, databases (such as Bloomberg Businessweek, Factiva, and D&B Hoovers), white papers, annual reports, company house documents, investor presentations, SEC filings of companies, and publications from government sources [such as National Institutes of Health (NIH), US FDA, US Census Bureau, World Health Organization (WHO), Centers for Disease Control and Prevention (CDC), European Federation of Pharmaceutical Industries and Associations (EFPIA), American Journal of Drug Delivery and Therapeutics, International Diabetes Federation (IDF), American Association of Diabetes Educators (AADE), Asian Association for the Study of Diabetes (AASD) and Parenteral Drug Association (PDA) were referred to identify and collect information for the global drug device combination products market study. It was also used to obtain important information about the key players and market classification & segmentation according to industry trends, to the bottom-most level, and key developments related to market and technology perspectives. A database of the key industry leaders was also prepared using secondary research.

Primary Research

In the primary research process, various supply and demand sources were interviewed to obtain qualitative and quantitative information for this report. The primary sources from the supply side include industry experts such as CEOs, vice presidents, marketing and sales directors, technology & innovation directors, and related key executives from various key companies and organizations in the drug device combination products market. The primary sources from the demand side include hospitals & clinics and home care settings. Primary research was conducted to validate the market segmentation, identify key players, and gather insights on key industry trends & key market dynamics.

A breakdown of the primary respondents is provided below:

Drug Device Combination Products Market

*C-levels include CEOs, CFOs, COOs, and VPs.

*Other designations include sales managers, marketing managers, business development managers, product managers, distributors, and suppliers.

Note: Companies are classified into tiers based on their total revenue. As of 2024, Tier 1 = >USD 10.00 billion, Tier 2 = USD 1.00 billion to USD 10.00 billion, and Tier 3 = < USD 1.00 billion.

Source: MarketsandMarkets Analysis

To know about the assumptions considered for the study, download the pdf brochure

Market Size Estimation

For the global market value, annual revenues were calculated based on the revenue mapping of major product manufacturers and OEMs active in the global drug device combination products market. All the major product manufacturers were identified at the global and/or country/regional level. Revenue mapping for the respective business segments/sub-segments was done for the major players (who contribute at least 70–75% of the market share at the global level). Also, the global drug device combination products market was split into various segments and sub-segments based on:

  • List of major players operating in the drug device combination products market at the regional and/or country level
  • Product mapping of various drug device combination product manufacturers at the regional and/or country level
  • Mapping of annual revenue generated by listed major players from drug device combination products (or the nearest reported business unit/product category)
  • Revenue mapping of major players to cover at least 70–75% of the global market share as of 2024
  • Extrapolation of the revenue mapping of the listed major players to derive the global market value of the respective segments/subsegments
  • Summation of the market value of all segments/subsegments to arrive at the global point-of-care  diagnostics market  

Market Size Estimation (Bottom-up approach and Top-down approach)

Drug Device Combination Products Market

Data Triangulation

After arriving at the overall size of the global drug device combination products market through the above-mentioned methodology, this market was split into several segments and subsegments. The data triangulation and market breakdown procedures were employed, wherever applicable, to complete the overall market engineering process and arrive at the exact market value data for the key segments and subsegments. The extrapolated market data was triangulated by studying various macro indicators and regional trends from both demand- and supply-side participants.

Market Definition

A combination product is defined as any amalgamation of a drug and a device, a biological product and a device, a drug and a biological product, or a triad comprising a drug, device, and biological product. This category encompasses products that consist of two or more regulated entities—such as drug/device, biologic/device, drug/biologic, or drug/device/biologic—that are integrated or formulated as a single entity through various physical, chemical, or other methodologies. Moreover, combination products may also refer to distinct components that are packaged either as a single unit or as a collaborative assembly of biological and drug compounds, device-to-device pairings, or drug and device integrations.

Stakeholders

  • Drug device combination products manufacturers and distributors
  • Healthcare institutions (hospitals, medical schools, and outpatient clinics)
  • Research institutes
  • Contract manufacturing organizations (CMOs)
  • Market research and consulting firms
  • Venture capitalists and investors
  • Market research and consulting firms
  • Government Bodies/Municipal Corporations
  • Regulatory Bodies
  • Medical Research Institutes
  • Business Research and Consulting Service Providers

Report Objectives

  • To define, measure, and describe the global drug device combination products market by product type, application, end user, and region
  • To provide detailed information about the major factors influencing market growth (drivers, restraints, challenges, and opportunities)
  • To strategically analyze the regulatory analysis, pricing analysis, value chain analysis, supply chain analysis, ecosystem analysis, technology analysis, Porter’s Five Forces analysis, and patent analysis
  • To analyze micromarkets with respect to individual growth trends, prospects, and contributions to the overall market
  • To analyze market opportunities for stakeholders and provide details of the competitive landscape for key players
  • To forecast the size of market segments in North America, Europe, the Asia Pacific, Latin America, and the Middle East & Africa
  • To strategically analyze the market structure, profile the key players in the global drug device combination products market, and comprehensively analyze their core competencies
  • To track and analyze company developments such as acquisitions, partnerships, expansions, and product launches and approvals in the drug device combination products market
  • To track and analyze competitive developments such as mergers and acquisitions, new product developments, partnerships, agreements, collaborations, and expansions in the global drug device combination products  market

Key Questions Addressed by the Report

What are the drivers for the drug device combination products market?

The increasing incidence of chronic diseases like diabetes, a favorable reimbursement climate, and a focus on developing technologically advanced drug-device combination products are expected to drive market growth during the forecast period.

Which therapy segment in the drug device combination products market provides the most opportunity for growth?

The diabetes segment offers the most growth opportunity due to rising diabetes prevalence, an aging population, government initiatives, and increased patient awareness. This drives demand for insulin and GLP-1 drug-device combination products.

Which end-user segment is expected to show strong growth?

The home care setting segment is expected to grow significantly, driven by an aging population, technological advancements, patient preference for self-administration, cost-effectiveness, favorable reimbursement, and government support.

What are the main vendors present in this sector?

Key vendors include Abbott (US), Boston Scientific Corporation (US), Medtronic (Ireland), Becton, Dickinson and Company (US), Novartis AG (Switzerland), Novo Nordisk A/S (Denmark), Sanofi (France), Eli Lilly and Company (US), Merck KGaA (Germany), and AbbVie Inc. (US).

Which region is expected to witness significant demand for the drug device combination products market in the coming years?

The Asia Pacific region, especially China and India, is expected to see significant demand due to rising chronic disease prevalence, improved healthcare infrastructure, increased awareness of diabetes care, and advancements in self-administered combination products.

Personalize This Research

  • Triangulate with your Own Data
  • Get Data as per your Format and Definition
  • Gain a Deeper Dive on a Specific Application, Geography, Customer or Competitor
  • Any level of Personalization
Request A Free Customisation

Let Us Help You

  • What are the Known and Unknown Adjacencies Impacting the Drug Device Combination Products Market
  • What will your New Revenue Sources be?
  • Who will be your Top Customer; what will make them switch?
  • Defend your Market Share or Win Competitors
  • Get a Scorecard for Target Partners
Customized Workshop Request

Custom Market Research Services

We Will Customise The Research For You, In Case The Report Listed Above Does Not Meet With Your Requirements

Get 10% Free Customisation

Growth opportunities and latent adjacency in Drug Device Combination Products Market

DMCA.com Protection Status