



Enterprise Asset Management Market
Report Code
TC 3454
Published in
Sep, 2026, By MarketsandMarkets™
Enterprise Asset Management Market by Asset Class (Linear, Fleet & Mobile, Fixed Assets, Production Equipment), Application (Asset Lifecycle Management, Operations, Maintenance Management, Other Applications), Deployment Type, Region - Global Forecast to 2031

USD 12.55 BN
MARKET SIZE, 2031

CAGR 10.1%
(2026-2031)

320
REPORT PAGES

200
MARKET TABLES
OVERVIEW
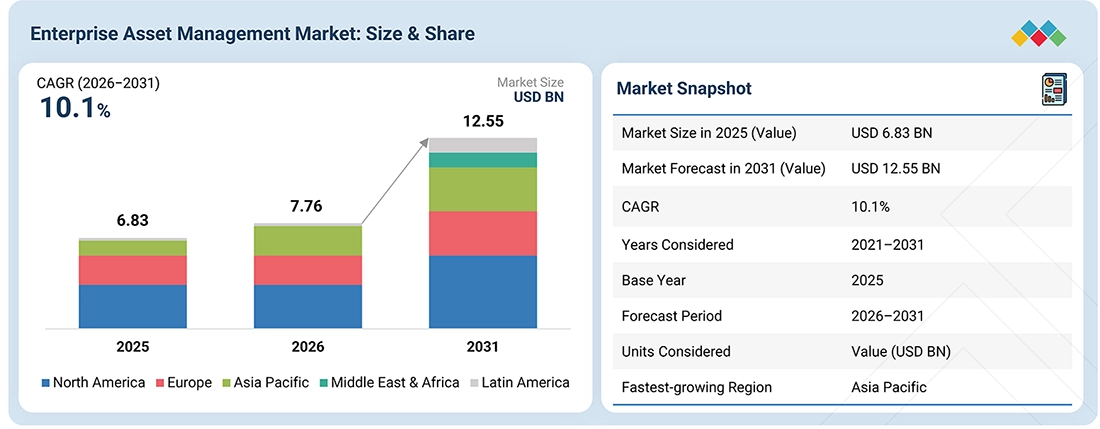
Source: Secondary Research, Interviews with Experts, MarketsandMarkets Analysis
The enterprise asset management market is projected to grow from USD 7.76 billion in 2026 to USD 12.55 billion by 2031, at a CAGR of 10.1% during the forecast period. The enterprise asset management market is advancing as organizations prioritize intelligent asset lifecycle management, connected maintenance operations, and unified asset data architectures across distributed facilities. Vendors are differentiating through AI-enabled EAM software, predictive maintenance, embedded analytics, mobile workforce capabilities, and automation that strengthens asset reliability, optimizes maintenance scheduling, and supports enterprise-wide operational decision making.
KEY TAKEAWAYS
-
BY REGIONAsia Pacific is likely to be the fastest-growing market for enterprise asset management solutions and services, driven by rapid industrial digitalization, expanding connected asset networks, and increasing adoption of predictive maintenance requiring scalable, intelligent asset management platforms.
-
BY OFFERINGSolutions are expected to capture the largest share of the enterprise asset management market in 2031.
-
BY APPLICATIONBy application, the maintenance management segment is expected to record at the fastest rate of 10.8% during the forecast period in the enterprise asset management market.
-
BY ASSET CLASSLinear assets are expected to record the fastest growth rate of 10.8% of the global enterprise asset management market during the forecast period.
-
BY DEPLOYMENT TYPEBy deployment type, cloud is expected to witness the fastest growth rate 14.3% during the forecast period in the global enterprise asset management market.
-
BY ORGANIZATION SIZESMEs are likely to witness the fastest growth rate in the enterprise asset management market as expanding asset bases, limited maintenance resources, and tight budgets drive adoption of cloud-based EAM software and scalable, configurable asset management solutions.
-
BY VERTICALBy vertical, the manufacturing segment is expected to capture the largest market share as manufacturers expand connected asset networks, predictive maintenance programs, and enterprise-wide asset lifecycle management infrastructure.
-
COMPETITIVE LANDSCAPE - KEY PLAYERSIBM, SAP, Oracle, Siemens, and IFS are key players in the enterprise asset management market, delivering AI-enabled EAM software, predictive maintenance, asset performance management, mobile workforce solutions, and integrated asset lifecycle platforms for complex industrial operations.
-
COMPETITIVE LANDSCAPE - STARTUPS/SMEsAsset Panda, Asset Infinity, KloudGin have distinguished themselves among startups and SMEs through robust product portfolios and effective business strategies.
As asset data becomes increasingly distributed across maintenance, operations, supply chain, and enterprise systems, demand for Enterprise Asset Management (EAM) platforms that orchestrate connected asset lifecycle operations is accelerating. Vendors are embedding intelligent workflow automation, unified asset data models, and interoperable integration frameworks to improve operational agility, strengthen asset governance, and enable proactive maintenance and reliability interventions.
TRENDS & DISRUPTIONS IMPACTING CUSTOMERS' CUSTOMERS
Disruptions in enterprise asset management (EAM) are expected to reshape revenue sources of market players over the next 7–10 years by shifting demand from traditional on-premises EAM software, computerized maintenance and standalone work-order management systems toward cloud-native EAM and SaaS platforms, IoT- and sensor-enabled asset management, AI-powered maintenance planning, digital twins, and connected asset ecosystems. This transition is driven by the growing need for manufacturing companies to connect plant assets with maintenance data, minimize unplanned downtime, optimize maintenance and asset costs, and manage distributed and aging assets. In energy and utilities, EAM adoption is increasingly linked to asset-risk-based maintenance, integration of field and asset operations, and improved reliability and faster failure resolution. Similarly, transportation and logistics companies are prioritizing fleet and infrastructure availability, real-time asset visibility, and optimized field maintenance and resources. These client imperatives are expected to translate into measurable operational outcomes, including higher equipment availability and OEE, lower unplanned downtime and maintenance costs, standardized maintenance practices, extended asset life, greater infrastructure reliability, faster failure detection, and lower lifecycle costs. Consequently, new use cases, technologies, products and offerings, clients and partners, and targeted M&A are expected to expand the share of new revenue sources in the enterprise asset management market while gradually reducing reliance on legacy revenue streams.
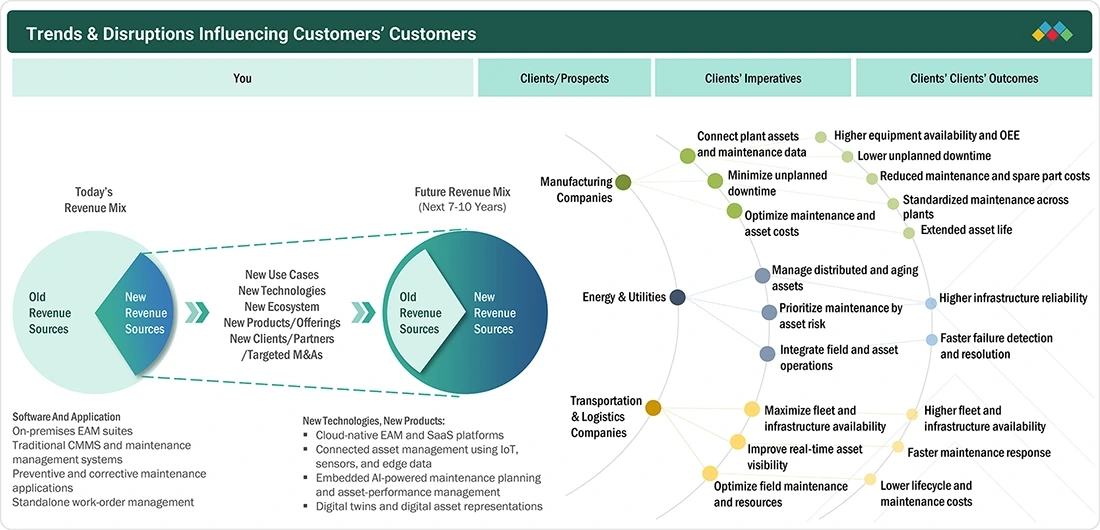
Source: Secondary Research, Interviews with Experts, MarketsandMarkets Analysis
MARKET DYNAMICS

Drivers
Impact
Level
Level
-
Rising demand for higher asset uptime

-
Pressing need for real-time asset insights


RESTRAINTS
Impact
Level
Level
-
High upfront implementation costs

-
Complex integration and system modernization requirements


OPPORTUNITIES
Impact
Level
Level
-
Expansion of digital twins and lifecycle simulation

-
Growing adoption of remote maintenance


CHALLENGES
Impact
Level
Level
-
Fragmented asset data and legacy systems

-
Shortage of skilled asset management professionals

Source: Secondary Research, Interviews with Experts, MarketsandMarkets Analysis
Driver: Accelerating adoption of AI-driven, connected asset operation
The growing demand for higher asset uptime, greater maintenance efficiency, and improved asset lifecycle value is accelerating the adoption of AI-powered EAM platforms. Organizations are increasingly leveraging predictive analytics, condition monitoring, generative AI, and automated workflows to enable predictive and prescriptive asset management. These capabilities help organizations identify potential failures earlier, optimize maintenance activities, reduce unplanned downtime, and improve overall asset reliability.
Restraint: Complex Integration and System Modernization Requirements
The complexity and cost of integrating EAM platforms with legacy ERP systems, operational technologies, asset databases, and existing maintenance systems can create significant implementation challenges. Large organizations may require extensive data migration, system integration, customization, process redesign, and user training to ensure seamless deployment. These requirements can increase implementation costs and timelines, create operational disruptions, and delay the realization of returns on EAM investments, thereby constraining the adoption of EAM solutions.
Opportunity: Expansion of digital twins and lifecycle simulation
The growing adoption of digital twins presents an opportunity for EAM vendors to expand beyond traditional maintenance management toward comprehensive asset lifecycle optimization. Digital twins integrate real-time asset data with engineering information, maintenance histories, and operational conditions, enabling organizations to continuously monitor asset performance, simulate operating scenarios, predict potential failures, and optimize maintenance and asset-management strategies throughout the asset lifecycle.
Challenge: Fragmented asset data and legacy systems
Dispersed asset information, along with complicated legacy systems, results in difficulties in upgrading EAM, especially for big companies, which utilize many custom technologies. The use of EAM technology to integrate with ERP, MES, inventory, engineering, and operational systems brings other burdens, such as the need to migrate data, standardize it, and implement the necessary actions, which makes the upgrade process more complicated and less speedy.
ENTERPRISE ASSET MANAGEMENT MARKET: COMMERCIAL USE CASES ACROSS INDUSTRIES
| COMPANY | USE CASE DESCRIPTION | BENEFITS |
|---|---|---|
 |
Hungrana Kft. modernized maintenance and safety with SAP EAM | Hungrana achieved significant cost savings, improved technician productivity, and reduced paperwork through digitalized maintenance. The solutions also enhanced workplace safety, ensured regulatory compliance, and supported long-term sustainability goals. |
 |
Riyadh Airports Company (RAC) transformed King Khalid International Airport’s maintenance operations by deploying IBM Maximo | RAC achieved major efficiency gains with an 80% reduction in paperwork, a 50% improvement in real-time insights, and contractor onboarding cut from 10 days to just 2–3. Inspector productivity rose by over 40%, while automated workflows and preventive maintenance minimized errors, reduced downtime, and optimized asset lifecycle costs. |
 |
Transdev Sweden rapidly deployed Hexagon’s HxGN EAM to take over the Mälartåg rail network | Transdev Sweden ensured uninterrupted passenger services with improved maintenance efficiency and seamless asset tracking across rail and bus fleets. The future-ready HxGN EAM platform also supports proactive strategies, system integration, and readiness for electric bus adoption. |
 |
L’Oréal implemented Maintenance Connection CMMS to enhance preventive maintenance, streamline workflows, and centralize asset data across its U.S. facilities. | L’Oréal achieved lower maintenance costs and fewer equipment breakdowns through preventive maintenance. The company also improved mechanic productivity and real-time asset visibility, enabling proactive downtime management. |
 |
Anderson Dahlen implemented Aptean EAM to centralize preventive maintenance, streamline work order tracking, and reduce reliance on costly outsourced contractors. | Anderson Dahlen cut maintenance costs by replacing outsourced services with an expanded in-house team and centralized preventive maintenance requests. This improved response speed, reduced downtime, and provided data-driven visibility for smarter decision-making. |
Logos and trademarks shown above are the property of their respective owners. Their use here is for informational and illustrative purposes only.
MARKET ECOSYSTEM
The EAM ecosystem comprises platforms that support asset investment planning and lifecycle management, enterprise asset and maintenance management solutions that streamline preventive maintenance, asset management, and work-order processes, operations, work, and field asset management platforms that improve workforce execution, and asset performance and reliability management solutions that enable predictive analytics, risk assessment, and asset optimization. Within this ecosystem, a core group of vendors, including IBM and SAP, offers capabilities spanning the entire asset lifecycle, from investment planning and asset acquisition to maintenance, field operations, and performance monitoring. Their broad portfolios indicate a competitive focus on end-to-end suite capabilities, integration, and lifecycle coverage rather than specialization in a single functional area. In the Asset Lifecycle & Investment Management category, Siemens and AVEVA stand out for their capabilities in engineering analytics, asset planning, and long-term capital investment management. The Enterprise Asset & Maintenance Management category includes specialized CMMS providers such as UpKeep and Limble, which primarily focus on day-to-day maintenance execution, work-order management, and technician productivity rather than broader capital planning. Similarly, the Operations, Work & Field Asset Management category includes suite providers such as ServiceNow and Trimble, reflecting the convergence of field service management, asset operations, and enterprise workflow capabilities. In contrast, the Asset Performance & Reliability Management category features specialized providers such as AspenTech and Fluke, with a stronger emphasis on condition monitoring, asset performance, and reliability analytics. Overall, the competitive landscape reflects a two-tier structure comprising diversified incumbents that compete through breadth, integration, and end-to-end lifecycle capabilities, alongside specialized vendors that differentiate through focused solutions for maintenance execution, field operations, asset performance, and reliability management.
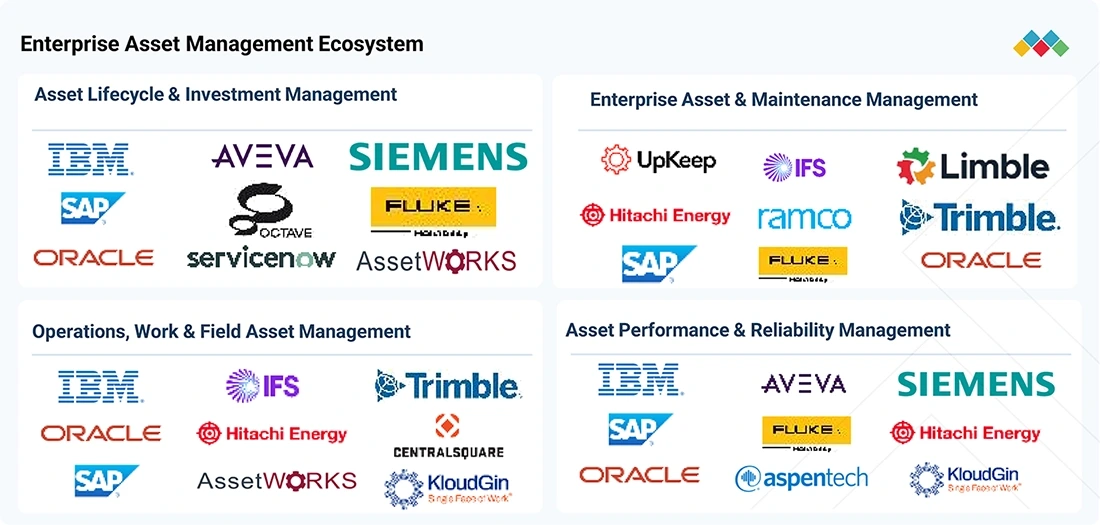
Logos and trademarks shown above are the property of their respective owners. Their use here is for informational and illustrative purposes only.
MARKET SEGMENTS
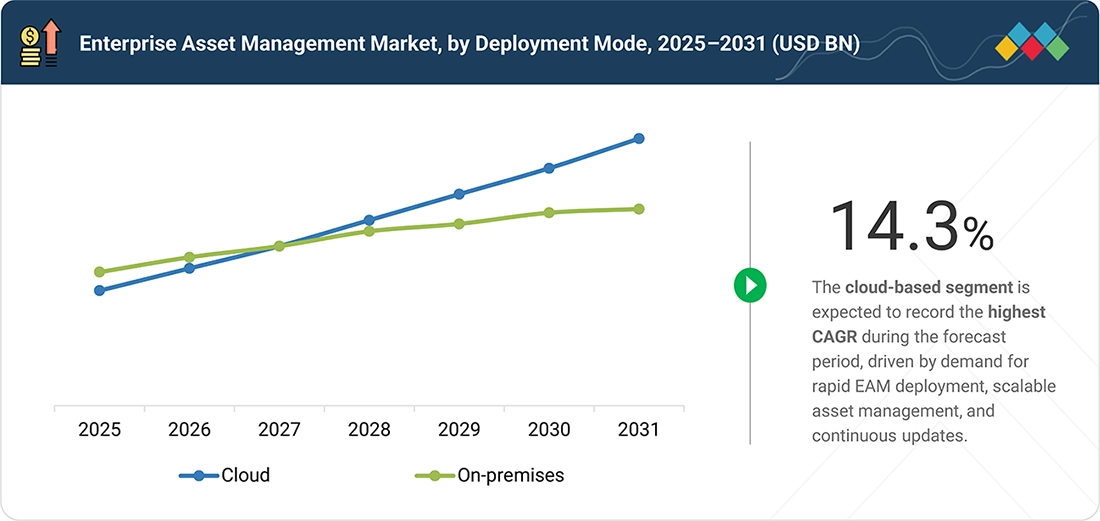
Source: Secondary Research, Interviews with Experts, MarketsandMarkets Analysis
Enterprise Asset Management (EAM) Market, By Offering
The services segment is growing rapidly as companies need special support in upgrading their asset management systems and maximizing their value. Demand is growing in areas such as training and consulting for asset strategy, process unification, and AI readiness; deployment and integration for legacy modernization, ERP, MES, IoT, APM, etc., and appropriate support for constant improvements and updates, cybersecurity, and performance of the base system.
Enterprise Asset Management (EAM) Market, By Application
By application, operations management is likely to capture the largest market share given that EAM will become the implementation layer that integrates asset condition with the maintenance schedules, work orders, field tasks and availability of resources. In the context of the transition to real time asset data, AI-based prioritization, and mobile work implementation, operations management is deemed to play a crucial role in enhancing uptime and maintenance efficiency.
Enterprise Asset Management (EAM) Market, By Asset Class
By asset class, it is anticipated that the production equipment sector will expand more quickly due to manufacturers moving toward highly mechanized production systems rich in sensors, where equipment malfunction has a direct impact on throughput and OEE. The more frequent application of condition data, digital twins, and AI-based failure prediction software will allow organizations to move from scheduled maintenance regimes to continuous equipment performance improvement and usage decisions related to the remaining life of equipment.
Enterprise Asset Management (EAM) Market, By Deployment Type
By deployment type, cloud is expected to witness the fastest growth, driven by the need to modernize fragmented EAM environments while minimizing disruption to heavily customized legacy systems. The increasing demand for AI-enabled capabilities, real-time asset visibility, and standardized integrations is further supporting cloud adoption, particularly among organizations with geographically dispersed assets undergoing phased EAM modernization.
Enterprise Asset Management (EAM) Market, By Organization Size
Large enterprises now regard EAM as an orchestration level in the relationship between operational technology and business applications, instead of viewing it just as a maintenance application. This is changing the demand for solutions that can continuously ingest assets and health data, and use AI to arrange jobs. In addition, the present customers expect that the vendors will lessen the integration friction and support the environments with various obsolete technologies.
Enterprise Asset Management (EAM) Market, By Vertical
Transportation and logistics will record the highest growth rate during the study period among all vertical segments. This is because sensor networks are being deployed in fleets, rail networks, airports, ports, and logistics infrastructure to make them increasingly interconnected and operational. The transformation from traditional maintenance to condition-based maintenance, and the use of AI-assisted tools for thorough fleet and infrastructure monitoring, will broaden the scope of enterprise asset management (EAM) from asset tracking processes to lifecycle management solutions.
REGION
Asia Pacific to be largest region in global enterprise asset management market during forecast period
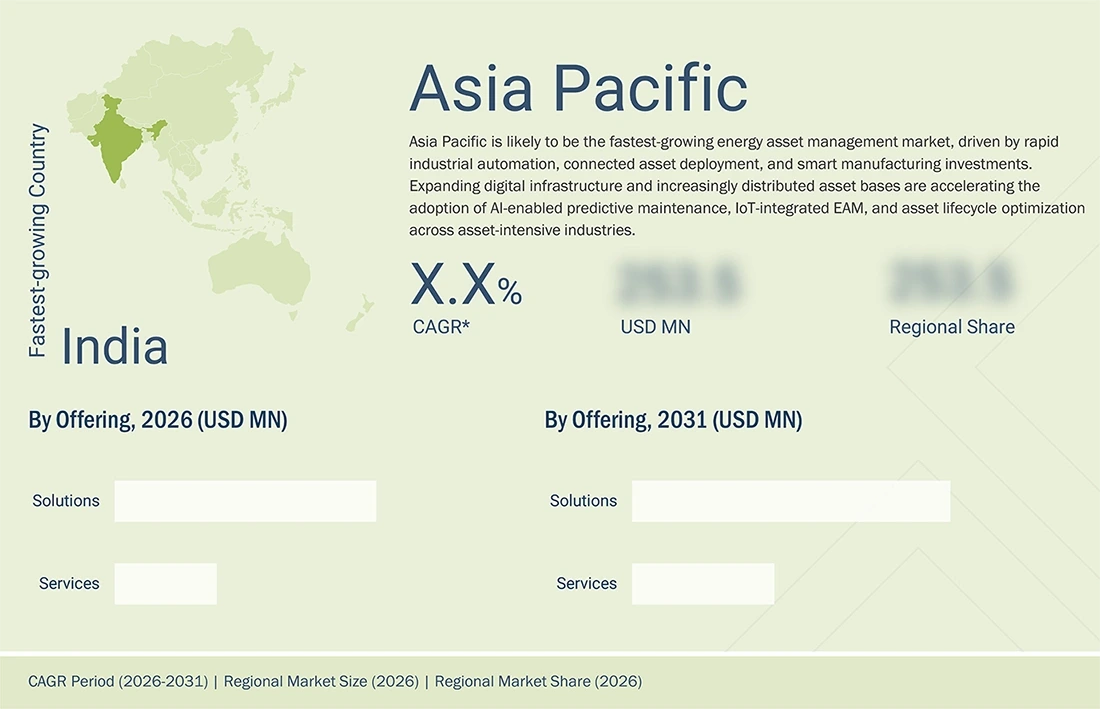
According to forecasts, Asia Pacific is expected to register the highest growth in the enterprise asset management market, driven by rapid industrialization and the modernization of both newly digitized assets and aging legacy infrastructure. The increasing adoption of smart manufacturing, localized production, and infrastructure automation is creating strong demand for EAM solutions that integrate IoT data, maintenance operations, asset hierarchies, and lifecycle management across distributed facilities. As enterprises prioritize operational efficiency, asset visibility, and cost optimization, the need for integrated EAM platforms is expected to increase across the region.
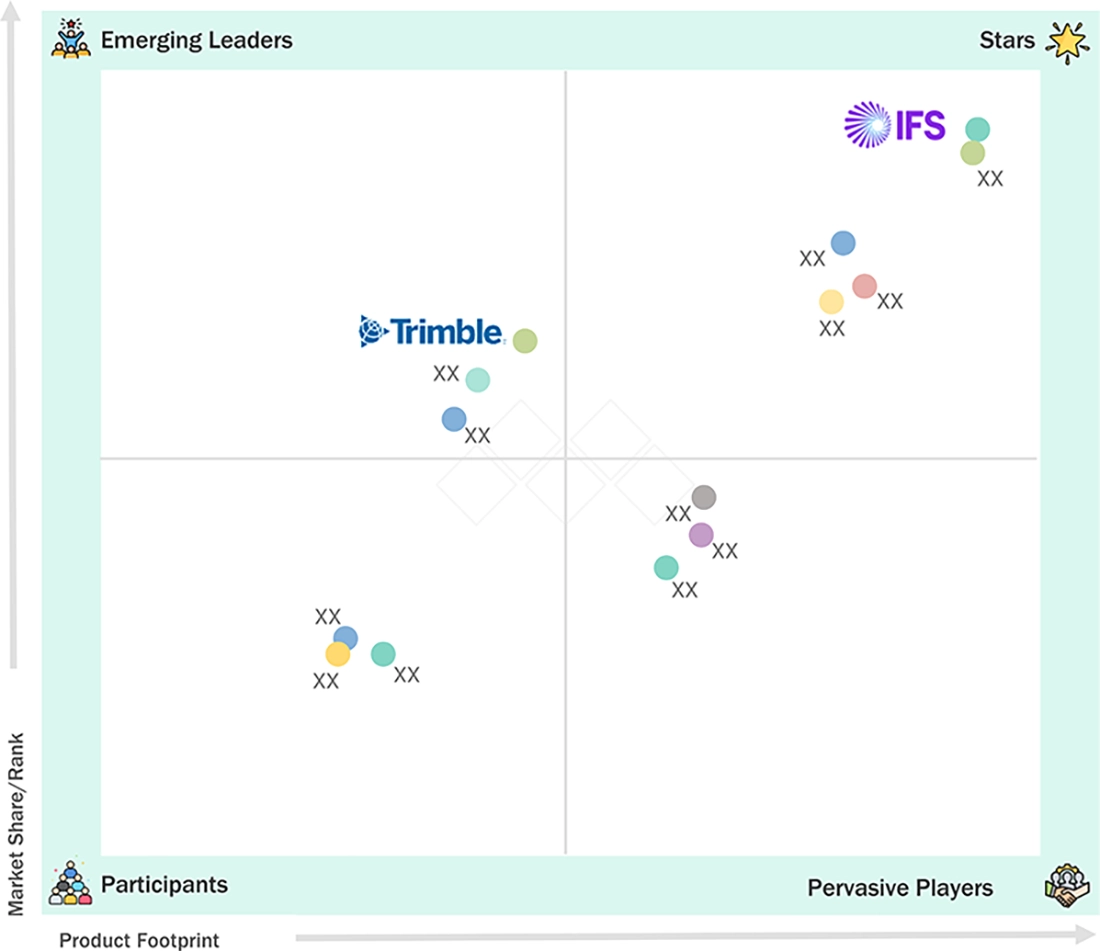
ENTERPRISE ASSET MANAGEMENT MARKET: COMPANY EVALUATION MATRIX
In the enterprise asset management market matrix, IFS (Star) lead with a strong market presence and comprehensive portfolio, enabling large-scale adoption across industries such as manufacturing, energy, and transportation. Trimble (Emerging Leader) is gaining traction with scalable, data-driven EAM solutions tailored for asset-intensive operations. While IFS dominates with scale and enterprise reach, other providers such as SAP and IBM show strong growth potential to advance toward the leaders’ quadrant.
Source: Secondary Research, Interviews with Experts, MarketsandMarkets Analysis
KEY MARKET PLAYERS
- IBM (US)
- Oracle (US)
- SAP (Germany)
- Octave Intelligence (Ireland)
- IFS (Sweden)
- Aptean (US)
- Siemens (Germany)
- CGI (Canada)
- Trimble (US)
- ServiceNow (US)
- Eptura (US)
- Hitachi Energy (Switzerland)
- Ramco Systems (India)
- Accruent (US)
- MaintainX (US)
- ABS Group (US)
- Central Square Technologies (US)
- KloudGin (US)
- Assetworks (US)
- Limble CMMS (US)
- Upkeep (US)
- Asset Panda (US)
- emaint (US)
- Asset Infinity (India)
- Pragma (South Africa)
- EZmaintain (US)
- Llumin (US)
- IPS Intelligent Process Solutions (Germany)
- Ideagen (England)
- ePROMIS Solutions (US)
MARKET SCOPE
| REPORT METRIC | DETAILS |
|---|---|
| Market Size in 2025 (Value) | USD 6.83 Billion |
| Market Size in 2026 (Value) | USD 7.76 Billion |
| Market Forecast in 2031 (Value) | USD 12.55 Billion |
| CAGR | 10.1% |
| Years Considered | 2021-2031 |
| Base Year | 2025 |
| Forecast Period | 2026-2031 |
| Units Considered | Value (USD Billion) |
| Report Coverage | Revenue forecast, company ranking, competitive landscape, growth factors, and trends |
| Segments Covered |
|
| Regions Covered | North America, Europe, Asia Pacific, Middle East & Africa, Latin America |
WHAT IS IN IT FOR YOU: ENTERPRISE ASSET MANAGEMENT MARKET REPORT CONTENT GUIDE
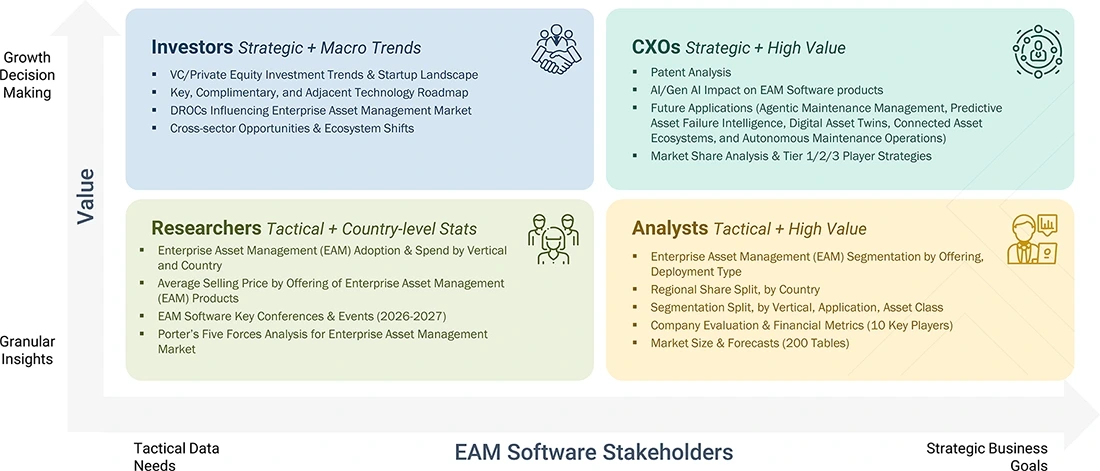
DELIVERED CUSTOMIZATIONS
We have successfully delivered the following deep-dive customizations:
| CLIENT REQUEST | CUSTOMIZATION DELIVERED | VALUE ADDS |
|---|---|---|
| Logistics Provider (US) | Regional Enterprise Asset Management (EAM) Market Assessment: Analysis of industrial asset modernization, smart manufacturing adoption, connected asset deployment, predictive maintenance initiatives, cloud and on-premises EAM preferences, legacy system integration, and AI-driven asset performance management across Asia Pacific asset-intensive industries. | Identifies high-growth asset management opportunities, prioritizes modernization and AI investments, aligns EAM capabilities with regional industrial transformation priorities, reduces deployment and integration risk, and supports region-specific market expansion strategies |
| Manufacturing & Industrial Enterprise (Asis Pacific) | Additional EAM Vendor Mapping: Identification and profiling of EAM providers across asset lifecycle management, maintenance management, work order management, asset performance management, predictive maintenance, mobile workforce management, IoT integration, digital twins, analytics, and AI-enabled maintenance solutions. | Expands qualified vendor options, strengthens competitive benchmarking, supports platform selection and partnership decisions, identifies capability gaps, reduces technology selection risk, and enables deployment of scalable EAM platforms aligned with evolving asset reliability and operational requirements |
RECENT DEVELOPMENTS
- August 2026 : Interloc Solutions launched interloc.ai, an agentic AI platform built specifically for IBM Maximo and Maximo Application Suite. The collaboration combines specialized AI agents with Maximo APIs, workflows, and security controls to analyze requests, create and update work orders, recommend assignments, retrieve knowledge, and execute approved maintenance actions.
- July 2026 : IFS and Chelsea Football Club expanded their partnership to deploy IFS technology across club operations. While the initial phase covers finance and procurement, future phases are planned to include asset management and facility operations. The agreement therefore represents a prospective EAM customer deployment, with Industrial AI intended to support asset and facility management activities.
- July 2026 : Octave Intelligence renewed a five-year strategic partnership with Veolia Environnement, expanding deployment of Octave Attune EAM to more than 10,000 users globally. The agreement supports digitalization of field operations, maintenance planning, and asset performance across Veolia’s water, waste, and energy activities, while integrating asset condition, regulatory requirements, and operational data through AWS Cloud.
- July 2026 : Siemens, through its owned company Brightly Software, partnered with AppyWay to integrate AppyWay’s Traffic Suite with Brightly’s Confirm asset management system. The collaboration connects digital traffic regulation and kerbside information with highway asset records, work programs, and operational activities, helping UK local authorities improve maintenance coordination and prepare for digital traffic-order compliance requirements.
Table of Contents
 Exclusive indicates content/data unique to MarketsandMarkets and not available with any competitors.
TITLE
PAGE NO
1
INTRODUCTION
31
2
EXECUTIVE SUMMARY
37
3
PREMIUM INSIGHTS
43
4
MARKET OVERVIEW
AI-driven asset ecosystems revolutionize EAM adoption amidst complex integration and compliance challenges.
47
4.1
INTRODUCTION
4.2
MARKET DYNAMICS
4.2.1
DRIVERS
4.2.1.1
ACCELERATING ADOPTION OF AI-DRIVEN, CONNECTED ASSET OPERATION
4.2.1.2
EXPANSION OF CONNECTED ASSET ECOSYSTEMS IS DRIVING EAM ADOPTION
4.2.1.3
DEMAND FOR INDUSTRY-SPECIFIC EAM SOLUTIONS
4.2.1.4
EAM AS TOOL FOR SUSTAINABLE ASSET LIFECYCLE MANAGEMENT
4.2.2
RESTRAINTS
4.2.2.1
HIGH IMPLEMENTATION COMPLEXITY AND INTEGRATION COSTS CONSTRAIN EAM ADOPTION
4.2.2.2
MANAGING COMPLIANCE COMPLEXITY ACROSS BORDERS
4.2.3
OPPORTUNITIES
4.2.3.1
EXPANSION OF DIGITAL TWINS AND LIFECYCLE SIMULATION CREATES NEW EAM OPPORTUNITIES
4.2.3.2
EXPANSION OF MOBILE AND REMOTE MAINTENANCE CAPABILITIES STRENGTHENS EAM ADOPTION
4.2.3.3
CONVERGENCE OF EAM WITH ENTERPRISE AND ASSET LIFECYCLE WORKFLOWS
4.2.4
CHALLENGES
4.2.4.1
FRAGMENTED ASSET DATA AND LEGACY-SYSTEM COMPLEXITY CONSTRAIN EAM MODERNIZATION
4.2.4.2
GROWING MAINTENANCE SKILLS SHORTAGES AND LOSS OF WORKFORCE KNOWLEDGE CONSTRAIN EAM EFFECTIVENESS
4.3
UNMET NEEDS AND WHITE SPACES
4.3.1
UNMET NEEDS IN ENTERPRISE ASSET MANAGEMENT MARKET
4.3.2
WHITE SPACE OPPORTUNITIES
4.4
INTERCONNECTED MARKETS AND CROSS-SECTOR OPPORTUNITIES
4.4.1
INTERCONNECTED MARKETS
4.4.2
CROSS-SECTOR OPPORTUNITIES
4.5
EMERGING BUSINESS MODELS AND ECOSYSTEM SHIFTS
4.5.1
EMERGING BUSINESS MODELS
4.5.1.1
ENTERPRISE ASSET MANAGEMENT BUSINESS MODELS
4.5.2
ECOSYSTEM SHIFTS
4.6
STRATEGIC MOVES BY TIER-1/2/3 PLAYERS
4.6.1
KEY MOVES AND STRATEGIC FOCUS
5
INDUSTRY TRENDS
Navigate emerging industry disruptions with strategic insights from competitive forces and pricing dynamics.
57
5.1
PORTER’S FIVE FORCES ANALYSIS
5.1.1
THREAT OF NEW ENTRANTS
5.1.2
THREAT OF SUBSTITUTES
5.1.3
BARGAINING POWER OF SUPPLIERS
5.1.4
BARGAINING POWER OF BUYERS
5.1.5
INTENSITY OF COMPETITIVE RIVALRY
5.2
MACROECONOMIC INDICATORS
5.2.1
INTRODUCTION
5.2.2
GDP TRENDS & FORECASTS
5.2.3
TRENDS IN GLOBAL HUMAN CAPITAL MANAGEMENT INDUSTRY
5.2.4
TRENDS IN GLOBAL WORKFORCE MANAGEMENT INDUSTRY
5.3
VALUE CHAIN ANALYSIS
5.4
ECOSYSTEM ANALYSIS
5.5
PRICING ANALYSIS
5.5.1
AVERAGE SELLING PRICE, BY REGION, 2024–2026
5.5.2
INDICATIVE PRICING, BY KEY PLAYER, 2024
5.6
KEY CONFERENCES AND EVENTS, 2026–2027
5.7
TRENDS/DISRUPTIONS IMPACTING CUSTOMER BUSINESS
5.8
INVESTMENT & FUNDING SCENARIO
5.9
CASE STUDY ANALYSIS
5.9.1
CASE STUDY 1: HUNGRANA UTILIZED SAP EAM FOR ASSET MAINTENANCE
5.9.2
CASE STUDY 2: RIYADH AIRPORTS COMPANY TRANSFORMING AIRPORT ASSET MANAGEMENT WITH IBM MAXIMO
5.9.3
CASE STUDY 3: STOCKHOLM EXERGI ESTABLISHED STANDALONE IT ENVIRONMENT WITH IFS CLOUD
5.9.4
CASE STUDY 4: L’ORÉAL ACHIEVED REAL-TIME ASSET VISIBILITY BY ADOPTING CMMS
5.9.5
CASE STUDY 5: DRIVING 900% ENGINEERING TEAM GROWTH IN SIX MONTHS WITH APTEAN EAM
5.10
IMPACT OF 2025 US TARIFF – ENTERPRISE ASSET MANAGEMENT MARKET
5.10.1
INTRODUCTION
5.10.2
KEY TARIFF RATES
5.10.3
PRICE IMPACT ANALYSIS
5.10.4
IMPACT ON REGIONS
5.10.4.1
NORTH AMERICA
5.10.4.2
EUROPE
5.10.4.3
ASIA PACIFIC
5.10.5
IMPACT ON VERTICALS
5.10.5.1
MANUFACTURING
5.10.5.2
ENERGY & UTILITIES
5.10.5.3
OIL & GAS
5.10.5.4
TRANSPORTATION & LOGISTICS
5.10.5.5
GOVERNMENT & PUBLIC SECTOR
5.10.5.6
HEALTHCARE & LIFE SCIENCES
6
CUSTOMER LANDSCAPE AND BUYER BEHAVIOR
Unlock market profitability by understanding stakeholder influence and unmet needs in key verticals.
77
6.1
DECISION-MAKING PROCESS
6.2
BUYER STAKEHOLDERS AND BUYING EVALUATION CRITERIA
6.2.1
KEY STAKEHOLDERS IN BUYING PROCESS
6.2.2
BUYING CRITERIA
6.3
ADOPTION BARRIERS AND INTERNAL CHALLENGES
6.4
UNMET NEEDS IN VARIOUS END-USER INDUSTRIES
6.5
MARKET PROFITABILITY
6.5.1
REVENUE POTENTIAL
6.5.2
COST DYNAMICS
6.5.3
MARGIN OPPORTUNITIES IN KEY APPLICATIONS
7
REGULATORY LANDSCAPE
Navigate complex global regulations with region-specific insights and key agency overviews.
84
7.1
REGULATORY BODIES, GOVERNMENT AGENCIES, AND OTHER ORGANIZATIONS
7.1.1
KEY REGULATIONS, BY REGION
7.1.1.1
NORTH AMERICA
7.1.1.2
EUROPE
7.1.1.3
ASIA PACIFIC
7.1.1.4
MIDDLE EAST & SOUTH AFRICA
7.1.1.5
LATIN AMERICA
8
STRATEGIC DISRUPTION THROUGH TECHNOLOGY, PATENTS, DIGITAL, AND AI ADOPTION
Revolutionize asset management with AI-driven, autonomous ecosystems and cutting-edge digital technologies.
88
8.1
TECHNOLOGY ANALYSIS
8.1.1
KEY TECHNOLOGIES
8.1.1.1
INDUSTRIAL INTERNET OF THINGS (IIOT) AND CONNECTED ASSET MONITORING
8.1.1.2
ARTIFICIAL INTELLIGENCE AND MACHINE LEARNING
8.1.1.3
DIGITAL TWIN TECHNOLOGY
8.1.2
COMPLEMENTARY TECHNOLOGIES
8.1.2.1
CLOUD COMPUTING AND SAAS
8.1.2.2
MOBILE AND CONNECTED-WORKER TECHNOLOGY
8.1.2.3
GEOGRAPHIC INFORMATION SYSTEMS (GIS) AND LOCATION INTELLIGENCE
8.1.3
ADJACENT TECHNOLOGIES
8.1.3.1
AUGMENTED REALITY AND MIXED REALITY
8.1.3.2
DRONES AND ROBOTIC INSPECTION
8.2
TECHNOLOGY/PRODUCT ROADMAP
8.2.1
SHORT-TERM (2026–2028) | CLOUD MODERNIZATION & AI EMBEDDED ASSET MANAGEMENT
8.2.2
MID-TERM (2028–2031) | CONNECTED ASSET INTELLIGENCE & AUTONOMOUS MAINTENANCE ECOSYSTEMS
8.2.3
LONG-TERM (2031–2035+) | AUTONOMOUS & INTELLIGENT ASSET LIFECYCLE PLATFORMS
8.3
PATENT ANALYSIS
8.3.1
LIST OF MAJOR PATENTS, 2023–2024
8.4
FUTURE APPLICATIONS
8.4.1
CONNECTED CONDITION BASED MAINTENANCE
8.4.2
DIGITAL TWIN ENABLED ASSET LIFECYCLE MANAGEMENT
8.4.3
RISK-BASED ASSET INVESTMENT & REPLACEMENT PLANNING
8.4.4
GIS CENTRIC LINEAR & INFRASTRUCTURE ASSET MANAGEMENT
8.4.5
CLOSED LOOP FIELD TO ENTERPRISE ASSET OPERATIONS
8.5
IMPACT OF AI/GENERATIVE AI ON ENTERPRISE ASSET MANAGEMENT MARKET
8.5.1
TOP USE CASES AND MARKET POTENTIAL
8.5.2
BEST PRACTICES IN ENTERPRISE ASSET MANAGEMENT
8.5.3
CASE STUDY OF AI IMPLEMENTATION IN ENTERPRISE ASSET MANAGEMENT MARKET
8.5.3.1
EXCITEL BUILT PROACTIVE SUPPLY CHAIN WITH ASSET INSIDER
8.5.4
INTERCONNECTED ADJACENT ECOSYSTEM AND IMPACT ON MARKET PLAYERS
8.5.5
CLIENT READINESS TO ADOPT GENERATIVE AI IN THE ENTERPRISE ASSET MANAGEMENT MARKET
8.6
SUCCESS STORIES AND REAL-WORLD APPLICATIONS
8.6.1
IBM: MAXIMO APPLICATION SUITE
8.6.2
IFS: IFS CLOUD EAM
9
ENTERPRISE ASSET MANAGEMENT MARKET, BY OFFERING
Market Size & Growth Rate Forecast Analysis to 2031 in USD Million | 14 Data Tables
104
9.1
INTRODUCTION
9.1.1
OFFERINGS: ENTERPRISE ASSET MANAGEMENT MARKET DRIVERS
9.2
SOLUTIONS
9.2.1
REDUCING DOWNTIME WITH INTEGRATED SOLUTIONS
9.2.2
STANDALONE SOLUTIONS
9.2.3
INTEGRATED PLATFORMS
9.3
SERVICES
9.3.1
EFFECTIVE IMPLEMENTATION OF EAM WITH SERVICES
9.3.2
TRAINING & CONSULTING SERVICES
9.3.3
DEPLOYMENT & INTEGRATION SERVICES
9.3.4
SUPPORT & MAINTENANCE SERVICES
10
ENTERPRISE ASSET MANAGEMENT MARKET, BY APPLICATION
Market Size & Growth Rate Forecast Analysis to 2031 in USD Million | 14 Data Tables
113
10.1
INTRODUCTION
10.1.1
APPLICATIONS: ENTERPRISE ASSET MANAGEMENT MARKET DRIVERS
10.2
ASSET LIFECYCLE MANAGEMENT
10.2.1
FORECASTING FUTURE NEEDS WITH ASSET PLANNING & FORECASTING
10.2.2
ASSET TRACKING & UTILIZATION
10.2.3
ASSET DISPOSAL & REPLACEMENT
10.2.4
ASSET PLANNING & FORECASTING
10.3
OPERATIONS MANAGEMENT
10.3.1
RISING ADOPTION DUE TO NEED FOR ENHANCING OPERATIONAL VISIBILITY
10.3.2
INVENTORY MANAGEMENT
10.3.3
LABOR MANAGEMENT
10.3.4
WORK ORDER MANAGEMENT
10.4
MAINTENANCE MANAGEMENT
10.4.1
INTEGRATING MAINTENANCE WITH WORK ORDERS, LABOR, AND INVENTORY
10.4.2
PREVENTIVE MAINTENANCE
10.4.3
PREDICTIVE MAINTENANCE
10.4.4
CORRECTIVE MAINTENANCE
10.5
COMPLIANCE & SAFETY
10.5.1
MINIMIZING RISK THROUGH PROACTIVE COMPLIANCE MANAGEMENT
10.5.2
AUDIT MANAGEMENT
10.5.3
REGULATORY COMPLIANCE MANAGEMENT
10.5.4
RISK ASSESSMENT & MITIGATION
10.6
REPORT & ANALYTICS
10.6.1
TRANSFORMING ASSET DATA INTO ACTIONABLE INSIGHTS
10.6.2
PERFORMANCE ANALYTICS
10.6.3
KPI DASHBOARDS & ALERTS
10.6.4
SAFETY ANALYTICS
10.7
OTHER APPLICATIONS
11
ENTERPRISE ASSET MANAGEMENT MARKET, BY DEPLOYMENT TYPE
Market Size & Growth Rate Forecast Analysis to 2031 in USD Million | 6 Data Tables
126
11.1
INTRODUCTION
11.1.1
DEPLOYMENT TYPES: ENTERPRISE ASSET MANAGEMENT MARKET DRIVERS
11.2
CLOUD
11.2.1
MAXIMIZING ASSET LIFECYCLE WITH CLOUD EAM
11.3
ON-PREMISES
11.3.1
REDUCING DOWNTIME WITH ROBUST ON-PREMISES SOLUTIONS
12
ENTERPRISE ASSET MANAGEMENT MARKET, BY ASSET CLASS
Market Size & Growth Rate Forecast Analysis to 2031 in USD Million | 12 Data Tables
131
12.1
INTRODUCTION
12.1.1
ASSET CLASSES: ENTERPRISE ASSET MANAGEMENT MARKET DRIVERS
12.2
LINEAR ASSETS
12.2.1
REDUCING OPERATIONAL RISKS IN LINEAR ASSETS
12.2.2
ROADS
12.2.3
PIPELINE
12.2.4
RAILWAYS
12.3
PRODUCTION EQUIPMENT
12.3.1
PREDICTIVE MAINTENANCE FOR INDUSTRIAL MACHINERY
12.3.2
TURBINES
12.3.3
ROTARY PUMPS
12.3.4
COMPRESSORS
12.4
FLEET & MOBILE ASSETS
12.4.1
FUEL AND COST OPTIMIZATION FOR FLEET MANAGEMENT
12.4.2
VEHICLES
12.4.3
TRUCKS
12.4.4
AIRCRAFT
12.5
FIXED/FACILITY ASSETS/INFRASTRUCTURE
12.5.1
EXTENDING LIFESPAN OF FIXED ASSETS
12.5.2
BUILDINGS
12.5.3
PLANTS
12.5.4
WAREHOUSES
12.6
OTHER ASSET CLASSES
13
ENTERPRISE ASSET MANAGEMENT MARKET, BY ORGANIZATION SIZE
Market Size & Growth Rate Forecast Analysis to 2031 in USD Million | 6 Data Tables
142
13.1
INTRODUCTION
13.1.1
ORGANIZATION SIZES: ENTERPRISE ASSET MANAGEMENT MARKET DRIVERS
13.2
LARGE ENTERPRISES
13.2.1
EAM REDUCING DOWNTIME & OPERATIONAL DISRUPTIONS FOR LARGE ENTERPRISES
13.3
SMALL & MEDIUM ENTERPRISES
13.3.1
USER-FRIENDLY EAM TOOLS FOR RESOURCE-LIMITED TEAMS
14
ENTERPRISE ASSET MANAGEMENT MARKET, BY VERTICAL
Market Size & Growth Rate Forecast Analysis to 2031 in USD Million | 16 Data Tables
147
14.1
INTRODUCTION
14.1.1
VERTICALS: ENTERPRISE ASSET MANAGEMENT MARKET DRIVERS
14.2
MANUFACTURING
14.2.1
OPTIMIZE PRODUCTION EQUIPMENT PERFORMANCE
14.2.2
MANUFACTURING: USE CASES
14.2.2.1
PREDICTIVE MAINTENANCE FOR CNC MACHINES
14.2.2.2
REAL-TIME MONITORING OF PRODUCTION LINE
14.2.2.3
MANAGING INVENTORY OF CRITICAL SPARE PARTS
14.3
ENERGY & UTILITIES
14.3.1
OPTIMIZE ENERGY GENERATION AND DISTRIBUTION
14.3.2
ENERGY & UTILITIES: USE CASES
14.3.2.1
TRANSFORMER MAINTENANCE
14.3.2.2
ENERGY USAGE TRACKING
14.3.2.3
GRID MONITORING
14.4
OIL & GAS
14.4.1
MINIMIZED UNPLANNED DOWNTIME WITH EAM
14.4.2
OIL & GAS: USE CASES
14.4.2.1
REGULATORY COMPLIANCE
14.4.2.2
RIG MAINTENANCE
14.4.2.3
PIPELINE MONITORING
14.5
TRANSPORTATION & LOGISTICS
14.5.1
IMPLEMENT PREDICTIVE VEHICLE MAINTENANCE
14.5.2
TRANSPORTATION & LOGISTICS: USE CASES
14.5.2.1
FLEET MAINTENANCE
14.5.2.2
ROUTE OPTIMIZATION
14.5.2.3
VEHICLE TRACKING
14.6
HEALTHCARE & LIFE SCIENCES
14.6.1
BETTER INSIGHTS, REDUCED COSTS, AND ENHANCED MANAGEMENT OF MEDICAL SUPPLIES
14.6.2
HEALTHCARE & LIFE SCIENCES: USE CASES
14.6.2.1
DEVICE MAINTENANCE
14.6.2.2
LAB ASSET MANAGEMENT
14.6.2.3
FACILITY ASSET TRACKING
14.7
GOVERNMENT & PUBLIC SECTOR
14.7.1
BETTER MONITORING OF PUBLIC INFRASTRUCTURE ASSETS
14.7.2
GOVERNMENT & PUBLIC SECTOR: USE CASES
14.7.2.1
INFRASTRUCTURE MONITORING
14.7.2.2
PUBLIC EQUIPMENT TRACKING
14.7.2.3
ENERGY CONSUMPTION MONITORING
14.8
OTHER VERTICALS
15
ENTERPRISE ASSET MANAGEMENT MARKET, BY REGION
Comprehensive coverage of 8 Regions with country-level deep-dive of 14 Countries | 124 Data Tables.
161
15.1
INTRODUCTION
15.2
NORTH AMERICA
15.2.1
NORTH AMERICA: ENTERPRISE ASSET MANAGEMENT MARKET DRIVERS
15.2.2
US
15.2.2.1
EAM IMPLEMENTATION FOR LONG ISLAND RAILROAD
15.2.3
CANADA
15.2.3.1
EAM SOLUTIONS SUPPORTING OPERATIONAL EFFICIENCY IN CANADA
15.3
EUROPE
15.3.1
EUROPE: ENTERPRISE ASSET MANAGEMENT MARKET DRIVERS
15.3.2
UK
15.3.2.1
RISING DEMAND FOR EAM SOLUTIONS ACROSS UK ASSET-INTENSIVE INDUSTRIES
15.3.3
GERMANY
15.3.3.1
INNOVATIONS SHAPING EAM SOLUTIONS IN GERMANY
15.3.4
FRANCE
15.3.4.1
DIGITAL TRANSFORMATION DRIVES EAM ADOPTION IN FRANCE
15.3.5
ITALY
15.3.5.1
GOVERNMENT INCENTIVES ACCELERATING EAM IMPLEMENTATION
15.3.6
REST OF EUROPE
15.4
ASIA PACIFIC
15.4.1
ASIA PACIFIC: ENTERPRISE ASSET MANAGEMENT MARKET DRIVERS
15.4.2
CHINA
15.4.2.1
BAKER HUGHES AND SINOCHEM LEAD ENTERPRISE-LEVEL EAM DEPLOYMENT
15.4.3
JAPAN
15.4.3.1
SERVICENOW ENHANCING EAM SOLUTIONS IN JAPAN
15.4.4
AUSTRALIA & NEW ZEALAND
15.4.4.1
GOVERNMENT INITIATIVES SHAPING EAM GROWTH IN AUSTRALIA AND NEW ZEALAND
15.4.5
REST OF ASIA PACIFIC
15.5
MIDDLE EAST & AFRICA
15.5.1
MIDDLE EAST & AFRICA: ENTERPRISE ASSET MANAGEMENT MARKET DRIVERS
15.5.2
GCC COUNTRIES
15.5.2.1
UAE
15.5.2.1.1
STRENGTHENING INDUSTRIAL RESILIENCE VIA ENTERPRISE ASSET MANAGEMENT
15.5.2.2
SAUDI ARABIA
15.5.2.2.1
VISION 2030 RAISES NEED FOR EAM SOLUTIONS
15.5.2.3
REST OF GCC COUNTRIES
15.5.3
SOUTH AFRICA
15.5.3.1
LOCAL AND GLOBAL EAM SOLUTIONS POWERING SOUTH AFRICA’S GROWTH
15.5.4
REST OF MIDDLE EAST & AFRICA
15.6
LATIN AMERICA
15.6.1
LATIN AMERICA: ENTERPRISE ASSET MANAGEMENT MARKET DRIVERS
15.6.2
BRAZIL
15.6.2.1
SUPPORTING INDUSTRIAL MODERNIZATION WITH EAM SOLUTIONS IN BRAZIL
15.6.3
MEXICO
15.6.3.1
REDUCING OPERATIONAL DOWNTIME WITH PREDICTIVE MAINTENANCE IN MEXICO
15.6.4
REST OF LATIN AMERICA
16
COMPETITIVE LANDSCAPE
Discover key strategies and market positions shaping the competitive landscape through 2026.
212
16.1
INTRODUCTION
16.2
KEY PLAYER STRATEGIES/RIGHT TO WIN, 2024–2026
16.3
REVENUE ANALYSIS, 2021–2025
16.4
MARKET SHARE ANALYSIS, 2025
16.5
PRODUCT COMPARISON
16.6
COMPANY EVALUATION MATRIX: KEY PLAYERS, 2026
16.6.1
STARS
16.6.2
EMERGING LEADERS
16.6.3
PERVASIVE PLAYERS
16.6.4
PARTICIPANTS
16.6.5
COMPANY FOOTPRINT: KEY PLAYERS, 2026
16.6.5.1
COMPANY FOOTPRINT
16.6.5.2
REGIONAL FOOTPRINT
16.6.5.3
VERTICAL FOOTPRINT
16.6.5.4
ASSET CLASS FOOTPRINT
16.7
COMPANY EVALUATION MATRIX: STARTUPS/SMES, 2026
16.7.1
PROGRESSIVE COMPANIES
16.7.2
RESPONSIVE COMPANIES
16.7.3
DYNAMIC COMPANIES
16.7.4
STARTING BLOCKS
16.7.5
COMPETITIVE BENCHMARKING: STARTUPS/SMES, 2026
16.7.5.1
DETAILED LIST OF KEY STARTUPS/SMES
16.7.5.2
COMPETITIVE BENCHMARKING OF KEY STARTUPS/SMES
16.8
COMPANY VALUATION AND FINANCIAL METRICS
16.8.1
COMPANY VALUATION OF KEY VENDORS
16.8.2
FINANCIAL METRICS OF KEY VENDORS
16.9
COMPETITIVE SCENARIO
16.9.1
PRODUCT LAUNCHES/ENHANCEMENTS
16.9.2
DEALS
17
COMPANY PROFILES
In-depth Company Profiles of Leading Market Players with detailed Business Overview, Product and Service Portfolio, Recent Developments, and Unique Analyst Perspective (MnM View)
244
17.1
INTRODUCTION
17.2
KEY PLAYERS
17.2.1
IBM
17.2.1.1
BUSINESS OVERVIEW
17.2.1.2
PRODUCTS/SOLUTIONS/SERVICES OFFERED
17.2.1.3
RECENT DEVELOPMENTS
17.2.1.3.1
PRODUCT LAUNCHES/PRODUCT ENHANCEMENTS
17.2.1.3.2
DEALS
17.2.1.4
MNM VIEW
17.2.1.4.1
RIGHT TO WIN
17.2.1.4.2
STRATEGIC CHOICES
17.2.1.4.3
WEAKNESSES AND COMPETITIVE THREATS
17.2.2
IFS
17.2.3
SAP
17.2.4
HITACHI ENERGY
17.2.5
SERVICENOW
17.2.6
OCTAVE INTELLIGENCE
17.2.7
SIEMENS
17.2.8
TRIMBLE
17.2.9
ORACLE
17.2.10
CGI
17.3
OTHER PLAYERS
17.3.1
ACCRUENT
17.3.2
APTEAN
17.3.3
MAINTAINX
17.3.4
EPTURA
17.3.5
ABS GROUP
17.3.6
LIMBLE CMMS
17.3.7
ASSETWORKS
17.3.8
CENTRALSQUARE TECHNOLOGIES
17.3.9
PRAGMA
17.3.10
UPKEEP
17.3.11
RAMCO SYSTEMS
17.3.12
EMAINT
17.3.13
KLOUDGIN
17.3.14
IDEAGEN
17.3.15
IPS INTELLIGENT PROCESS SOLUTION
17.3.16
ASSET PANDA
17.3.17
LLUMIN
17.3.18
ASSET INFINITY
17.3.19
EZMAINTAIN
17.3.20
EPROMIS SOLUTIONS
18
RESEARCH METHODOLOGY
305
18.1
RESEARCH DATA
18.1.1
SECONDARY DATA
18.1.1.1
DATA & LIST OF KEY SECONDARY SOURCES
18.1.2
PRIMARY DATA
18.1.2.1
BREAKDOWN OF PRIMARY INTERVIEWS
18.1.2.2
KEY INDUSTRY INSIGHTS
18.2
MARKET SIZE ESTIMATION
18.3
DATA TRIANGULATION
18.4
FACTOR ANALYSIS
18.5
RESEARCH ASSUMPTIONS
19
APPENDIX
315
19.1
DISCUSSION GUIDE
19.2
KNOWLEDGESTORE: MARKETSANDMARKETS’ SUBSCRIPTION PORTAL
19.3
CUSTOMIZATION OPTIONS
19.4
RELATED REPORTS
19.5
AUTHOR DETAILS
LIST OF TABLES
TABLE 1
USD EXCHANGE RATES, 2020–2025
TABLE 2
ENTERPRISE ASSET MANAGEMENT MARKET: PORTER’S FIVE FORCES ANALYSIS
TABLE 3
GDP PERCENTAGE CHANGE, BY KEY COUNTRIES, 2021–2029
TABLE 4
INDICATIVE PRICING OF EAM SOFTWARE SOLUTIONS, BY KEY PLAYER
TABLE 5
ENTERPRISE ASSET MANAGEMENT MARKET: KEY CONFERENCES AND EVENTS IN 2026–2027
TABLE 6
US ADJUSTED RECIPROCAL TARIFF RATES
TABLE 7
INFLUENCE OF STAKEHOLDERS ON BUYING PROCESS FOR TOP THREE VERTICALS
TABLE 8
KEY BUYING CRITERIA FOR TOP THREE VERTICALS
TABLE 9
ENTERPRISE ASSET MANAGEMENT MARKET: UNMET NEEDS IN KEY END-USER INDUSTRIES
TABLE 10
NORTH AMERICA: REGULATORY BODIES, GOVERNMENT AGENCIES, AND OTHER ORGANIZATIONS
TABLE 11
EUROPE: REGULATORY BODIES, GOVERNMENT AGENCIES, AND OTHER ORGANIZATIONS
TABLE 12
ASIA PACIFIC: REGULATORY BODIES, GOVERNMENT AGENCIES, AND OTHER ORGANIZATIONS
TABLE 13
REST OF THE WORLD: REGULATORY BODIES, GOVERNMENT AGENCIES, AND OTHER ORGANIZATIONS
TABLE 14
LIST OF MAJOR PATENTS, 2023–2024
TABLE 15
TOP USE CASES AND MARKET POTENTIAL
TABLE 16
BEST PRACTICES: COMPANIES IMPLEMENTING USE CASES
TABLE 17
INTERCONNECTED ADJACENT ECOSYSTEM AND IMPLICATIONS FOR MARKET PLAYERS
TABLE 18
ENTERPRISE ASSET MANAGEMENT MARKET, BY OFFERING, 2021–2025 (USD MILLION)
TABLE 19
ENTERPRISE ASSET MANAGEMENT MARKET, BY OFFERING, 2026–2031 (USD MILLION)
TABLE 20
ENTERPRISE ASSET MANAGEMENT SOLUTIONS MARKET, BY REGION, 2021–2025 (USD MILLION)
TABLE 21
ENTERPRISE ASSET MANAGEMENT SOLUTIONS MARKET, BY REGION, 2026–2031 (USD MILLION)
TABLE 22
ENTERPRISE ASSET MANAGEMENT SERVICES MARKET, BY SERVICE, 2021–2025 (USD MILLION)
TABLE 23
ENTERPRISE ASSET MANAGEMENT SERVICES MARKET, BY TYPE, 2026–2031 (USD MILLION)
TABLE 24
SERVICES: ENTERPRISE ASSET MANAGEMENT MARKET, BY REGION, 2021–2025 (USD MILLION)
TABLE 25
SERVICES: ENTERPRISE ASSET MANAGEMENT MARKET, BY REGION, 2026–2031 (USD MILLION)
TABLE 26
TRAINING & CONSULTING SERVICES: ENTERPRISE ASSET MANAGEMENT MARKET, BY REGION, 2021–2025 (USD MILLION)
TABLE 27
TRAINING & CONSULTING SERVICES: ENTERPRISE ASSET MANAGEMENT MARKET, BY REGION, 2026–2031 (USD MILLION)
TABLE 28
DEPLOYMENT & INTEGRATION SERVICES: ENTERPRISE ASSET MANAGEMENT MARKET, BY REGION, 2021–2025 (USD MILLION)
TABLE 29
DEPLOYMENT & INTEGRATION SERVICES: ENTERPRISE ASSET MANAGEMENT MARKET, BY REGION, 2026–2031 (USD MILLION)
TABLE 30
SUPPORT & MAINTENANCE SERVICES: ENTERPRISE ASSET MANAGEMENT MARKET, BY REGION, 2021–2025 (USD MILLION)
TABLE 31
SUPPORT & MAINTENANCE SERVICES: ENTERPRISE ASSET MANAGEMENT MARKET, BY REGION, 2026–2031 (USD MILLION)
TABLE 32
ENTERPRISE ASSET MANAGEMENT MARKET, BY APPLICATION, 2021–2025 (USD MILLION)
TABLE 33
ENTERPRISE ASSET MANAGEMENT MARKET, BY APPLICATION, 2026–2031 (USD MILLION)
TABLE 34
ASSET LIFECYCLE MANAGEMENT: ENTERPRISE ASSET MANAGEMENT MARKET, BY REGION, 2021–2025 (USD MILLION)
TABLE 35
ASSET LIFECYCLE MANAGEMENT: ENTERPRISE ASSET MANAGEMENT MARKET, BY REGION, 2026–2031 (USD MILLION)
TABLE 36
OPERATIONS MANAGEMENT: ENTERPRISE ASSET MANAGEMENT MARKET, BY REGION, 2021–2025 (USD MILLION)
TABLE 37
OPERATIONS MANAGEMENT: ENTERPRISE ASSET MANAGEMENT MARKET, BY REGION, 2026–2031 (USD MILLION)
TABLE 38
MAINTENANCE MANAGEMENT: ENTERPRISE ASSET MANAGEMENT MARKET, BY REGION, 2021–2025 (USD MILLION)
TABLE 39
MAINTENANCE MANAGEMENT: ENTERPRISE ASSET MANAGEMENT, BY REGION, 2026–2031 (USD MILLION)
TABLE 40
COMPLIANCE & SAFETY: ENTERPRISE ASSET MANAGEMENT MARKET, BY REGION, 2021–2025 (USD MILLION)
TABLE 41
COMPLIANCE & SAFETY: ENTERPRISE ASSET MANAGEMENT MARKET, BY REGION, 2026–2031 (USD MILLION)
TABLE 42
REPORT & ANALYTICS: ENTERPRISE ASSET MANAGEMENT MARKET, BY REGION, 2021–2025 (USD MILLION)
TABLE 43
REPORT & ANALYTICS: ENTERPRISE ASSET MANAGEMENT MARKET, BY REGION, 2026–2031 (USD MILLION)
TABLE 44
OTHER APPLICATIONS: ENTERPRISE ASSET MANAGEMENT MARKET, BY REGION, 2021–2025 (USD MILLION)
TABLE 45
OTHER APPLICATIONS: ENTERPRISE ASSET MANAGEMENT MARKET, BY REGION, 2026–2031 (USD MILLION)
TABLE 46
ENTERPRISE ASSET MANAGEMENT MARKET, BY DEPLOYMENT TYPE, 2021–2025 (USD MILLION)
TABLE 47
ENTERPRISE ASSET MANAGEMENT MARKET, BY DEPLOYMENT TYPE, 2026–2031 (USD MILLION)
TABLE 48
CLOUD: ENTERPRISE ASSET MANAGEMENT MARKET, BY REGION, 2021–2025 (USD MILLION)
TABLE 49
CLOUD: ENTERPRISE ASSET MANAGEMENT MARKET, BY REGION, 2026–2031 (USD MILLION)
TABLE 50
ON-PREMISES: ENTERPRISE ASSET MANAGEMENT MARKET, BY REGION, 2021–2025 (USD MILLION)
TABLE 51
ON-PREMISES: ENTERPRISE ASSET MANAGEMENT MARKET, BY REGION, 2026–2031 (USD MILLION)
TABLE 52
ENTERPRISE ASSET MANAGEMENT MARKET, BY ASSET CLASS, 2021–2025 (USD MILLION)
TABLE 53
ENTERPRISE ASSET MANAGEMENT MARKET, BY ASSET CLASS, 2026–2031 (USD MILLION)
TABLE 54
LINEAR ASSETS: ENTERPRISE ASSET MANAGEMENT MARKET, BY REGION, 2021–2025 (USD MILLION)
TABLE 55
LINEAR ASSETS: ENTERPRISE ASSET MANAGEMENT MARKET, BY REGION, 2026–2031 (USD MILLION)
TABLE 56
PRODUCTION EQUIPMENT: ENTERPRISE ASSET MANAGEMENT MARKET, BY REGION, 2021–2025 (USD MILLION)
TABLE 57
PRODUCTION EQUIPMENT: ENTERPRISE ASSET MANAGEMENT MARKET, BY REGION, 2026–2031 (USD MILLION)
TABLE 58
FLEET & MOBILE ASSETS: ENTERPRISE ASSET MANAGEMENT MARKET, BY REGION, 2021–2025 (USD MILLION)
TABLE 59
FLEET & MOBILE ASSETS: ENTERPRISE ASSET MANAGEMENT MARKET, BY REGION, 2026–2031 (USD MILLION)
TABLE 60
FIXED/FACILITY ASSETS/INFRASTRUCTURE: ENTERPRISE ASSET MANAGEMENT MARKET, BY REGION, 2021–2025 (USD MILLION)
TABLE 61
FIXED/FACILITY ASSETS/INFRASTRUCTURE: ENTERPRISE ASSET MANAGEMENT MARKET, BY REGION, 2026–2031 (USD MILLION)
TABLE 62
OTHER ASSET CLASSES: ENTERPRISE ASSET MANAGEMENT MARKET, BY REGION, 2021–2025 (USD MILLION)
TABLE 63
OTHER ASSET CLASSES: ENTERPRISE ASSET MANAGEMENT MARKET, BY REGION, 2026–2031 (USD MILLION)
TABLE 64
ENTERPRISE ASSET MANAGEMENT MARKET, BY ORGANIZATION SIZE, 2021–2025 (USD MILLION)
TABLE 65
ENTERPRISE ASSET MANAGEMENT MARKET, BY ORGANIZATION SIZE, 2026–2031 (USD MILLION)
TABLE 66
LARGE ENTERPRISES: ENTERPRISE ASSET MANAGEMENT MARKET, BY REGION, 2021–2025 (USD MILLION)
TABLE 67
LARGE ENTERPRISES: ENTERPRISE ASSET MANAGEMENT MARKET, BY REGION, 2026–2031 (USD MILLION)
TABLE 68
SMALL & MEDIUM-SIZED ENTERPRISES: ENTERPRISE ASSET MANAGEMENT MARKET, BY REGION, 2021–2025 (USD MILLION)
TABLE 69
SMALL & MEDIUM-SIZED ENTERPRISES: ENTERPRISE ASSET MANAGEMENT MARKET, BY REGION, 2026–2031 (USD MILLION)
TABLE 70
ENTERPRISE ASSET MANAGEMENT MARKET, BY VERTICAL, 2021–2025 (USD MILLION)
TABLE 71
ENTERPRISE ASSET MANAGEMENT MARKET, BY VERTICAL, 2026–2031 (USD MILLION)
TABLE 72
MANUFACTURING: ENTERPRISE ASSET MANAGEMENT MARKET, BY REGION, 2021–2025 (USD MILLION)
TABLE 73
MANUFACTURING: ENTERPRISE ASSET MANAGEMENT MARKET, BY REGION, 2026–2031 (USD MILLION)
TABLE 74
ENERGY & UTILITIES: ENTERPRISE ASSET MANAGEMENT MARKET, BY REGION, 2021–2025 (USD MILLION)
TABLE 75
ENERGY & UTILITIES: ENTERPRISE ASSET MANAGEMENT MARKET, BY REGION, 2026–2031 (USD MILLION)
TABLE 76
OIL & GAS: ENTERPRISE ASSET MANAGEMENT MARKET, BY REGION, 2021–2025 (USD MILLION)
TABLE 77
OIL & GAS: ENTERPRISE ASSET MANAGEMENT MARKET, BY REGION, 2026–2031 (USD MILLION)
TABLE 78
TRANSPORTATION & LOGISTICS: ENTERPRISE ASSET MANAGEMENT MARKET, BY REGION, 2021–2025 (USD MILLION)
TABLE 79
TRANSPORTATION & LOGISTICS: ENTERPRISE ASSET MANAGEMENT MARKET, BY REGION, 2026–2031 (USD MILLION)
TABLE 80
HEALTHCARE & LIFE SCIENCES: ENTERPRISE ASSET MANAGEMENT MARKET, BY REGION, 2021–2025 (USD MILLION)
TABLE 81
HEALTHCARE & LIFE SCIENCES: ENTERPRISE ASSET MANAGEMENT MARKET, BY REGION, 2026–2031 (USD MILLION)
TABLE 82
GOVERNMENT & PUBLIC SECTOR: ENTERPRISE ASSET MANAGEMENT MARKET, BY REGION, 2021–2025 (USD MILLION)
TABLE 83
GOVERNMENT & PUBLIC SECTOR: ENTERPRISE ASSET MANAGEMENT MARKET, BY REGION, 2026–2031 (USD MILLION)
TABLE 84
OTHER VERTICALS: ENTERPRISE ASSET MANAGEMENT MARKET, BY REGION, 2021–2025 (USD MILLION)
TABLE 85
OTHER VERTICALS: ENTERPRISE ASSET MANAGEMENT MARKET, BY REGION, 2026–2031 (USD MILLION)
TABLE 86
ENTERPRISE ASSET MANAGEMENT MARKET, BY REGION, 2021–2025 (USD MILLION)
TABLE 87
ENTERPRISE ASSET MANAGEMENT MARKET, BY REGION, 2026–2031 (USD MILLION)
TABLE 88
NORTH AMERICA: ENTERPRISE ASSET MANAGEMENT MARKET, BY OFFERING, 2021–2025 (USD MILLION)
TABLE 89
NORTH AMERICA: ENTERPRISE ASSET MANAGEMENT MARKET, BY OFFERING, 2026–2031 (USD MILLION)
TABLE 90
NORTH AMERICA: ENTERPRISE ASSET MANAGEMENT SERVICES MARKET, BY SERVICE, 2021–2025 (USD MILLION)
TABLE 91
NORTH AMERICA: ENTERPRISE ASSET MANAGEMENT SERVICES MARKET, BY SERVICE, 2026–2031 (USD MILLION)
TABLE 92
NORTH AMERICA: ENTERPRISE ASSET MANAGEMENT MARKET, BY APPLICATION, 2021–2025 (USD MILLION)
TABLE 93
NORTH AMERICA: ENTERPRISE ASSET MANAGEMENT MARKET, BY APPLICATION, 2026–2031 (USD MILLION)
TABLE 94
NORTH AMERICA: ENTERPRISE ASSET MANAGEMENT MARKET, BY DEPLOYMENT TYPE, 2021–2025 (USD MILLION)
TABLE 95
NORTH AMERICA: ENTERPRISE ASSET MANAGEMENT MARKET, BY DEPLOYMENT TYPE, 2026–2031 (USD MILLION)
TABLE 96
NORTH AMERICA: ENTERPRISE ASSET MANAGEMENT MARKET, BY ASSET CLASS, 2021–2025 (USD MILLION)
TABLE 97
NORTH AMERICA: ENTERPRISE ASSET MANAGEMENT MARKET, BY ASSET CLASS, 2026–2031 (USD MILLION)
TABLE 98
NORTH AMERICA: ENTERPRISE ASSET MANAGEMENT MARKET, BY ORGANIZATION SIZE, 2021–2025 (USD MILLION)
TABLE 99
NORTH AMERICA: ENTERPRISE ASSET MANAGEMENT MARKET, BY ORGANIZATION SIZE, 2026–2031 (USD MILLION)
TABLE 100
NORTH AMERICA: ENTERPRISE ASSET MANAGEMENT MARKET, BY VERTICAL, 2021–2025 (USD MILLION)
TABLE 101
NORTH AMERICA: ENTERPRISE ASSET MANAGEMENT MARKET, BY VERTICAL, 2026–2031 (USD MILLION)
TABLE 102
NORTH AMERICA: ENTERPRISE ASSET MANAGEMENT MARKET, BY COUNTRY, 2021–2025 (USD MILLION)
TABLE 103
NORTH AMERICA: ENTERPRISE ASSET MANAGEMENT MARKET, BY COUNTRY, 2026–2031 (USD MILLION)
TABLE 104
US: ENTERPRISE ASSET MANAGEMENT MARKET, BY OFFERING, 2021–2025 (USD MILLION)
TABLE 105
US: ENTERPRISE ASSET MANAGEMENT MARKET, BY OFFERING, 2026–2031 (USD MILLION)
TABLE 106
CANADA: ENTERPRISE ASSET MANAGEMENT MARKET, BY OFFERING, 2021–2025 (USD MILLION)
TABLE 107
CANADA: ENTERPRISE ASSET MANAGEMENT MARKET, BY OFFERING, 2026–2031 (USD MILLION)
TABLE 108
EUROPE: ENTERPRISE ASSET MANAGEMENT MARKET, BY OFFERING, 2021–2025 (USD MILLION)
TABLE 109
EUROPE: ENTERPRISE ASSET MANAGEMENT MARKET, BY OFFERING, 2026–2031 (USD MILLION)
TABLE 110
EUROPE: ENTERPRISE ASSET MANAGEMENT SERVICES MARKET, BY SERVICE, 2021–2025 (USD MILLION)
TABLE 111
EUROPE: ENTERPRISE ASSET MANAGEMENT SERVICES MARKET, BY SERVICE, 2026–2031 (USD MILLION)
TABLE 112
EUROPE: ENTERPRISE ASSET MANAGEMENT MARKET, BY APPLICATION, 2021–2025 (USD MILLION)
TABLE 113
EUROPE: ENTERPRISE ASSET MANAGEMENT MARKET, BY APPLICATION, 2026–2031 (USD MILLION)
TABLE 114
EUROPE: ENTERPRISE ASSET MANAGEMENT MARKET, BY DEPLOYMENT TYPE, 2021–2025 (USD MILLION)
TABLE 115
EUROPE: ENTERPRISE ASSET MANAGEMENT MARKET, BY DEPLOYMENT TYPE, 2026–2031 (USD MILLION)
TABLE 116
EUROPE: ENTERPRISE ASSET MANAGEMENT MARKET, BY ASSET CLASS, 2021–2025 (USD MILLION)
TABLE 117
EUROPE: ENTERPRISE ASSET MANAGEMENT MARKET, BY ASSET CLASS, 2026–2031 (USD MILLION)
TABLE 118
EUROPE: ENTERPRISE ASSET MANAGEMENT MARKET, BY ORGANIZATION SIZE, 2021–2025 (USD MILLION)
TABLE 119
EUROPE: ENTERPRISE ASSET MANAGEMENT MARKET, BY ORGANIZATION SIZE, 2026–2031 (USD MILLION)
TABLE 120
EUROPE: ENTERPRISE ASSET MANAGEMENT MARKET, BY VERTICAL, 2021–2025 (USD MILLION)
TABLE 121
EUROPE: ENTERPRISE ASSET MANAGEMENT MARKET, BY VERTICAL, 2026–2031 (USD MILLION)
TABLE 122
EUROPE: ENTERPRISE ASSET MANAGEMENT MARKET, BY COUNTRY, 2021–2025 (USD MILLION)
TABLE 123
EUROPE: ENTERPRISE ASSET MANAGEMENT MARKET, BY COUNTRY, 2026–2031 (USD MILLION)
TABLE 124
UK: ENTERPRISE ASSET MANAGEMENT MARKET, BY OFFERING, 2021–2025 (USD MILLION)
TABLE 125
UK: ENTERPRISE ASSET MANAGEMENT MARKET, BY OFFERING, 2026–2031 (USD MILLION)
TABLE 126
GERMANY: ENTERPRISE ASSET MANAGEMENT MARKET, BY OFFERING, 2021–2025 (USD MILLION)
TABLE 127
GERMANY: ENTERPRISE ASSET MANAGEMENT MARKET, BY OFFERING, 2026–2031 (USD MILLION)
TABLE 128
FRANCE: ENTERPRISE ASSET MANAGEMENT MARKET, BY OFFERING, 2021–2025 (USD MILLION)
TABLE 129
FRANCE: ENTERPRISE ASSET MANAGEMENT MARKET, BY OFFERING, 2026–2031 (USD MILLION)
TABLE 130
ITALY: ENTERPRISE ASSET MANAGEMENT MARKET, BY OFFERING, 2021–2025 (USD MILLION)
TABLE 131
ITALY: ENTERPRISE ASSET MANAGEMENT MARKET, BY OFFERING, 2026–2031 (USD MILLION)
TABLE 132
REST OF EUROPE: ENTERPRISE ASSET MANAGEMENT MARKET, BY OFFERING, 2021–2025 (USD MILLION)
TABLE 133
REST OF EUROPE: ENTERPRISE ASSET MANAGEMENT MARKET, BY OFFERING, 2026–2031 (USD MILLION)
TABLE 134
ASIA PACIFIC: ENTERPRISE ASSET MANAGEMENT MARKET, BY OFFERING, 2021–2025 (USD MILLION)
TABLE 135
ASIA PACIFIC: ENTERPRISE ASSET MANAGEMENT MARKET, BY OFFERING, 2026–2031 (USD MILLION)
TABLE 136
ASIA PACIFIC: ENTERPRISE ASSET MANAGEMENT SERVICES MARKET, BY SERVICE, 2021–2025 (USD MILLION)
TABLE 137
ASIA PACIFIC: ENTERPRISE ASSET MANAGEMENT SERVICES MARKET, BY SERVICE, 2026–2031 (USD MILLION)
TABLE 138
ASIA PACIFIC: ENTERPRISE ASSET MANAGEMENT MARKET, BY APPLICATION, 2021–2025 (USD MILLION)
TABLE 139
ASIA PACIFIC: ENTERPRISE ASSET MANAGEMENT MARKET, BY APPLICATION, 2026–2031 (USD MILLION)
TABLE 140
ASIA PACIFIC: ENTERPRISE ASSET MANAGEMENT MARKET, BY DEPLOYMENT TYPE, 2021–2025 (USD MILLION)
TABLE 141
ASIA PACIFIC: ENTERPRISE ASSET MANAGEMENT MARKET, BY DEPLOYMENT TYPE, 2026–2031 (USD MILLION)
TABLE 142
ASIA PACIFIC: ENTERPRISE ASSET MANAGEMENT MARKET, BY ASSET CLASS, 2021–2025 (USD MILLION)
TABLE 143
ASIA PACIFIC: ENTERPRISE ASSET MANAGEMENT MARKET, BY ASSET CLASS, 2026–2031 (USD MILLION)
TABLE 144
ASIA PACIFIC: ENTERPRISE ASSET MANAGEMENT MARKET, BY ORGANIZATION SIZE, 2021–2025 (USD MILLION)
TABLE 145
ASIA PACIFIC: ENTERPRISE ASSET MANAGEMENT MARKET, BY ORGANIZATION SIZE, 2026–2031 (USD MILLION)
TABLE 146
ASIA PACIFIC: ENTERPRISE ASSET MANAGEMENT MARKET, BY VERTICAL, 2021–2025 (USD MILLION)
TABLE 147
ASIA PACIFIC: ENTERPRISE ASSET MANAGEMENT MARKET, BY VERTICAL, 2026–2031 (USD MILLION)
TABLE 148
ASIA PACIFIC: ENTERPRISE ASSET MANAGEMENT MARKET, BY COUNTRY, 2021–2025 (USD MILLION)
TABLE 149
ASIA PACIFIC: ENTERPRISE ASSET MANAGEMENT MARKET, BY COUNTRY, 2026–2031 (USD MILLION)
TABLE 150
CHINA: ENTERPRISE ASSET MANAGEMENT MARKET, BY OFFERING, 2021–2025 (USD MILLION)
TABLE 151
CHINA: ENTERPRISE ASSET MANAGEMENT MARKET, BY OFFERING, 2026–2031 (USD MILLION)
TABLE 152
JAPAN: ENTERPRISE ASSET MANAGEMENT MARKET, BY OFFERING, 2021–2025 (USD MILLION)
TABLE 153
JAPAN: ENTERPRISE ASSET MANAGEMENT MARKET, BY OFFERING, 2026–2031 (USD MILLION)
TABLE 154
AUSTRALIA & NEW ZEALAND: ENTERPRISE ASSET MANAGEMENT MARKET, BY OFFERING, 2021–2025 (USD MILLION)
TABLE 155
AUSTRALIA & NEW ZEALAND: ENTERPRISE ASSET MANAGEMENT MARKET, BY OFFERING, 2026–2031 (USD MILLION)
TABLE 156
REST OF ASIA PACIFIC: ENTERPRISE ASSET MANAGEMENT MARKET, BY OFFERING, 2021–2025 (USD MILLION)
TABLE 157
REST OF ASIA PACIFIC: ENTERPRISE ASSET MANAGEMENT MARKET, BY OFFERING, 2026–2031 (USD MILLION)
TABLE 158
MIDDLE EAST & AFRICA: ENTERPRISE ASSET MANAGEMENT MARKET, BY OFFERING, 2021–2025 (USD MILLION)
TABLE 159
MIDDLE EAST & AFRICA: ENTERPRISE ASSET MANAGEMENT MARKET, BY OFFERING, 2026–2031 (USD MILLION)
TABLE 160
MIDDLE EAST & AFRICA: ENTERPRISE ASSET MANAGEMENT SERVICES MARKET, BY SERVICE, 2021–2025 (USD MILLION)
TABLE 161
MIDDLE EAST & AFRICA: ENTERPRISE ASSET MANAGEMENT SERVICES MARKET, BY SERVICE, 2026–2031 (USD MILLION)
TABLE 162
MIDDLE EAST & AFRICA: ENTERPRISE ASSET MANAGEMENT MARKET, BY APPLICATION, 2021–2025 (USD MILLION)
TABLE 163
MIDDLE EAST & AFRICA: ENTERPRISE ASSET MANAGEMENT MARKET, BY APPLICATION, 2026–2031 (USD MILLION)
TABLE 164
MIDDLE EAST & AFRICA: ENTERPRISE ASSET MANAGEMENT MARKET, BY DEPLOYMENT TYPE, 2021–2025 (USD MILLION)
TABLE 165
MIDDLE EAST & AFRICA: ENTERPRISE ASSET MANAGEMENT MARKET, BY DEPLOYMENT TYPE, 2026–2031 (USD MILLION)
TABLE 166
MIDDLE EAST & AFRICA: ENTERPRISE ASSET MANAGEMENT MARKET, BY ASSET CLASS, 2021–2025 (USD MILLION)
TABLE 167
MIDDLE EAST & AFRICA: ENTERPRISE ASSET MANAGEMENT MARKET, BY ASSET CLASS, 2026–2031 (USD MILLION)
TABLE 168
MIDDLE EAST & AFRICA: ENTERPRISE ASSET MANAGEMENT MARKET, BY ORGANIZATION SIZE, 2021–2025 (USD MILLION)
TABLE 169
MIDDLE EAST & AFRICA: ENTERPRISE ASSET MANAGEMENT MARKET, BY ORGANIZATION SIZE, 2026–2031 (USD MILLION)
TABLE 170
MIDDLE EAST & AFRICA: ENTERPRISE ASSET MANAGEMENT MARKET, BY VERTICAL, 2021–2025 (USD MILLION)
TABLE 171
MIDDLE EAST & AFRICA: ENTERPRISE ASSET MANAGEMENT MARKET, BY VERTICAL, 2026–2031 (USD MILLION)
TABLE 172
MIDDLE EAST & AFRICA: ENTERPRISE ASSET MANAGEMENT MARKET, BY COUNTRY, 2021–2025 (USD MILLION)
TABLE 173
MIDDLE EAST & AFRICA: ENTERPRISE ASSET MANAGEMENT MARKET, BY COUNTRY, 2026–2031 (USD MILLION)
TABLE 174
GCC COUNTRIES: ENTERPRISE ASSET MANAGEMENT MARKET, BY COUNTRY, 2021–2025 (USD MILLION)
TABLE 175
GCC COUNTRIES: ENTERPRISE ASSET MANAGEMENT MARKET, BY COUNTRY, 2026–2031 (USD MILLION)
TABLE 176
GCC COUNTRIES: ENTERPRISE ASSET MANAGEMENT MARKET, BY OFFERING, 2021–2025 (USD MILLION)
TABLE 177
GCC COUNTRIES: ENTERPRISE ASSET MANAGEMENT MARKET, BY OFFERING, 2026–2031 (USD MILLION)
TABLE 178
UAE: ENTERPRISE ASSET MANAGEMENT MARKET, BY OFFERING, 2021–2025 (USD MILLION)
TABLE 179
UAE: ENTERPRISE ASSET MANAGEMENT MARKET, BY OFFERING, 2026–2031 (USD MILLION)
TABLE 180
SAUDI ARABIA: ENTERPRISE ASSET MANAGEMENT MARKET, BY OFFERING, 2021–2025 (USD MILLION)
TABLE 181
SAUDI ARABIA: ENTERPRISE ASSET MANAGEMENT MARKET, BY OFFERING, 2026–2031 (USD MILLION)
TABLE 182
REST OF GCC COUNTRIES: ENTERPRISE ASSET MANAGEMENT MARKET, BY OFFERING, 2021–2025 (USD MILLION)
TABLE 183
REST OF GCC COUNTRIES: ENTERPRISE ASSET MANAGEMENT MARKET, BY OFFERING, 2026–2031 (USD MILLION)
TABLE 184
SOUTH AFRICA: ENTERPRISE ASSET MANAGEMENT MARKET, BY OFFERING, 2021–2025 (USD MILLION)
TABLE 185
SOUTH AFRICA: ENTERPRISE ASSET MANAGEMENT MARKET, BY OFFERING, 2026–2031 (USD MILLION)
TABLE 186
REST OF MIDDLE EAST & AFRICA: ENTERPRISE ASSET MANAGEMENT MARKET, BY OFFERING, 2021–2025 (USD MILLION)
TABLE 187
REST OF MIDDLE EAST & AFRICA: ENTERPRISE ASSET MANAGEMENT MARKET, BY OFFERING, 2026–2031 (USD MILLION)
TABLE 188
LATIN AMERICA: ENTERPRISE ASSET MANAGEMENT MARKET, BY OFFERING, 2021–2025 (USD MILLION)
TABLE 189
LATIN AMERICA: ENTERPRISE ASSET MANAGEMENT MARKET, BY OFFERING, 2026–2031 (USD MILLION)
TABLE 190
LATIN AMERICA: ENTERPRISE ASSET MANAGEMENT SERVICES MARKET, BY SERVICE, 2021–2025 (USD MILLION)
TABLE 191
LATIN AMERICA: ENTERPRISE ASSET MANAGEMENT SERVICES MARKET, BY SERVICE, 2026–2031 (USD MILLION)
TABLE 192
LATIN AMERICA: ENTERPRISE ASSET MANAGEMENT MARKET, BY APPLICATION, 2021–2025 (USD MILLION)
TABLE 193
LATIN AMERICA: ENTERPRISE ASSET MANAGEMENT MARKET, BY APPLICATION, 2026–2031 (USD MILLION)
TABLE 194
LATIN AMERICA: ENTERPRISE ASSET MANAGEMENT MARKET, BY DEPLOYMENT TYPE, 2021–2025 (USD MILLION)
TABLE 195
LATIN AMERICA: ENTERPRISE ASSET MANAGEMENT MARKET, BY DEPLOYMENT TYPE, 2026–2031 (USD MILLION)
TABLE 196
LATIN AMERICA: ENTERPRISE ASSET MANAGEMENT MARKET, BY ASSET CLASS, 2021–2025 (USD MILLION)
TABLE 197
LATIN AMERICA: ENTERPRISE ASSET MANAGEMENT MARKET, BY ASSET CLASS, 2026–2031 (USD MILLION)
TABLE 198
LATIN AMERICA: ENTERPRISE ASSET MANAGEMENT MARKET, BY ORGANIZATION SIZE, 2021–2025 (USD MILLION)
TABLE 199
LATIN AMERICA: ENTERPRISE ASSET MANAGEMENT MARKET, BY ORGANIZATION SIZE, 2026–2031 (USD MILLION)
TABLE 200
LATIN AMERICA: ENTERPRISE ASSET MANAGEMENT MARKET, BY VERTICAL, 2021–2025 (USD MILLION)
TABLE 201
LATIN AMERICA: ENTERPRISE ASSET MANAGEMENT MARKET, BY VERTICAL, 2026–2031 (USD MILLION)
TABLE 202
LATIN AMERICA: ENTERPRISE ASSET MANAGEMENT MARKET, BY COUNTRY, 2021–2025 (USD MILLION)
TABLE 203
LATIN AMERICA: ENTERPRISE ASSET MANAGEMENT MARKET, BY COUNTRY, 2026–2031 (USD MILLION)
TABLE 204
BRAZIL: ENTERPRISE ASSET MANAGEMENT MARKET, BY OFFERING, 2021–2025 (USD MILLION)
TABLE 205
BRAZIL: ENTERPRISE ASSET MANAGEMENT MARKET, BY OFFERING, 2026–2031 (USD MILLION)
TABLE 206
MEXICO: ENTERPRISE ASSET MANAGEMENT MARKET, BY OFFERING, 2021–2025 (USD MILLION)
TABLE 207
MEXICO: ENTERPRISE ASSET MANAGEMENT MARKET, BY OFFERING, 2026–2031 (USD MILLION)
TABLE 208
REST OF LATIN AMERICA: ENTERPRISE ASSET MANAGEMENT MARKET, BY OFFERING, 2021–2025 (USD MILLION)
TABLE 209
REST OF LATIN AMERICA: ENTERPRISE ASSET MANAGEMENT MARKET, BY OFFERING, 2026–2031 (USD MILLION)
TABLE 210
ENTERPRISE ASSET MANAGEMENT MARKET: OVERVIEW OF STRATEGIES ADOPTED BY KEY PLAYERS, 2024–2026
TABLE 211
ENTERPRISE ASSET MANAGEMENT MARKET: DEGREE OF COMPARISON
TABLE 212
ENTERPRISE ASSET MANAGEMENT MARKET: REGIONAL FOOTPRINT, 2026
TABLE 213
ENTERPRISE ASSET MANAGEMENT MARKET: VERTICAL FOOTPRINT, 2026
TABLE 214
ENTERPRISE ASSET MANAGEMENT MARKET: ASSET CLASS FOOTPRINT, 2026
TABLE 215
ENTERPRISE ASSET MANAGEMENT MARKET: LIST OF KEY STARTUPS/SMES, 2026
TABLE 216
ENTERPRISE ASSET MANAGEMENT MARKET: COMPETITIVE BENCHMARKING OF KEY STARTUPS/SMES, 2026
TABLE 217
ENTERPRISE ASSET MANAGEMENT MARKET: PRODUCT LAUNCHES/ENHANCEMENTS, JUNE 2024–SEPTEMBER 2026
TABLE 218
ENTERPRISE ASSET MANAGEMENT MARKET: DEALS, JUNE 2024–AUGUST 2026
TABLE 219
IBM: COMPANY OVERVIEW
TABLE 220
IBM: PRODUCTS/SOLUTIONS/SERVICES OFFERED
TABLE 221
IBM: PRODUCT LAUNCHES/ENHANCEMENTS
TABLE 222
IBM: DEALS
TABLE 223
IFS: COMPANY OVERVIEW
TABLE 224
IFS: PRODUCTS/SOLUTIONS/SERVICES OFFERED
TABLE 225
IFS: PRODUCT LAUNCHES/ENHANCEMENTS
TABLE 226
IFS: DEALS
TABLE 227
SAP: COMPANY OVERVIEW
TABLE 228
SAP: PRODUCTS/SOLUTIONS/SERVICES OFFERED
TABLE 229
SAP: PRODUCT LAUNCHES/ENHANCEMENTS
TABLE 230
SAP: DEALS
TABLE 231
HITACHI ENERGY: COMPANY OVERVIEW
TABLE 232
HITACHI ENERGY: PRODUCTS/SOLUTIONS/SERVICES OFFERED
TABLE 233
HITACHI ENERGY: PRODUCT LAUNCHES/ENHANCEMENTS
TABLE 234
HITACHI ENERGY: DEALS
TABLE 235
SERVICENOW: COMPANY OVERVIEW
TABLE 236
SERVICENOW: PRODUCTS/SOLUTIONS/SERVICES OFFERED
TABLE 237
SERVICENOW: PRODUCT LAUNCHES/ENHANCEMENTS
TABLE 238
SERVICENOW: DEALS
TABLE 239
OCTAVE INTELLIGENCE: COMPANY OVERVIEW
TABLE 240
OCTAVE INTELLIGENCE: PRODUCTS/SOLUTIONS/SERVICES OFFERED
TABLE 241
OCTAVE INTELLIGENCE: DEALS
TABLE 242
SIEMENS: COMPANY OVERVIEW
TABLE 243
SIEMENS: PRODUCTS/SOLUTIONS/SERVICES OFFERED
TABLE 244
SIEMENS: PRODUCT LAUNCHES/ENHANCEMENTS
TABLE 245
SIEMENS: DEALS
TABLE 246
TRIMBLE: COMPANY OVERVIEW
TABLE 247
TRIMBLE: PRODUCTS/SOLUTIONS/SERVICES OFFERED
TABLE 248
TRIMBLE: PRODUCT LAUNCHES/ENHANCEMENTS
TABLE 249
TRIMBLE: DEALS
TABLE 250
ORACLE: COMPANY OVERVIEW
TABLE 251
ORACLE: PRODUCTS/SOLUTIONS/SERVICES OFFERED
TABLE 252
ORACLE: PRODUCT LAUNCHES/ENHANCEMENTS
TABLE 253
ORACLE: DEALS
TABLE 254
CGI: COMPANY OVERVIEW
TABLE 255
CGI: PRODUCTS/SOLUTIONS/SERVICES OFFERED
TABLE 256
FACTOR ANALYSIS
LIST OF FIGURES
FIGURE 1
ENTERPRISE ASSET MANAGEMENT MARKET SEGMENTATION AND REGIONAL SCOPE
FIGURE 2
MARKET SCENARIO
FIGURE 3
ENTERPRISE ASSET MANAGEMENT MARKET, 2021–2031
FIGURE 4
MAJOR STRATEGIES ADOPTED BY KEY PLAYERS IN ENTERPRISE ASSET MANAGEMENT MARKET (2024–2026)
FIGURE 5
DISRUPTIONS INFLUENCING GROWTH OF ENTERPRISE ASSET MANAGEMENT MARKET
FIGURE 6
HIGH-GROWTH SEGMENTS IN ENTERPRISE ASSET MANAGEMENT MARKET, 2026-2031
FIGURE 7
ASIA PACIFIC TO REGISTER HIGHEST CAGR DURING FORECAST PERIOD
FIGURE 8
RISING ASSET COMPLEXITY AND NEED FOR INTELLIGENT MAINTENANCE TO DRIVE ENTERPRISE ASSET MANAGEMENT MARKET
FIGURE 9
SOLUTIONS SEGMENT TO DOMINATE MARKET
FIGURE 10
LINEAR ASSETS TO ACCOUNT FOR LARGEST MARKET SHARE
FIGURE 11
OPERATIONS MANAGEMENT TO ACCOUNT FOR LARGEST MARKET SHARE
FIGURE 12
LARGE ENTERPRISES TO ACCOUNT FOR LARGER MARKET SHARE
FIGURE 13
CLOUD SEGMENT TO LEAD MARKET
FIGURE 14
MANUFACTURING SEGMENT TO ACCOUNT FOR LARGEST MARKET SHARE
FIGURE 15
ASIA PACIFIC TO EMERGE AS MOST SIGNIFICANT MARKET IN NEXT FIVE YEARS
FIGURE 16
ENTERPRISE ASSET MANAGEMENT MARKET: DRIVERS, RESTRAINTS, OPPORTUNITIES, AND CHALLENGES
FIGURE 17
ENTERPRISE ASSET MANAGEMENT MARKET: PORTER’S FIVE FORCES ANALYSIS
FIGURE 18
ENTERPRISE ASSET MANAGEMENT MARKET: VALUE CHAIN ANALYSIS
FIGURE 19
ENTERPRISE ASSET MANAGEMENT MARKET: ECOSYSTEM ANALYSIS
FIGURE 20
AVERAGE SELLING PRICE OF EAM SOLUTIONS, BY REGION (2024–2026)
FIGURE 21
ENTERPRISE ASSET MANAGEMENT MARKET: TRENDS/DISRUPTIONS IMPACTING CUSTOMERS’ BUSINESSES
FIGURE 22
ENTERPRISE ASSET MANAGEMENT VENDORS: TOTAL FUNDING VALUE AND NUMBER OF FUNDING ROUNDS, 2026
FIGURE 23
ENTERPRISE ASSET MANAGEMENT MARKET: DECISION-MAKING FACTORS
FIGURE 24
INFLUENCE OF STAKEHOLDERS ON BUYING PROCESS FOR TOP THREE VERTICALS
FIGURE 25
KEY BUYING CRITERIA FOR TOP THREE VERTICALS
FIGURE 26
ADOPTION BARRIERS AND INTERNAL CHALLENGES
FIGURE 27
NUMBER OF PATENTS PUBLISHED, 2015–2025
FIGURE 28
FUTURE APPLICATIONS OF ENTERPRISE ASSET MANAGEMENT
FIGURE 29
SOLUTIONS SEGMENT TO DOMINATE MARKET DURING FORECAST PERIOD
FIGURE 30
OPERATIONS MANAGEMENT SEGMENT TO DOMINATE MARKET
FIGURE 31
CLOUD SEGMENT TO LEAD MARKET DURING FORECAST PERIOD
FIGURE 32
LINEAR ASSETS SEGMENT TO DOMINATE MARKET DURING FORECAST PERIOD
FIGURE 33
LARGE ENTERPRISES SEGMENT TO HOLD MAJOR MARKET SHARE
FIGURE 34
MANUFACTURING SEGMENT TO DOMINATE MARKET DURING FORECAST PERIOD
FIGURE 35
NORTH AMERICA TO ACCOUNT FOR LARGEST MARKET SHARE
FIGURE 36
NORTH AMERICA: MARKET SNAPSHOT
FIGURE 37
ASIA PACIFIC: MARKET SNAPSHOT
FIGURE 38
REVENUE ANALYSIS OF KEY VENDORS, 2021–2025 (USD MILLION)
FIGURE 39
ENTERPRISE ASSET MANAGEMENT MARKET: MARKET SHARE ANALYSIS, 2025
FIGURE 40
ENTERPRISE ASSET MANAGEMENT MARKET: COMPARISON OF VENDORS’ PRODUCTS
FIGURE 41
COMPANY EVALUATION MATRIX FOR KEY PLAYERS: CRITERIA WEIGHTAGE
FIGURE 42
ENTERPRISE ASSET MANAGEMENT MARKET: COMPANY EVALUATION MATRIX (KEY PLAYERS), 2026
FIGURE 43
ENTERPRISE ASSET MANAGEMENT MARKET: COMPANY FOOTPRINT, 2026
FIGURE 44
EVALUATION MATRIX FOR STARTUPS/SMES: CRITERIA WEIGHTAGE
FIGURE 45
ENTERPRISE ASSET MANAGEMENT MARKET: COMPANY EVALUATION MATRIX (STARTUPS/SMES), 2026
FIGURE 46
COMPANY VALUATION OF KEY VENDORS, 2026 (USD BILLION)
FIGURE 47
EV/EBITDA ANALYSIS OF KEY VENDORS, 2025
FIGURE 48
YEAR-TO-DATE (YTD) PRICE TOTAL RETURN AND 5-YEAR STOCK BETA OF KEY VENDORS
FIGURE 49
IBM: COMPANY SNAPSHOT
FIGURE 50
SAP: COMPANY SNAPSHOT
FIGURE 51
SERVICENOW: COMPANY SNAPSHOT
FIGURE 52
SIEMENS: COMPANY SNAPSHOT
FIGURE 53
TRIMBLE: COMPANY SNAPSHOT
FIGURE 54
ORACLE: COMPANY SNAPSHOT
FIGURE 55
CGI: COMPANY SNAPSHOT
FIGURE 56
ENTERPRISE ASSET MANAGEMENT MARKET: RESEARCH DESIGN
FIGURE 57
ENTERPRISE ASSET MANAGEMENT MARKET: TOP-DOWN AND BOTTOM-UP APPROACHES
FIGURE 58
MARKET SIZE ESTIMATION METHODOLOGY: SUPPLY-SIDE ANALYSIS
FIGURE 59
MARKET SIZE ESTIMATION METHODOLOGY - BOTTOM-UP APPROACH (SUPPLY SIDE): COLLECTIVE REVENUE OF ENTERPRISE ASSET MANAGEMENT VENDORS
FIGURE 60
MARKET SIZE ESTIMATION METHODOLOGY – APPROACH 2 (DEMAND SIDE): REVENUE GENERATED FROM OFFERINGS
FIGURE 61
MARKET SIZE ESTIMATION METHODOLOGY – APPROACH 2 (DEMAND SIDE): ENTERPRISE ASSET MANAGEMENT MARKET
FIGURE 62
ENTERPRISE ASSET MANAGEMENT MARKET: DATA TRIANGULATION
Methodology
This research study on the enterprise asset management market involved extensive secondary sources, including directories, IEEE Communication-Efficient: Algorithms and Systems, and the International Journal of Innovation and Technology Management, as well as paid databases. Primary sources were mainly industry experts from core and related industries, preferred enterprise asset management software providers, third-party service providers, consulting service providers, end users, and other commercial enterprises. In-depth interviews with primary respondents, including key industry participants and subject matter experts, were conducted to gather and verify critical qualitative and quantitative information, as well as assess the market’s prospects.
Secondary Research
In the secondary research process, various sources were referred to identify and collect information for this study. Secondary sources included annual reports, press releases, and investor presentations of companies; white papers, journals, and certified publications; and articles from recognized authors, directories, and databases. The data was also collected from other secondary sources, such as journals, government websites, blogs, and vendors’ websites. Additionally, the enterprise asset management spending of various countries was extracted from the respective sources.
Primary Research
In the primary research process, various sources from the supply and demand sides were interviewed to obtain qualitative and quantitative information on the market. The primary sources from the supply side included various industry experts, such as chief experience officers (CXOs), vice presidents (VPs), and directors specializing in business development, marketing, and enterprise asset management services. It also included key executives from enterprise asset management vendors, system integrators (SIs), professional service providers, industry associations, and other key opinion leaders.
Breakup of Primary Profiles:
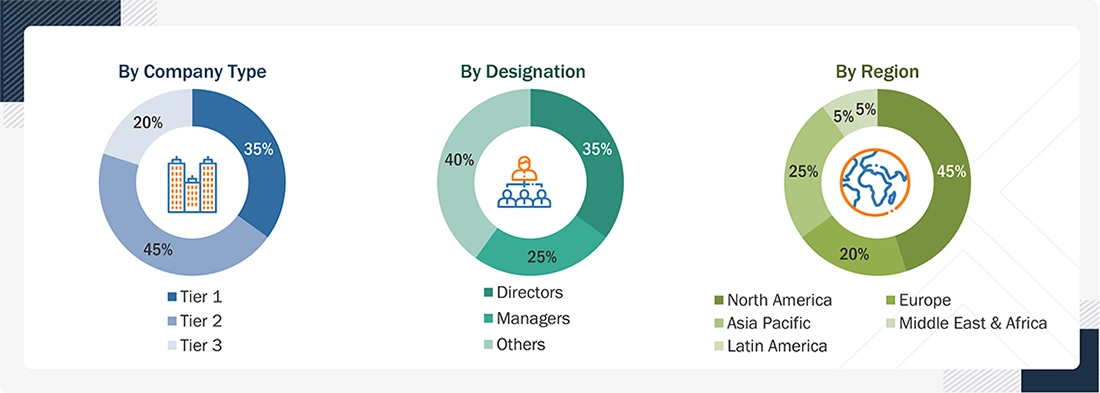
Note: Tier 1 companies’ revenues are more than USD 10 billion; tier 2 companies’ revenues range between USD 1 and 10 billion; and tier 3 companies’ revenues range between USD 500 million and USD 1 billion. Other designations include sales, marketing, and product managers.
Source: Industry Experts
To know about the assumptions considered for the study, download the pdf brochure
Market Size Estimation
Multiple approaches were adopted to estimate and forecast the enterprise asset management market. The first approach involved estimating the market size based on companies’ revenue from the sale of enterprise asset management products.
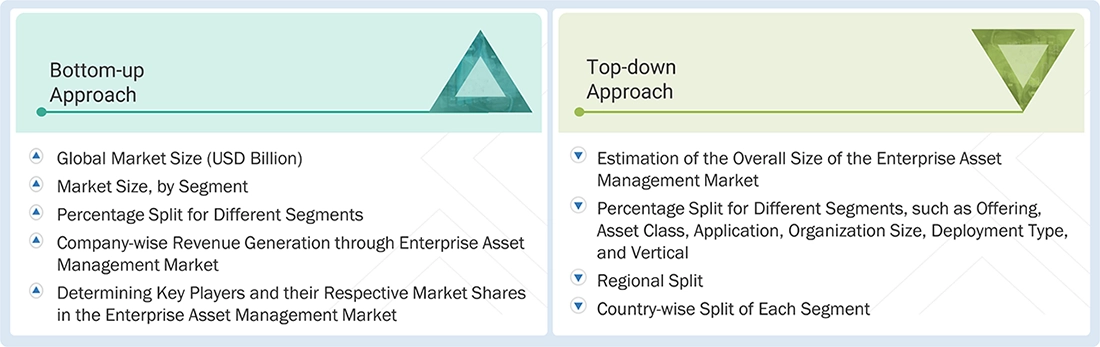
Market Size Estimation Methodology: Top-down Approach
The top-down approach prepared an exhaustive list of all the vendors offering products in the enterprise asset management market. The revenue contribution of the market vendors was estimated through annual reports, press releases, funding, investor presentations, paid databases, and primary interviews. Each vendor’s offerings were evaluated based on offering, platform module, technology, deployment mode, end user, and region. The markets were triangulated through primary and secondary research. The primary procedure included extensive interviews for key insights from industry leaders, such as CIOs, CEOs, VPs, directors, and marketing executives. The market numbers were further triangulated with the existing MarketsandMarkets repository for validation.
Market Size Estimation Methodology: Bottom-up Approach
The bottom-up approach identified the adoption rate of enterprise asset management products across different verticals in key countries, considering the regions that contribute the most to the market share. For cross-validation, the adoption of enterprise asset management products among enterprises and other use cases for their regions was identified and extrapolated. Use cases identified in different areas were weighed for the market size calculation.
Based on the market numbers, the regional split was determined by primary and secondary sources. The procedure included an analysis of the enterprise asset management market’s regional penetration. Based on secondary research, the regional spending on Information and Communications Technology (ICT), socioeconomic analysis of each country, strategic vendor analysis of major enterprise asset management service providers, and organic and inorganic business development activities of regional and global players were estimated.
Enterprise Asset Management Market : Top-Down and Bottom-Up Approach
Data Triangulation
After determining the overall market size using the market size estimation processes as explained above, the market was split into several segments and subsegments. Data triangulation and market breakup procedures were employed, wherever applicable, to complete the overall market engineering process and arrive at the exact statistics of each market segment and subsegment. The overall market size was then used in the top-down approach to estimate the size of other individual markets by applying percentage splits to the market segmentation.
Market Definition
The enterprise asset management market comprises software and services that enable organizations to systematically manage physical assets, including equipment, machinery, vehicles, infrastructure, and facilities, throughout their lifecycle. EAM solutions support asset planning, acquisition, operation, maintenance, performance optimization, and disposal, with capabilities designed to improve asset reliability, operational efficiency, safety, compliance, and lifecycle value.
Key Stakeholders
- Maintenance Managers
- Asset Managers
- Facility Managers
- Operations Managers
- Engineers (Mechanical, Electrical, and Civil)
- IT/Technology Teams
- Procurement Teams
- Safety & Compliance Officers
- Plant/Production Managers
- Service Technicians
- Inventory & Warehouse Managers
- Energy & Utilities Managers
- Project Managers
Report Objectives
- To define, describe, and forecast the enterprise asset management market based on offering (solutions and services), by application (asset lifecycle management, operation management, maintenance management, compliance & safety, reporting & analytics and other applications), by deployment type (cloud, on-premises), by asset class (linear asset, production equipment, fleet & mobility assets, fixed/facility assets/infrastructure, and others) by organization size (large enterprises, small and medium-sized enterprises), by vertical (manufacturing, energy & utilities, oil & gas, transportation & logistics, healthcare & life sciences, government & public sector, and other verticals)
- To provide detailed information on major factors influencing market growth (drivers, restraints, opportunities, and challenges) across enterprise asset management, asset lifecycle management, maintenance management, and aftermarket transformation
- To strategically analyze micro markets with respect to individual growth trends, adoption patterns, and their contribution to the overall enterprise asset management market
- To analyze market opportunities for stakeholders and present a comprehensive competitive landscape of leading enterprise asset management vendors, OEM aftermarket players, and service providers
- To project the market size and its submarkets in terms of value (USD million) across five key regions (North America, Europe, Asia Pacific, Middle East & Africa, Latin America), along with an analysis of their respective major countries
- To strategically profile leading companies and provide an in-depth evaluation of their core competencies, product portfolios, technology capabilities, and market positioning
- To examine competitive developments, including product launches, software upgrades, partnerships, integrations, strategic expansions, and mergers & acquisitions across the enterprise asset management ecosystem
Available customizations:
With the given market data, MarketsandMarkets offers customizations according to the company’s specific needs. The following customization options are available for the report:
Product Analysis
- The product matrix provides a detailed comparison of the product portfolio of each company.
Geographic Analysis based on feasibility
- Further breakup of the North American enterprise asset management market
- Further breakup of the European enterprise asset management market
- Further breakup of the Asia Pacific enterprise asset management market
- Further breakup of the Middle East & Africa enterprise asset management market
- Further breakup of the Latin American enterprise asset management market
Company Information
-
Detailed analysis and profiling of additional market players (up to five)
Key Questions Addressed by the Report
What is enterprise asset management?
Enterprise asset management (EAM) refers to the integrated software and processes used to manage the lifecycle of physical assets such as machinery, equipment, and infrastructure. It helps organizations optimize asset utilization, reduce downtime, and extend asset life.
What are the best strategies for EAM providers to optimize cloud-based solutions for scalability?
EAM providers should focus on developing cloud-based platforms with robust APIs, seamless integrations, and flexible architectures. This ensures scalability to handle growing asset portfolios, improves user adoption, and meets the demand for cost-effective, future-proof solutions across industries.
Which industries are the major adopters of EAM solutions?
Key industries adopting EAM include manufacturing, energy and utilities, transportation, healthcare, and government. These sectors rely heavily on asset-intensive operations where efficiency, safety, and compliance are critical.
What challenges do organizations face in implementing EAM?
Challenges include high upfront costs, complexity in integrating EAM with legacy systems, lack of skilled professionals, and organizational resistance to change. However, cloud-based solutions are helping reduce these barriers.
What steps can EAM providers take to reduce clients’ high upfront implementation costs?
Providers can offer subscription-based pricing, cloud-hosted solutions, and phased implementation plans. These strategies lower initial investment barriers, improve accessibility for SMEs, and drive wider market penetration.
Who are the key vendors in the enterprise asset management market?
The key vendors in the global enterprise asset management market include IBM, Oracle, SAP, Heaxgon, IFS, Aptean, Trimble, ServiceNow, Hitachi Energy, Ramco, Accruent, MaintainX, ABS Group, Central Square, KloudGin, Assetworks, Limble CMMS, Upkeep, Asset Panda, emaint, Asset Infinity, EZmaintain, Llumin, and IPS Intelligent Process Solutions.
Fact checked
Personalize This Research
- Triangulate with your Own Data
- Get Data as per your Format and Definition
- Gain a Deeper Dive on a Specific Application, Geography, Customer or Competitor
- Any level of Personalization
Let Us Help You
- What are the Known and Unknown Adjacencies Impacting the Enterprise Asset Management Market
- What will your New Revenue Sources be?
- Who will be your Top Customer; what will make them switch?
- Defend your Market Share or Win Competitors
- Get a Scorecard for Target Partners

Custom Market Research Services
We Will Customise The Research For You, In Case The Report Listed Above Does Not Meet With Your Requirements
Get 10% Free CustomisationTESTIMONIALS
- US Enterprise Asset Management Market
- Canada Enterprise Asset Management Market
- UK Enterprise Asset Management Market
- Germany Enterprise Asset Management Market
- France Enterprise Asset Management Market
- Italy Enterprise Asset Management Market
- China Enterprise Asset Management Market
- Japan Enterprise Asset Management Market
- UAE Enterprise Asset Management Market
- Saudi Arabia Enterprise Asset Management Market
- South Africa Enterprise Asset Management Market
- Brazil Enterprise Asset Management Market
- Mexico Enterprise Asset Management Market
- Rest Of Europe Enterprise Asset Management Market
- Rest Of Asia Pacific Enterprise Asset Management Market
- GCC Countries Enterprise Asset Management Market



Growth opportunities and latent adjacency in Enterprise Asset Management Market