
Italy 3D Mapping and Modeling Market (2026-2031)

The Italy 3D Mapping and Modeling Market was valued at $431.9 Million in 2026 and projected to reach to $595.2 Million by 2031, representing a compound annual growth rate of 6.6%. Italy's 3D mapping and modeling market is positioned for steady growth driven by increasing digitalization of urban infrastructure and construction sectors.


| Market Size in | USD 26.32 MN |
| Market Forecast in | |
| CAGR | |
| Forecast Period | |
| Units Considered | Value (USD MN) |
Italy 3D Mapping and Modeling Market Trends and Insights
- Italy is experiencing steady adoption of 3D mapping technologies across urban planning, construction, and digital infrastructure sectors.
- The market growth in Italy is driven by increasing investment in smart city initiatives and the modernization of public infrastructure across the country. During the forecast period from 2026 to 2031, Italy's 3D mapping and modeling market will benefit from rising demand in geospatial analytics and real estate development.
- Italy's position within the European market positions the country to leverage advanced mapping solutions for heritage preservation and environmental monitoring.
- The expansion reflects Italy's commitment to digital transformation and the integration of 3D technologies into both public and private sector operations..
Key Market Statistics
- CAGR (2026-2031) 6.6% CAGR
- Market Size, 2026 ~USD 431.9 Million
- Forecast, 2031 ~USD 595.2 Million
- Country Italy
Italy 3D Mapping and Modeling Market Overview
Market Size & Growth :
Italy's 3D mapping and modeling market is valued at USD 431.9 million in 2026, with projected growth to USD 595.2 million by 2031, representing a steady CAGR of 6.6%.
Key Application Sectors :
Urban planning, construction, and digital infrastructure are the primary drivers of 3D mapping adoption in Italy, with increasing government and private sector investments in smart city initiatives.
Technology Adoption Trends :
Italian enterprises are increasingly integrating 3D mapping technologies for infrastructure management, heritage preservation, and real estate development, supported by EU digital transformation directives.
Regional Growth Dynamics :
Italy's 6.6% CAGR reflects moderate but consistent market expansion, lagging the global 10.6% rate, indicating untapped opportunities in emerging applications and regional digitalization.
Italy 3D Mapping and Modeling Market Dynamics
- Government initiatives aligned with EU digital agendas are accelerating adoption of advanced mapping technologies for smart city projects, heritage documentation, and infrastructure management.
- The construction industry's modernization and growing demand for precision in project planning are key catalysts. Looking ahead to 2031, Italy's market will benefit from enhanced investment in digital infrastructure, IoT integration, and cloud-based 3D solutions.
- However, growth rates remain below global averages, suggesting significant potential for market expansion through increased awareness, technology accessibility, and sector-specific applications in manufacturing, logistics, and environmental monitoring..
Market Ecosystem
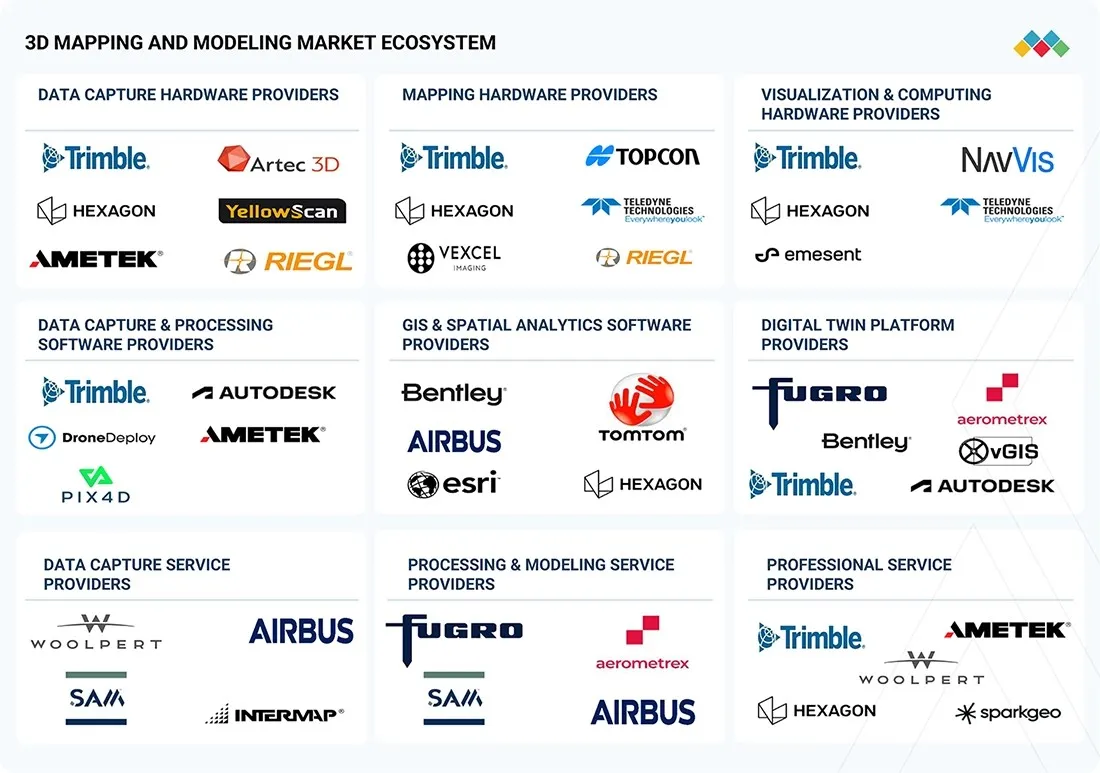
3D MAPPING AND MODELING MARKET: COMMERCIAL USE CASES ACROSS INDUSTRIES
| COMPANY | USE CASE DESCRIPTION | BENEFITS |
|---|---|---|
 |
Cross River Rail is a major Brisbane infrastructure project delivering a 10.2-kilometre rail line, including 5.9 kilometers of twin tunnels beneath the Brisbane River and CBD, four new underground stations, and significant station and network works to increase capacity and resilience. | Improved collaboration among engineering, construction, and geospatial teams through a shared digital environment | Enhanced infrastructure visibility by combining BIM and GIS data into contextualized 3D project views |
 |
Network Rail’s absolute track geometry (ATG) engineers have deployed the Trimble GEDO Scan system to gather detailed information on the track and surrounding features such as bridges, parapets and platforms. The system quickly collects precise, high-resolution data to assist in track clearance assessments on structures and tunnels. | Delivered highly accurate digital representations of railway assets and corridor infrastructure | Improved clearance verification processes for new train fleet introduction and operational readiness assessments |
 |
The operators of New Zealand's electrical network needed to have a solid understanding of the transmission and distribution assets dispersed over vast and varied service regions. Fugro Roames created a digital twin of the electricity grid network in New Zealand in order to overcome these difficulties. | Developed a large-scale digital twin of New Zealand's power grid network, which provided a detailed three-dimensional representation of utility infrastructure | Improved asset visibility and network intelligence through the integration of LiDAR, imagery, and geospatial modeling technologies |
Logos and trademarks shown above are the property of their respective owners. Their use here is for informational and illustrative purposes only.
Related Ecosystem
Analytics
Software And Services
Key Takeaways
- Italy's 3D mapping and modeling market is valued at USD 431.9 million in 2026 and will reach USD 595.2 million by 2031.
- Italy is experiencing a 6.6% CAGR, reflecting steady but moderate growth compared to global expansion rates.
- Smart city initiatives and infrastructure modernization are primary growth drivers for Italy's market.
- Italy's heritage preservation and environmental monitoring sectors present significant opportunities for 3D mapping technology adoption.
3D Mapping and Modeling Market Report Scope
| Report Metric | Details |
|---|---|
| Base Year | 2026 |
| Fastest Growing Segment | SOFTWARE (Offering) |
| Forecast Period | 2026–2031 |
| Growth Rate | CAGR of 10.6% from 2026 to 2031 |
| Largest Segment | LARGE ENTERPRISES (Organization Size) |
| Market Size Base Year (Billions) | ~USD 17.64 (2026) |
| Revenue Forecast (Billions) | ~USD 29.2 (2031) |
| Segments Covered | Offering, Deployment Mode, Organization Size |
Italy 3D Mapping and Modeling Market Report Segmentation
3 segment dimensions are covered across the global market.
By Offering
- Hardware
- Services
- Software
By Deployment Mode
- Cloud
- Hybrid
- On-Premises
By Organization Size
- Large Enterprises
- Smes
ITALY: 3D MAPPING AND MODELING MARKET, BY VERTICAL, 2026–2031
| Segment | 2026 | 2027 | 2028 | 2029 | 2030 | 2031 | CAGR (%) |
|---|---|---|---|---|---|---|---|
| AGRICULTURE & FORESTRY | 28.3 | 30.5 | 32.7 | 35.1 | 37.5 | 40 | 7.2 |
| ARCHITECTURE, ENGINEERING, & CONSTRUCTION (AEC) | 124.7 | 135.3 | 146.3 | 158 | 170.1 | 182.8 | 8 |
| ENERGY & UTILITIES | 49.3 | 52.8 | 56.3 | 59.9 | 63.7 | 67.5 | 6.5 |
| GOVERNMENT & DEFENSE | 56.4 | 60 | 63.7 | 67.4 | 71.2 | 75.1 | 5.9 |
| MANUFACTURING | 38.3 | 41.2 | 44.1 | 47.2 | 50.4 | 53.7 | 7 |
| MINING & MINERALS | 39.1 | 41.7 | 44.4 | 47.2 | 50.1 | 53 | 6.3 |
| OIL & GAS | 27.6 | 29.1 | 30.6 | 32.1 | 33.5 | 35 | 4.9 |
| OTHER VERTICALS | 14 | 14.7 | 15.3 | 16 | 16.6 | 17.2 | 4.3 |
| TELECOMMUNICATIONS | 23.5 | 24.9 | 26.3 | 27.7 | 29.2 | 30.6 | 5.4 |
| TRANSPORTATION & LOGISTICS | 30.6 | 32.4 | 34.3 | 36.3 | 38.2 | 40.2 | 5.7 |
| TOTAL | 431.9 | 462.5 | 494.2 | 526.9 | 560.5 | 595.2 | 6.6 |
Target Audience
- Technology Solution Providers : 3D mapping software and hardware vendors need Italy-specific market data to identify customer segments, assess market penetration rates, and develop localized product strategies.
- Construction & Real Estate Companies : Italian construction firms and real estate developers require market insights to evaluate technology adoption trends, competitive offerings, and ROI potential for 3D mapping investments.
- Government & Urban Planning Agencies : Italian municipal and regional authorities need market intelligence to inform procurement decisions, budget planning, and technology roadmaps for smart city and infrastructure projects.
- Investment & Private Equity Firms : Investors targeting the Italian ICT sector require comprehensive market data to identify acquisition targets, assess growth potential, and evaluate portfolio company performance.
- Consulting & Systems Integration Firms : Italian and international consultants need market-specific insights to advise clients on technology adoption, competitive positioning, and digital transformation initiatives.
Key Companies in the Italy 3D Mapping and Modeling Market
| Company | HQ | Ownership | Strongest segments |
|---|---|---|---|
| FARO TECHNOLOGIES INC | United States | Private Company | 3D metrology hardware (arms, laser trackers, scanners),AEC and O&M reality capture solutions,Public safety analytics and forensic documentation, |
| PARSONS | United States | Public Company | Federal Solutions – Cyber, Intelligence, and Electronic Warfare,Federal Solutions – Space, Missile Defense, and C2,Federal Solutions – Mission Support and Environmental Remediation, |
| BAKER HUGHES INC. | United States | Public Company | Oilfield Services & Equipment,Industrial & Energy Technology, |
| AUTODESK, INC. | United States | Public Company | AEC Design & BIM (AutoCAD, AutoCAD LT, Revit, Civil 3D, BIM Collaborate Pro),Construction Cloud & Preconstruction (Autodesk Build, BuildingConnected, Tandem),Manufacturing Design & PDM (Fusion, Inventor, Product Design & Manufacturing Collection, Vault), |
| TRIMBLE INC. | United States | Public Company | Construction and Owner Software (BIM, VDC, project management),Field and Machine Control Systems,Positioning Services (VRSNow, RTX, xFill), |
| HEXAGON AB | Sweden | Public Company | Manufacturing Intelligence (metrology, CAD/CAM, CAE, quality software),Geosystems (survey, laser scanning, mapping, AEC),Autonomous Solutions & Positioning (GNSS, anti-jam, autonomy), |
| AMETEK, INC. | United States | Public Company | Process, analytical, and industrial instruments (EIG),Aerospace and defense sensors, power, and embedded systems (EIG),Electromechanical motion, thermal management, and motors (EMG), |
| TOPCON CORPORATION | Japan | Private Company | Positioning hardware (total stations, GNSS, laser scanners),IT construction and agricultural systems,Eye diagnostics (OCT, retinal cameras, slit lamps, lasers), |
| TELEDYNE TECHNOLOGIES | United States | Public Company | Digital Imaging (visible, IR, UV, X-ray, MEMS, semiconductors),Instrumentation (monitoring, control, test, connectivity),Aerospace and Defense Electronics, |
| FUGRO | Netherlands | Public Company | Marine site characterization (geophysical, geotechnical, geo-consulting),Marine asset integrity (signals, positioning, construction support, inspection),Land site characterization and asset integrity, |
| COSTAR GROUP, INC. | United States | Public Company | CoStar information and analytics (Property, Leasing, Sales, Owners, Markets, Tenant, hospitality benchmarking, Debt Solutions),Multifamily marketplaces (Apartments.com, Apartamentos.com),Commercial marketplaces (LoopNet, Ten-X, Land.com, BizBuySell.com), |
| BENTLEY SYSTEMS, INCORPORATED | United States | Public Company | Open Modeling Applications (MicroStation, OpenRoads, OpenRail, OpenBuildings, OpenFlows, etc.),Open Simulation & Geoprofessional (ADINA, STAAD, PLAXIS, Leapfrog, GeoStudio, etc.),Infrastructure Cloud Applications (ProjectWise, SYNCHRO, AssetWise, Cesium, iTwin platform), |
| AIRBUS | Netherlands | Public Company | Commercial aircraft (Airbus segment),Helicopters,Defence and Space, |
FARO TECHNOLOGIES INC
FARO Technologies Inc. is a United States-based private company founded in 1981 with 1,181 employees.
PARSONS
Parsons is a United States-based public company founded in 1944 with 21,000 employees.
BAKER HUGHES INC.
Baker Hughes Inc. is a United States-based public company founded in 2016 with 53,000 employees.
AUTODESK, INC.
Autodesk, Inc. is a United States-based public company founded in 1982 with 14,300 employees.
TRIMBLE INC.
Trimble Inc. is a United States-based public company founded in 1978 with 11,500 employees.
HEXAGON AB
Hexagon AB is a Sweden-based public company founded in 1975 with 16,118 employees.
AMETEK, INC.
AMETEK, Inc. is a United States-based public company founded in 1930 with 22,500 employees.
TOPCON CORPORATION
Topcon Corporation is a Japan-based private company founded in 1932 with 5,327 employees.
TELEDYNE TECHNOLOGIES
Teledyne Technologies is a United States-based public company founded in 1960 with 15,800 employees.
FUGRO
Fugro is a Netherlands-based public company founded in 1962 with 9,062 employees.
COSTAR GROUP, INC.
CoStar Group, Inc. is a United States-based public company founded in 1986 with 8,441 employees.
BENTLEY SYSTEMS, INCORPORATED
Bentley Systems, Incorporated is a United States-based public company founded in 1984 with 5,800 employees.
AIRBUS
Airbus is a Netherlands-based public company founded in 1998 with 166,876 employees.
Reasons to Buy this Report
- Market Size Validation : Obtain precise market valuation data for Italy (USD 431.9M in 2026), enabling accurate budget allocation and investment decisions for market entry or expansion strategies.
- Growth Trajectory Insights : Understand Italy's 6.6% CAGR trajectory through 2031, identifying growth opportunities and competitive positioning relative to the global 10.6% benchmark.
- Sector-Specific Intelligence : Access detailed analysis of key Italian sectors driving adoption—urban planning, construction, and digital infrastructure—to tailor product development and go-to-market strategies.
- Competitive Landscape Analysis : Benchmark your organization against Italy-specific market dynamics, identify emerging competitors, and discover white-space opportunities in underserved segments.
- Strategic Planning & Forecasting : Leverage 5-year forecast data (2026-2031) to develop long-term business plans, resource allocation strategies, and risk mitigation approaches for the Italian market.
Frequently asked questions
What is the current market size of 3D mapping and modeling in Italy?
Italy's 3D mapping and modeling market is estimated at USD 431.9 million in 2026.
What is the projected market size for Italy by 2031?
Italy's 3D mapping and modeling market is projected to reach USD 595.2 million by 2031.
What is the CAGR for Italy's 3D mapping and modeling market?
Italy's market is expected to grow at a compound annual growth rate (CAGR) of 6.6% from 2026 to 2031.
Which sectors are driving growth in Italy's 3D mapping market?
Smart city initiatives, urban planning, construction, heritage preservation, and environmental monitoring are key growth drivers in Italy.
How does Italy's market growth compare to global trends?
Italy's 6.6% CAGR is lower than the global CAGR of 10.6%, indicating more moderate growth in the Italian market.
RESEARCH METHODOLOGY
The research methodology for the 3D mapping and modeling market report involved extensive secondary research using company publications and company publications, as well as various reputable corporate technology portals to identify and collect relevant information for this technology-driven market study. In-depth interviews were conducted with various primary respondents, including 3D mapping software providers, geospatial technology companies, LiDAR and laser scanning equipment manufacturers, UAV solution providers, system integrators, engineering and construction firms, and senior executives from organizations offering 3D mapping, modeling, digital twin, BIM, and reality capture solutions, along with industry consultants, to obtain and validate critical qualitative and quantitative information and assess market trends, technology advancements, and adoption across key end-use industries.
Secondary Research
During the secondary research process, various secondary sources were consulted to identify and collect information for the study. The secondary sources included annual reports, press releases, and investor presentations of companies, white papers, and certified publications such as ISPRS Journal of Photogrammetry and Remote Sensing, Photogrammetric Engineering & Remote Sensing (PE&RS), Journal of Spatial Science, Journal of Surveying Engineering, GIScience & Remote Sensing, Remote Sensing, Computers, Environment and Urban Systems, Geo-spatial Information Science, International Journal of Digital Earth, Automation in Construction, and Journal of Building Engineering; and articles from recognized associations and government publishing sources including but not limited to the International Society for Photogrammetry and Remote Sensing (ISPRS), Open Geospatial Consortium (OGC), United States Geological Survey (USGS), National Geospatial-Intelligence Agency (NGA), Federal Geographic Data Committee (FGDC), National Aeronautics and Space Administration (NASA), European Space Agency (ESA), EuroGeographics, United Nations Committee of Experts on Global Geospatial Information Management (UN-GGIM), American Society for Photogrammetry and Remote Sensing (ASPRS), Royal Institution of Chartered Surveyors (RICS), and the National Institute of Standards and Technology (NIST). These sources were used to obtain and validate technical information, market developments, technology trends, competitive intelligence, regulatory updates, and adoption patterns across the global 3D mapping and modeling ecosystem.
Secondary research was used to gather key information on the industry’s value chain, the market’s supply chain, the overall pool of key players, market classification, and segmentation based on industry trends, regional markets, and key developments from both market- and technology-oriented perspectives.
Primary Research
In the primary research process, a diverse range of stakeholders from both the supply and demand sides of the 3D mapping and modeling ecosystem were interviewed to gather qualitative and quantitative insights specific to this market. From the supply side, key industry experts, including chief executive officers (CEOs), vice presidents (VPs), marketing directors, technology and innovation directors, product managers, and technical specialists from companies offering 3D mapping software, LiDAR systems, laser scanners, photogrammetry solutions, UAV mapping platforms, digital twin technologies, and geospatial services, were consulted. Additionally, system integrators, engineering solution providers, survey equipment manufacturers, and cloud platform providers involved in implementing 3D mapping and modeling solutions were included in the study. On the demand side, input from engineering managers, survey professionals, GIS specialists, construction project managers, infrastructure planners, utility operators, mining companies, transportation authorities, and government agencies was collected to understand enterprise adoption patterns, implementation challenges, and future investment priorities.
The primary research ensured that all critical parameters influencing the 3D mapping and modeling market, including technology advancements, digital transformation initiatives, infrastructure modernization, and evolving application requirements, were thoroughly assessed. Each factor was carefully analyzed, verified through primary research, and evaluated to obtain precise qualitative and quantitative data for this market.
Once the initial phase of market engineering was completed, including detailed calculations for market statistics, segment-specific growth forecasts, and data triangulation, a second round of primary research was conducted. This step was crucial for refining and validating critical data points, such as software and hardware adoption trends, digital twin deployment, reality capture implementation, BIM integration, LiDAR and photogrammetry adoption, competitive positioning, and key market dynamics, including demand drivers, opportunities, challenges, and restraints. Additional validation covered the increasing adoption of cloud-based geospatial platforms, AI-enabled spatial analytics, connected construction workflows, infrastructure asset management, and digital engineering initiatives across end-use industries.
The comprehensive market engineering process, together with top-down and bottom-up approaches and multiple data triangulation methods, was extensively employed to estimate and forecast the overall market, as well as all major segments and subsegments. Extensive qualitative and quantitative validation was conducted throughout the market engineering process to capture critical information and insights across the entire 3D mapping and modeling value chain.
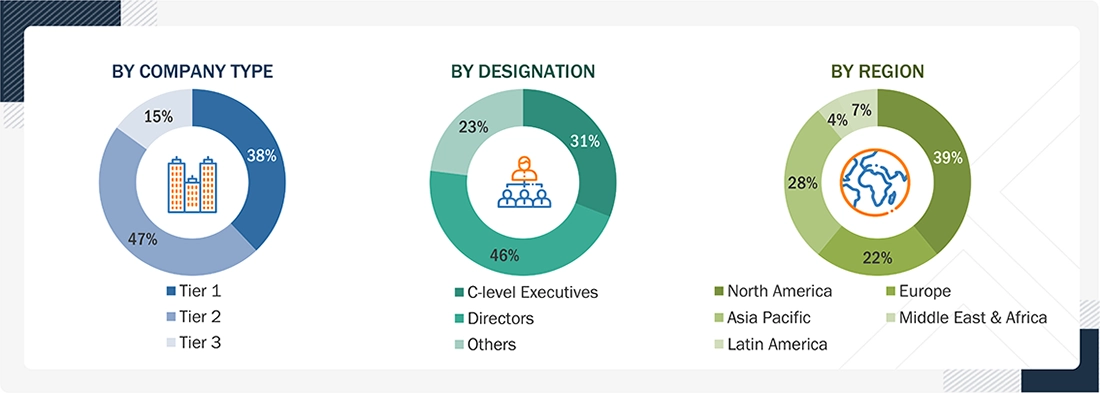
Note: Others include sales, marketing, and product managers.
Tier 1 companies’ revenues are more than USD 500 million, tier 2 companies’ revenues range between USD 500 and 100 million, and tier 3 companies’ revenues are equals to or less than USD 100 million.
Source: Industry Experts
To know about the assumptions considered for the study, download the pdf brochure
Market Size Estimation
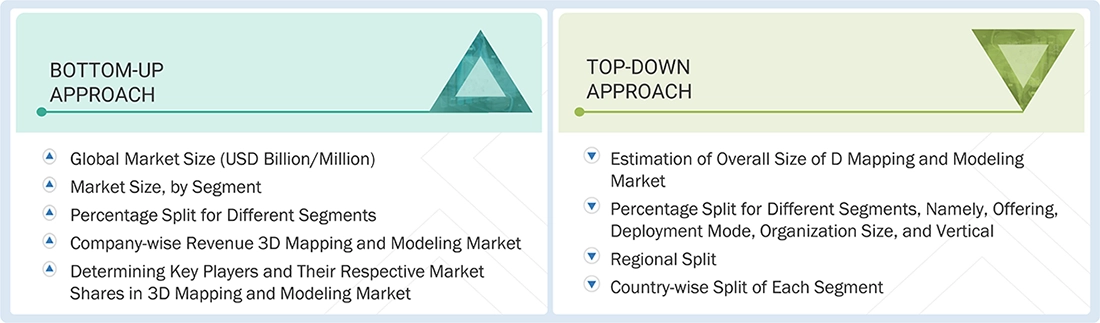
The top-down and bottom-up approaches were employed to estimate and forecast the 3D mapping and modeling market, as well as its dependent submarkets. This multi-layered analysis was further reinforced through data triangulation, which incorporated primary and secondary research inputs. The market figures were also validated against the existing MarketsandMarkets repository for accuracy.
3D Mapping and Modeling Market : Top-Down and Bottom-Up Approach
Data Triangulation
The market was divided into several segments and subsegments after determining the overall market size using the market size estimation processes described above. To complete the overall market engineering process and determine the exact statistics for each market segment and subsegment, data triangulation and market segmentation procedures were employed, wherever applicable. The overall market size was then used in the top-down approach to estimate the size of other individual markets by applying percentage splits to the market segmentation.
Market Definition
3D mapping and modeling refer to creating three-dimensional representations of real-world objects, environments, landscapes, or virtual entities using various technologies and software tools. This involves capturing and processing data from the physical world to generate detailed digital models that accurately represent the shape, texture, and characteristics of the objects or spaces. 3D mapping typically involves techniques such as LiDAR and photogrammetry, which use lasers or photographs taken from different angles to measure distances and create 3D representations. This data is then transformed into point clouds or mesh models, providing a detailed view of the object’s surface or the environment. 3D modeling, on the other hand, involves the creation of digital 3D models from scratch or based on existing data. CAD software and other modeling tools enable designers and engineers to build virtual representations of objects, buildings, products, or landscapes.
Key Stakeholders
- 3D mapping software vendors
- 3D modeling software vendors
- Lidar system manufacturers
- 3D laser scanning equipment providers
- UAV/drone mapping solution providers
- Photogrammetry solution providers
- Geospatial and GIS technology providers
- Digital twin solution providers
- Building information modeling (BIM) solution providers
- System integrators (SIs) and engineering service providers
- Value-added resellers (VARs) and distributors
- Cloud-based geospatial platform providers
Report Objectives
- To define, describe, and predict the 3D mapping and modeling market by offering, deployment mode, organization size, vertical, and region
- To provide detailed information related to major factors (drivers, restraints, opportunities, and industry-specific challenges) influencing market growth
- To analyze opportunities in the market and provide details of the competitive landscape for stakeholders and market leaders
- To forecast the market size of segments with respect to five main regions: North America, Europe, Asia Pacific, the Middle East & Africa, and Latin America
- To analyze each submarket with respect to individual growth trends, prospects, and contributions to the overall 3D mapping and modeling market
- To analyze competitive developments, such as partnerships, new product launches, mergers & acquisitions, in the 3D mapping and modeling market
- To analyze the competitive developments, such as partnerships, product launches, mergers and acquisitions, in the 3D mapping and modeling market
- To analyze the impact of macroeconomic factors on the 3D mapping and modeling market across all regions
Available customizations:
Using the provided market data, MarketsandMarkets offers customizations tailored to the company’s specific needs. The following customization options are available for the report.
Product Analysis
- Product comparative analysis, which gives a detailed comparison of innovative products being offered by prominent vendors
Geographic Analysis
- Further breakup of additional European countries by offering, deployment mode, organization size, and vertical
- Further breakup of additional Asia Pacific countries by offering, deployment mode, organization size, and vertical
- Further breakup of additional Middle Eastern & African countries by offering, deployment mode, organization size, and vertical
- Further breakup of additional Latin American countries by offering, deployment mode, organization size, and vertical
Company Information
- Detailed analysis and profiling of additional market players (up to five)
Get the Full 3D Mapping and Modeling Market Report
Full forecast, segment splits, and company analysis for all 3D Mapping and Modeling Market.
- Canada 3D Mapping and Modeling Market
- US 3D Mapping and Modeling Market
- UK 3D Mapping and Modeling Market
- Germany 3D Mapping and Modeling Market
- France 3D Mapping and Modeling Market
- Spain 3D Mapping and Modeling Market
- China 3D Mapping and Modeling Market
- India 3D Mapping and Modeling Market
- Japan 3D Mapping and Modeling Market
- South Korea 3D Mapping and Modeling Market
- Saudi Arabia 3D Mapping and Modeling Market
- UAE 3D Mapping and Modeling Market
- Turkey 3D Mapping and Modeling Market
- South Africa 3D Mapping and Modeling Market
- Brazil 3D Mapping and Modeling Market
- Mexico 3D Mapping and Modeling Market
- Argentina 3D Mapping and Modeling Market
Need a Tailored Report?
Customize this report to your needs
Get 10% FREE Customization
Customize This Report
