
Rest Of Asia Pacific AI Avatar Market (2025-2030)

The Rest Of Asia Pacific AI Avatar Market was valued at $8.8 Million in 2025 and projected to reach to $76.7 Million by 2030, representing a compound annual growth rate of 36.3%. Rest Of Asia Pacific represents one of the most dynamic segments within the global AI Avatar Market, driven by rapid digital adoption and increasing investment in emerging technologies.


| Market Size in | USD 26.32 MN |
| Market Forecast in | |
| CAGR | |
| Forecast Period | |
| Units Considered | Value (USD MN) |
Rest Of Asia Pacific AI Avatar Market Trends and Insights
- The region is experiencing accelerated adoption of AI avatar technologies across enterprise, entertainment, and customer service applications.
- Rest Of Asia Pacific is projected to expand significantly to $76.7 million by 2030, reflecting a compound annual growth rate of 36.3% over the forecast period. The rapid expansion in Rest Of Asia Pacific is driven by increasing digital transformation initiatives, rising demand for personalized customer experiences, and growing investments in AI and virtual communication technologies.
- Rest Of Asia Pacific's emerging markets are particularly receptive to avatar-based solutions for e-commerce, gaming, and virtual events.
- The region's tech-savvy population and expanding digital infrastructure position Rest Of Asia Pacific as a critical growth market for AI avatar vendors through 2030. Rest Of Asia Pacific's competitive landscape is characterized by both regional innovators and global players establishing local operations.
- The region's growth trajectory outpaces the global average, underscoring the strategic importance of Rest Of Asia Pacific for market participants seeking to capture emerging opportunities in AI-driven virtual engagement solutions..
Key Market Statistics
- CAGR (2025-2030) 36.3% CAGR
- Market Size, 2025 ~USD 8.8 Million
- Forecast, 2030 ~USD 76.7 Million
- Country Rest Of Asia Pacific
Rest Of Asia Pacific AI Avatar Market Overview
Explosive Growth Trajectory :
Rest Of Asia Pacific's AI Avatar Market is projected to grow from $8.8 million in 2025 to $76.7 million by 2030, representing a 36.3% CAGR—outpacing the global average of 33.1%.
Enterprise Adoption Surge :
Organizations across Rest Of Asia Pacific are rapidly deploying AI avatars for customer service automation, employee training, and virtual assistance, driving significant market expansion.
Entertainment & Gaming Boom :
The region's thriving entertainment and gaming sectors are increasingly integrating AI avatar technology for immersive experiences, content creation, and virtual influencer development.
Cost-Effective Digital Transformation :
Rest Of Asia Pacific enterprises are leveraging AI avatars as affordable alternatives to traditional customer engagement solutions, accelerating digital transformation initiatives across diverse industries.
Rest Of Asia Pacific AI Avatar Market Dynamics
- The region's diverse economy—spanning retail, finance, healthcare, and entertainment—creates multiple growth vectors for AI avatar deployment.
- Enterprise customers are increasingly recognizing the value of AI avatars for cost reduction and enhanced customer experiences. The forecast period through 2030 will witness accelerated market penetration as infrastructure improves and local vendors develop region-specific solutions.
- Government initiatives supporting digital innovation, coupled with rising smartphone penetration and internet connectivity, will further catalyze adoption.
- Rest Of Asia Pacific's young, tech-savvy population and competitive labor markets make AI avatar solutions particularly attractive for businesses seeking operational efficiency and scalability..
Market Ecosystem
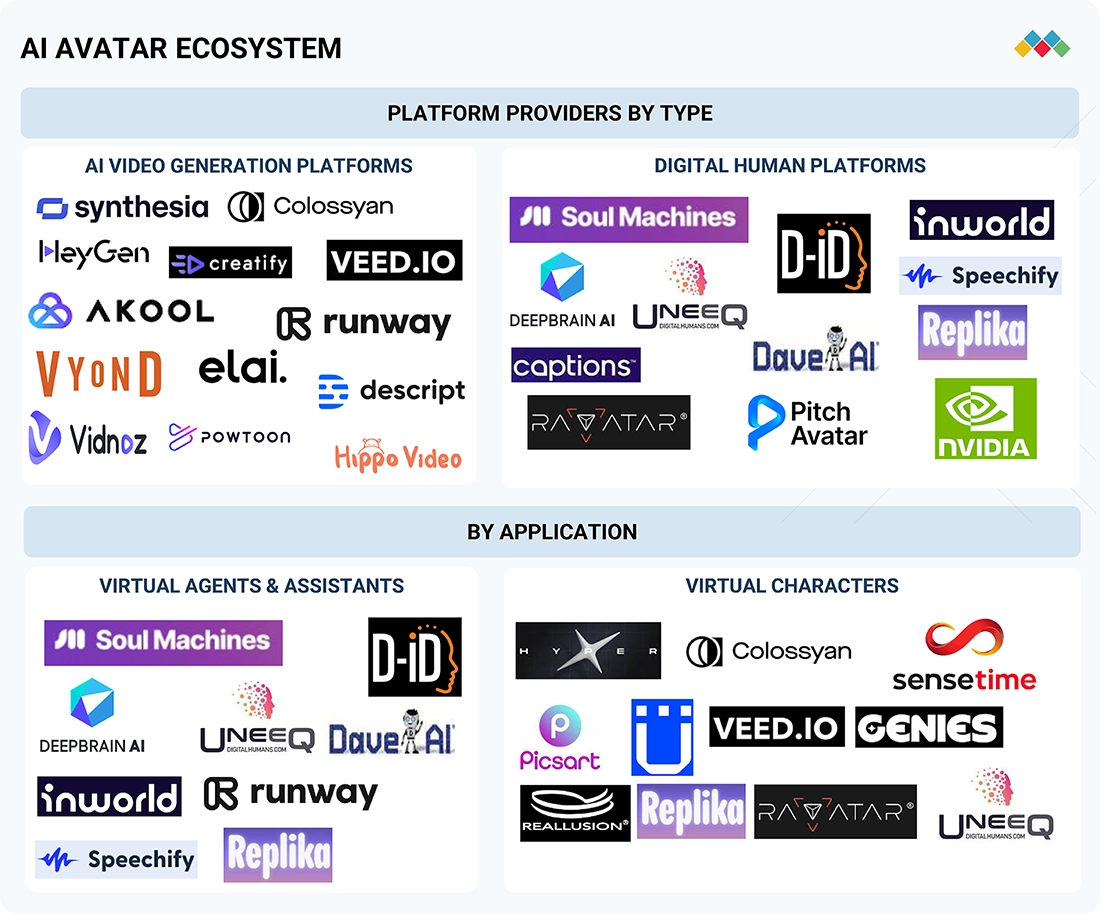
AI Avatar Market: COMMERCIAL USE CASES ACROSS INDUSTRIES
| COMPANY | USE CASE DESCRIPTION | BENEFITS |
|---|---|---|
 |
Gameloft used D-ID Studio to create engaging, character-driven video ads by animating static game characters for user acquisition campaigns. | The production costs and time has been reduced and eliminated the need for voice actors, and improved marketing efficiency, resulting in stronger user engagement and faster campaign delivery. |
 |
STUDIO 47 adopted HeyGen’s AI avatars to automate news content creation, optimizing production workflows and improving efficiency across multiple digital distribution platforms. | Boosted content production speed by 80%, enabled localization for wider reach, reduced newsroom workload, and allowed journalists to focus on high-value investigative reporting. |
 |
Titan Training Solutions leveraged Speechify Studio’s text-to-speech tools to produce clear, consistent, and customizable voice-overs for e-learning and promotional materials. | Enhanced learner comprehension and retention, accelerated audio production, reduced costs, and improved training and marketing content quality through consistent, high-clarity voice output. |
 |
Hero MotoCorp implemented DaveAI’s virtual avatar “Zeni” to guide employees through new digital tools and product features via immersive, interactive experiences. | Accelerated technology adoption, improved employee engagement and understanding, enhanced productivity, and positioned the company as a leader in AI-driven digital transformation and workforce enablement. |
Logos and trademarks shown above are the property of their respective owners. Their use here is for informational and illustrative purposes only.
Related Ecosystem
Software And Services
- Natural Language Processing (NLP)
- Machine Learning
- Supply Chain Management
- Predictive Analytics
- Image Sensors
- International Business Machines Corporation
- MICROSOFT CORPORATION
- Oracle Corporation
- SAP SE
- Amazon.com, Inc.
Key Takeaways
- Rest Of Asia Pacific's AI Avatar Market is valued at $8.8 million in 2025 and is forecast to reach $76.7 million by 2030, representing an 8.7x expansion over five years.
- Rest Of Asia Pacific exhibits a 36.3% CAGR, significantly outpacing the global average of 33.1%, positioning the region as a premium growth market.
- Rest Of Asia Pacific's growth is fueled by digital transformation, e-commerce expansion, and increasing adoption of virtual communication platforms across emerging economies.
- Rest Of Asia Pacific attracts both regional startups and multinational technology firms, creating a dynamic competitive environment with diverse solution offerings.
AI Avatar Market Report Scope
| Report Metric | Details |
|---|---|
| Base Year | 2025 |
| Fastest Growing Segment | FULLY CUSTOMIZABLE AVATARS (Degree Of Customization) |
| Forecast Period | 2025–2030 |
| Growth Rate | CAGR of 33.1% from 2025 to 2030 |
| Largest Segment | ENTERPRISE USERS (End User) |
| Market Size Base Year (Billions) | ~USD 0.8 (2025) |
| Revenue Forecast (Billions) | ~USD 3.35 (2030) |
| Segments Covered | Platform, Degree Of Customization, Type, Application, Virtual Agents & Assistants, End User, Enterprise, Enterprises |
Rest Of Asia Pacific AI Avatar Market Report Segmentation
8 segment dimensions are covered across the global market.
By Platform
- 3D & Metaverse Avatar
- 3D & Metaverse Avatars
- AI Video Generation Platform
- AI Video Generation Platforms
- Interactive Digital Human Platforms
- Stylized Avatar & Social Media Tools
By Degree Of Customization
- Fully Customizable Avatars
- Partially Customizable Avatars
- Pre-Set Avatars
- Preset Avatars
By Type
- Interactive Avatars
- Noninteractive Avatars
By Application
- Virtual Agents & Assistants
- Virtual Characters
- Virtual Companions
- Virtual Influencers
By Virtual Agents & Assistants
- Customer Support & Service
- Education & Tutoring
- Enterprise Training & Hr
- Sales & Business Enablement
By End User
- Enterprise Users
- Enterprises
- Individual Users
By Enterprise
- Automotive
- Bfsi
- Construction & Real Estate
- Education
- Healthcare & Life Sciences
- Media & Entertainment
- Retail & E-Commerce
- Technology & Software
- Travel & Hospitality
By Enterprises
- Automotive
- Bfsi
- Construction & Real Estate
- Education
- Healthcare & Life Sciences
- Media & Entertainment
- Retail & E-Commerce
- Technology & Software
- Travel & Hospitality
Target Audience
- Enterprise Technology Leaders : CIOs and digital transformation executives in Rest Of Asia Pacific need market intelligence to evaluate AI avatar investments, benchmark against regional competitors, and justify technology budgets.
- AI Avatar Solution Providers : Software vendors and technology companies require detailed Rest Of Asia Pacific market data to identify growth opportunities, target customer segments, and develop region-specific product strategies.
- Investment & Private Equity Firms : Investors evaluating opportunities in Rest Of Asia Pacific's AI sector need comprehensive market sizing, growth projections, and competitive analysis to inform investment decisions and valuations.
- Consulting & Strategy Firms : Management consultants advising clients on digital transformation and technology adoption require Rest Of Asia Pacific-specific market data to develop credible recommendations and business cases.
- Industry Analysts & Researchers : Market researchers and business intelligence professionals need granular Rest Of Asia Pacific data to support competitive analysis, trend forecasting, and industry benchmarking activities.
Key Companies in the Rest Of Asia Pacific AI Avatar Market
| Company | HQ | Ownership | Strongest segments |
|---|---|---|---|
| VERITONE | United States | Public Company | aiWARE platform software (licenses and subscriptions),Managed services and cloud-native digital content management,Content licensing and representation services, |
| REALLUSION | Taiwan | Public Company | iClone (core 3D animation and real-time cinematic),Character Creator and plug-ins (Headshot, SkinGen, Iray, etc.),Cartoon Animator and Motion LIVE 2D, |
| SENSETIME | China | Public Company | SenseFoundry (Enterprise + Smart City),SenseNova and AI Data Center Services,SenseAuto (Automotive Platform), |
| PERFECT CORP | Taiwan | Public Company | AI/AR makeup & hair try-on (enterprise SaaS),AI skin diagnosis & skincare recommendation,AI/AR jewelry, accessories, glasses, watches, and nails, |
VERITONE
Veritone is a publicly traded U.S. company founded in 2014 with 442 employees that provides AI-powered solutions for media and entertainment industries.
REALLUSION
RealLusion is a publicly traded Taiwanese company founded in 1982 with 142 employees specializing in digital content creation software.
SENSETIME
SenseTime is a publicly traded Chinese company founded in 2014 with 2,472 employees specializing in artificial intelligence and computer vision technologies.
PERFECT CORP
Perfect Corp is a publicly traded Taiwanese company founded in 2015 offering beauty technology and virtual try-on solutions.
Reasons to Buy this Report
- Regional Market Sizing & Forecasts : Obtain precise market valuation data specific to Rest Of Asia Pacific with detailed projections through 2030, enabling accurate budget allocation and investment planning for regional expansion.
- Competitive Landscape Intelligence : Understand key players, market share distribution, and competitive dynamics unique to Rest Of Asia Pacific, identifying partnership and acquisition opportunities in this high-growth segment.
- Segment & Application Analysis : Access detailed breakdowns of AI avatar adoption across enterprise, entertainment, customer service, and emerging use cases specific to Rest Of Asia Pacific markets and industries.
- Growth Driver Identification : Discover region-specific factors accelerating 36.3% CAGR growth, including regulatory environment, technology infrastructure, and customer behavior patterns unique to Rest Of Asia Pacific.
- Strategic Market Entry Planning : Leverage comprehensive Rest Of Asia Pacific insights to develop targeted go-to-market strategies, identify high-potential sub-regions, and optimize resource allocation for market penetration.
Frequently asked questions
What is the current market size of AI Avatars in Rest Of Asia Pacific?
Rest Of Asia Pacific's AI Avatar Market is estimated at $8.8 million in 2025, with significant growth anticipated through the forecast period.
What is the projected market size for Rest Of Asia Pacific by 2030?
Rest Of Asia Pacific is projected to reach $76.7 million by 2030, representing a compound annual growth rate of 36.3%.
How does Rest Of Asia Pacific's growth rate compare to the global market?
Rest Of Asia Pacific's CAGR of 36.3% exceeds the global CAGR of 33.1%, indicating the region is growing faster than the worldwide average.
What are the primary drivers of AI Avatar adoption in Rest Of Asia Pacific?
Rest Of Asia Pacific's growth is driven by digital transformation initiatives, e-commerce expansion, gaming industry development, and increased demand for virtual customer engagement solutions.
Which industries are leading AI Avatar adoption in Rest Of Asia Pacific?
Rest Of Asia Pacific is seeing strong adoption across e-commerce, entertainment, gaming, customer service, and enterprise communication sectors.
RESEARCH METHODOLOGY
This research study on the AI avatar market used extensive secondary sources, including directories, the IEEE, and paid databases such as the International Journal of Innovation and Technology Management. Primary sources were mainly industry experts from the core and related industries, preferred AI avatar providers, third-party service providers, consulting service providers, end users, and other commercial enterprises. In-depth interviews with primary respondents, including key industry participants and subject matter experts, were conducted to obtain and verify critical qualitative and quantitative information and assess the market’s prospects.
Secondary Research
In the secondary research process, various sources were referred to identify and collect information for this study. Secondary sources included annual reports, press releases, and investor presentations of companies; white papers, journals, and certified publications; and articles from recognized authors, directories, and databases. The data was also collected from other secondary sources, such as journals, government websites, blogs, and vendors’ websites. Additionally, the AI avatar spending of various countries was extracted from the respective sources.
Primary Research
In the primary research process, various sources from the supply and demand sides were interviewed to obtain qualitative and quantitative information on the market. The primary sources from the supply side included various industry experts, such as Chief Experience Officers (CXOs), Vice Presidents (VPs), and directors specializing in business development, marketing, and AI avatar providers. It also included key executives from AI avatar solution vendors, system integrators (SIs), professional service providers, industry associations, and other key opinion leaders.
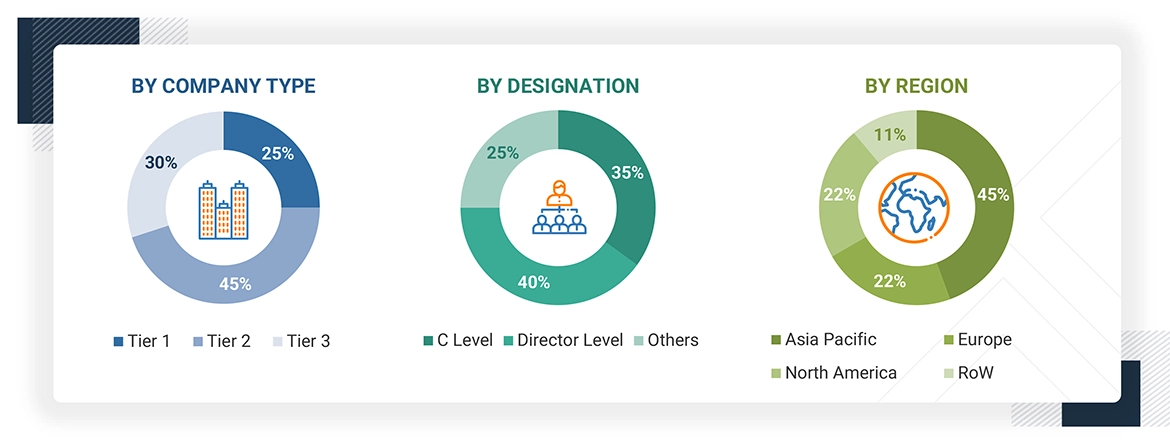
Note 1: Others include sales managers, marketing managers, and product managers.
Note 2: Tier 1 companies’ revenues are more than USD 10 billion; tier 2 companies’ revenues range between USD 1 and 10 billion; and tier 3 companies’ revenues range between USD 500 million and USD 1 billion.
Source: Industry Experts
To know about the assumptions considered for the study, download the pdf brochure
Market Size Estimation
Multiple approaches were adopted to estimate and forecast the AI avatar market. The first approach involved estimating the market size by companies’ revenue generated through the sale of AI avatar products.
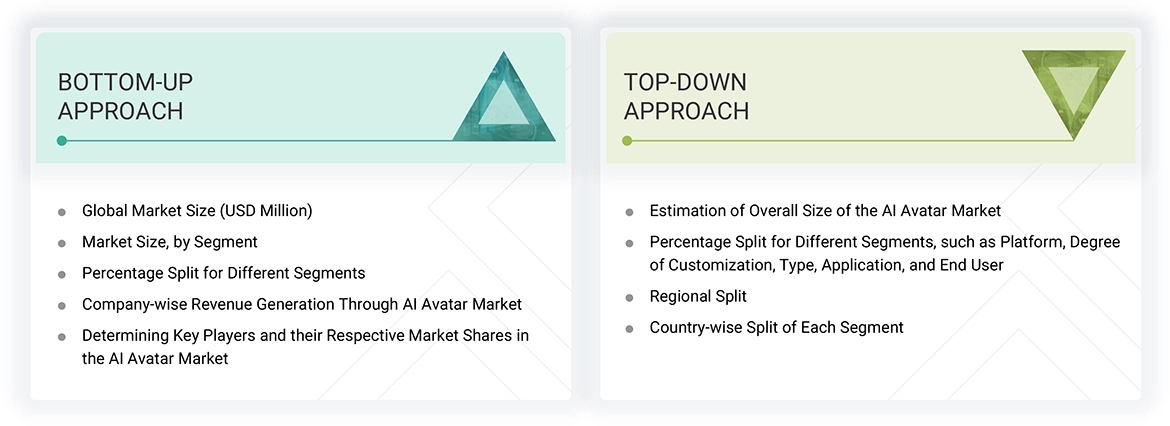
Market Size Estimation Methodology: Top-down Approach
In the top-down approach, an exhaustive list of all the vendors offering products in the AI avatar market was prepared. The revenue contribution of the market vendors was estimated through annual reports, press releases, funding, investor presentations, paid databases, and primary interviews. Each vendor’s offerings were evaluated based on platform, degree of customization, type, application, end user, and region. The markets were triangulated through primary and secondary research. The primary procedure included extensive interviews for key insights from industry leaders, such as CIOs, CEOs, VPs, directors, and marketing executives. The market figures were further cross-verified with the existing repository from MarketsandMarkets for validation.
Market Size Estimation Methodology: Bottom-up Approach
In a bottom-up approach, the adoption rate of AI avatar products across sectors in key countries was identified, emphasizing the regions that contribute most to the market share. For cross-validation, the adoption of AI avatar products among enterprises and various use cases based on their respective regions was identified. Weightage was assigned to these use cases in different regions for market size calculation.
Based on the market numbers, the regional split was determined by primary and secondary sources. The procedure included an analysis of the AI avatar market’s regional penetration. Based on secondary research, the regional spending on Information and Communications Technology (ICT), socio-economic analysis of each country, strategic vendor analysis of major AI avatar providers, and organic and inorganic business development activities of regional and global players were estimated.
AI Avatar Market : Top-Down and Bottom-Up Approach
Data Triangulation
After determining the overall market size using the market size estimation processes explained above, the market was split into several segments and subsegments. Data triangulation and market breakup procedures were employed, wherever applicable, to complete the overall market engineering process and determine the exact statistics of each market segment and subsegment. The overall market size was then used in the top-down procedure to estimate the size of other individual markets via percentage splits of the market segmentation.
Market Definition
An AI avatar is a computer-generated digital human that emulates real-life human expressions, movements, and speech patterns to facilitate realistic virtual interactions. These avatars use advanced artificial intelligence technologies, including machine learning, computer vision, and natural language processing, to replicate human behaviors such as facial expressions, gestures, and speech.
Stakeholders
- AI avatar software providers
- Business analysts
- Cloud service providers
- Consulting service providers
- Enterprise end users
- Distributors and value-added resellers (VARs)
- Government agencies
- Independent software vendors (ISV)
- Managed service providers
- Market research and consulting firms
- Support & maintenance service providers
- System integrators (SIs)/migration service providers
- Technology providers
- Training data providers
- Content creators & designers
- Privacy & security providers
- Platform providers
Report Objectives
- To define, describe, and forecast the AI avatar market by platform, degree of customization, type, application, and end user
- To provide detailed information related to major factors (drivers, restraints, opportunities, and industry-specific challenges) influencing market growth
- To analyze the micro markets with respect to individual growth trends, prospects, and their contribution to the total market
- To analyze the opportunities in the market for stakeholders by identifying the high-growth segments of the market
- To assess market opportunities and provide details of the competitive landscape for stakeholders and market leaders
- To forecast the market size of segments for the five main regions: North America, Europe, Asia Pacific, the Middle East & Africa, and Latin America
- To profile the key players and comprehensively analyze their market ranking and core competencies
- To analyze competitive developments, such as partnerships, product launches, and mergers and acquisitions, in the AI avatar market
Available Customizations
With the given market data, MarketsandMarkets offers customizations based on the company’s specific needs. The following customization options are available for the report:
Product Analysis
- The product matrix provides a detailed comparison of the product portfolio of each company.
Geographic Analysis as per Feasibility
- Further breakup of the North American AI avatar market
- Further breakup of the European market
- Further breakup of the Asia Pacific market
- Further breakup of the Middle East & Africa market
- Further breakup of the Latin American AI avatar market
Company Information
- Detailed analysis and profiling of additional market players (up to five)
Get the Full AI Avatar Market Report
Full forecast, segment splits, and company analysis for all AI Avatar Market.
- Canada AI Avatar Market
- US AI Avatar Market
- UK AI Avatar Market
- Germany AI Avatar Market
- France AI Avatar Market
- Italy AI Avatar Market
- Spain AI Avatar Market
- China AI Avatar Market
- Japan AI Avatar Market
- India AI Avatar Market
- South Korea AI Avatar Market
- Singapore AI Avatar Market
- Saudi Arabia AI Avatar Market
- UAE AI Avatar Market
- Qatar AI Avatar Market
- South Africa AI Avatar Market
- Brazil AI Avatar Market
- Mexico AI Avatar Market
- Argentina AI Avatar Market
- Rest Of Europe AI Avatar Market
Need a Tailored Report?
Customize this report to your needs
Get 10% FREE Customization
Customize This Report
